. 2018 Jan 2;215(1):51-62.
doi: 10.1084/jem.20161066. Epub 2017 Nov 30.

Metabolic reprogramming of human CD8+ memory T cells through loss of SIRT1

Affiliations

Metabolic reprogramming of human CD8+ memory T cells through loss of SIRT1

Mark Y Jeng et al. J Exp Med. .

Abstract

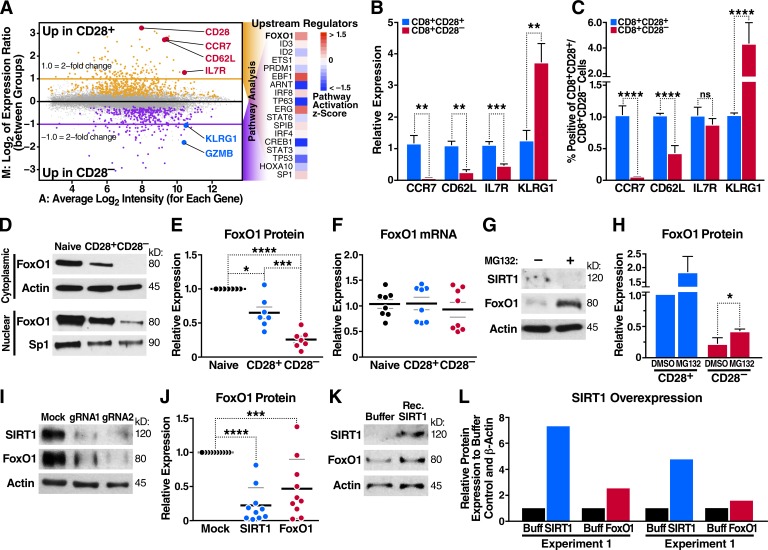
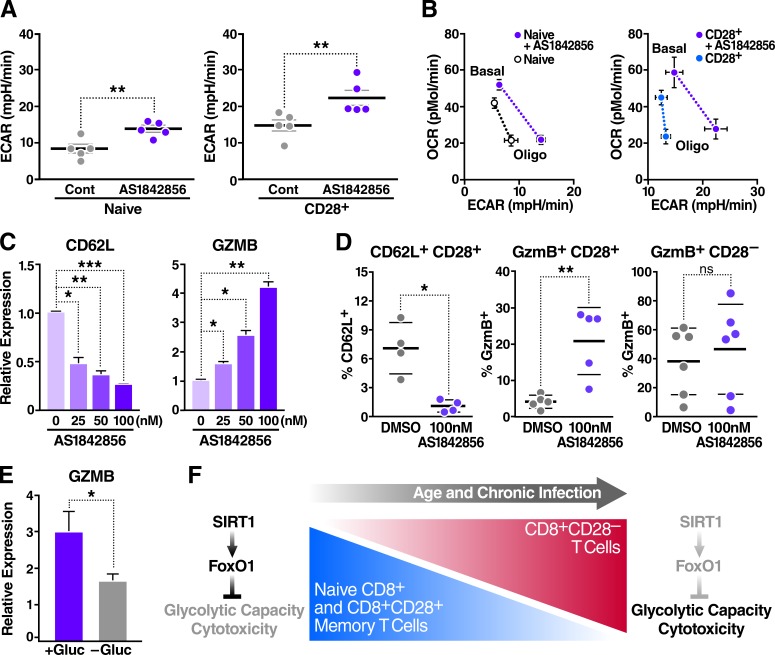
The expansion of CD8+CD28- T cells, a population of terminally differentiated memory T cells, is one of the most consistent immunological changes in humans during aging. CD8+CD28- T cells are highly cytotoxic, and their frequency is linked to many age-related diseases. As they do not accumulate in mice, many of the molecular mechanisms regulating their fate and function remain unclear. In this paper, we find that human CD8+CD28- T cells, under resting conditions, have an enhanced capacity to use glycolysis, a function linked to decreased expression of the NAD+-dependent protein deacetylase SIRT1. Global gene expression profiling identified the transcription factor FoxO1 as a SIRT1 target involved in transcriptional reprogramming of CD8+CD28- T cells. FoxO1 is proteasomally degraded in SIRT1-deficient CD8+CD28- T cells, and inhibiting its activity in resting CD8+CD28+ T cells enhanced glycolytic capacity and granzyme B production as in CD8+CD28- T cells. These data identify the evolutionarily conserved SIRT1-FoxO1 axis as a regulator of resting CD8+ memory T cell metabolism and activity in humans.


Figures

Figure 1.
Figure 1.
SIRT1 levels are down-regulated in human CD8+CD28 T cells. (A) Sorting strategy for CD8+ naive, a CD28+-expressing TCM/TTM/TEMRA pool, and CD28 TEM/TEMRA cells from a healthy donor based on surface markers CD3, CD8, CD28, CCR7, and CD45RA. (B–D) SIRT1 expression was assessed by Western blot (B and C, n = 9), and qRT-PCR was normalized to RPL13A (n = 7; paired one-way ANOVA; D). (E) SIRT6 and SIRT7 expression was measured by Western blot (n = 2). (F and G) CD28 surface expression was monitored by flow cytometry from sorted CD8+CD28+ during long-term IL-15 treatment (representative, n = 3). (H) SIRT1 protein expression was measured after sorting ex vivo–generated CD28+ and CD28 T cells (day 20 of IL-15 treatment); representative blot (n = 2). Data are mean ± SEM of individual donors. **, P < 0.01; ****, P < 0.0001.
Figure 2.
Figure 2.
Loss of SIRT1 promotes metabolic reprogramming in resting CD8+CD28 T cells. Metabolism of sorted human CD8+ T cell populations was assessed using an extracellular flux (XF) analyzer. (A and B) OCR and ECAR measured in freshly isolated T cell subsets (shown is the mean of biological replicates, n = 7). (C) Glycolytic capacity of T cell subsets (n = 7, paired one-way ANOVA). (D) Energy profile (OCR vs. ECAR) of sorted T cells. Dotted lines indicate corresponding OCR-ECAR data points (shown is the mean of biological replicates, n = 7). (E) ECAR measurement after 48 h of glucose deprivation (representative, n = 2). (F) Lactate concentrations in sorted T cell populations were analyzed by gas chromatography time-of-flight mass spectrometry (GC-TOF) after oligomycin treatment (n = 2). (G) Glycolytic capacity of activated and resting T cells (n = 2 biological and 6 technical replicates). (H) ECAR of CD8+CD28 T cells treated with 50 µM RSV for 48 h (shown is the mean of biological replicates, n = 7). (I) Glycolytic capacity of RSV-treated CD8+CD28 T cells (n = 6, paired two-tailed Student’s t test). (J) Energy profile (OCR vs. ECAR) of RSV-treated CD8+CD28 T cells (shown is the mean of biological replicates, n = 7). (K) ECAR of CD8+CD28 T cells treated with nicotinamide riboside for 48 h (representative normalized to 100% baseline, n = 2). Data are mean ± SEM of individual donors. *, P < 0.05; ***, P < 0.001. AA/Rot, antimycin A/rotenone; mpH/min, milli-pH units per minute.
Figure 3.
Figure 3.
Altered FoxO1 gene expression in CD8+CD28 T cells. (A) Microarray analysis in CD8+CD28+ and CD28 T cells, predicting FoxO1 as an altered transcriptional regulator in CD8+CD28 T cells. (B) CCR7, CD62L, IL7R, and KLRG1 mRNA were assessed by qRT-PCR and normalized to RPL13A mRNA from sorted human T cell populations (n = 5, paired one-way ANOVA). (C) Peripheral blood mononuclear cells were stained for CD3, CD8, CD28, and indicated markers as in B and analyzed by flow cytometry (n = 5, paired one-way ANOVA). (D and E) FoxO1 expression in sorted human T cells was measured by Western blot (representative, n = 7, paired two-tailed Student’s t test). (F) FoxO1 mRNA was analyzed by qRT-PCR and normalized to RPL13A (n = 8). (G and H) CD28+ and CD28 T cells were treated with 20 µM MG132 for 6 h, and FoxO1 expression was measured by Western blot (n = 3, unpaired two-tailed Student’s t test, G shows CD28 T cells). (I and J) SIRT1 knockdown by Cas9–RNP nucleofection and Western blot for SIRT1 and FoxO1 expression (n = 9, two-way ANOVA). (K) Nucleofection of recombinant SIRT1 protein into CD8+ T cells and Western blot for SIRT1 and FoxO1 protein 18 h after nucleofection (representative, n = 2). (L) Densitometry of two independent experiments (n = 2). Data are mean ± SEM of individual donors. *, P < 0.05; **, P < 0.01; ***, P < 0.001; ****, P < 0.000. ns, not significant.
Figure 4.
Figure 4.
FoxO1 inhibition reprograms CD8+ T cell metabolism and induces cytotoxicity. Metabolism of sorted human CD8+ T cell populations was assessed using an extracellular flux analyzer. (A) Glycolytic capacity of sorted human T cell populations treated with 100 nM AS1842856 for 48 h (n = 5, paired two-tailed Student’s t test). (B) Energy profile (OCR vs. ECAR) of T cell subsets treated as in A (shown is the mean of biological replicates, n = 5). (C) Gene expression was measured by qRT-PCR, normalized to RPL13A mRNA, and relative to untreated human CD8+ T cells with increasing doses of AS1842856 for 48 h (n = 3, paired two-tailed Student’s t test). (D) Surface marker analysis by flow cytometry after 72 h of incubation with 100 nM AS1842856 (n = 5, two-way ANOVA). (E) Gene expression after CD8+ T cell treatment with 100 nM AS1842856 ± glucose for 48 h, measured by qRT-PCR, and normalized to RPL13A mRNA and to untreated cells (n = 5, paired two-tailed Student’s t test). Data are mean ± SEM of individual donors. *, P < 0.05; **, P < 0.01; ***, P < 0.001; mpH/min, milli-pH units per minute. (F) Model: a dynamic SIRT1–FoxO1 axis regulates metabolism and cytotoxicity in CD8+ T cells. This axis is lost in CD8+CD28 T cells, resulting in increased T cell glycolytic capacity and cytotoxicity.

References

    1. Amara R.R., Nigam P., Sharma S., Liu J., and Bostik V.. 2004. Long-lived poxvirus immunity, robust CD4 help, and better persistence of CD4 than CD8 T cells. J. Virol. 78:3811–3816. 10.1128/JVI.78.8.3811-3816.2004 - DOI - PMC - PubMed
    1. Azuma M., Phillips J.H., and Lanier L.L.. 1993. CD28- T lymphocytes. Antigenic and functional properties. J. Immunol. 150:1147–1159. - PubMed
    1. Beier U.H., Wang L., Bhatti T.R., Liu Y., Han R., Ge G., and Hancock W.W.. 2011. Sirtuin-1 targeting promotes Foxp3+ T-regulatory cell function and prolongs allograft survival. Mol. Cell. Biol. 31:1022–1029. 10.1128/MCB.01206-10 - DOI - PMC - PubMed
    1. Berdichevsky A., Viswanathan M., Horvitz H.R., and Guarente L.. 2006. C. elegans SIR-2.1 interacts with 14-3-3 proteins to activate DAF-16 and extend life span. Cell. 125:1165–1177. 10.1016/j.cell.2006.04.036 - DOI - PubMed
    1. Brunet A., Sweeney L.B., Sturgill J.F., Chua K.F., Greer P.L., Lin Y., Tran H., Ross S.E., Mostoslavsky R., Cohen H.Y., et al. 2004. Stress-dependent regulation of FOXO transcription factors by the SIRT1 deacetylase. Science. 303:2011–2015. 10.1126/science.1094637 - DOI - PubMed

Publication types

MeSH terms