

Thrombopoietin mutation in congenital amegakaryocytic thrombocytopenia treatable with romiplostim
- PMID: 29191945
- PMCID: PMC5760853
- DOI: 10.15252/emmm.201708168
Thrombopoietin mutation in congenital amegakaryocytic thrombocytopenia treatable with romiplostim
Abstract
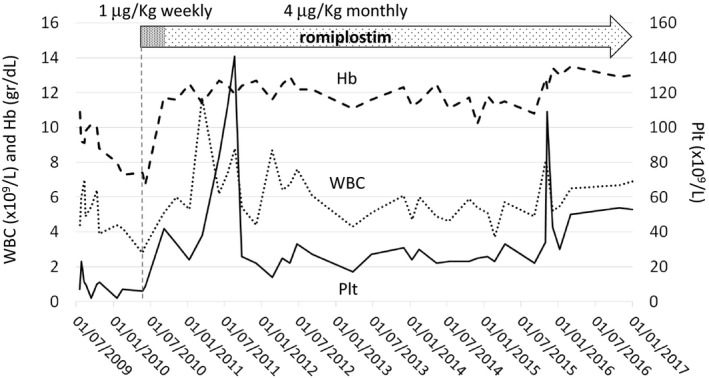
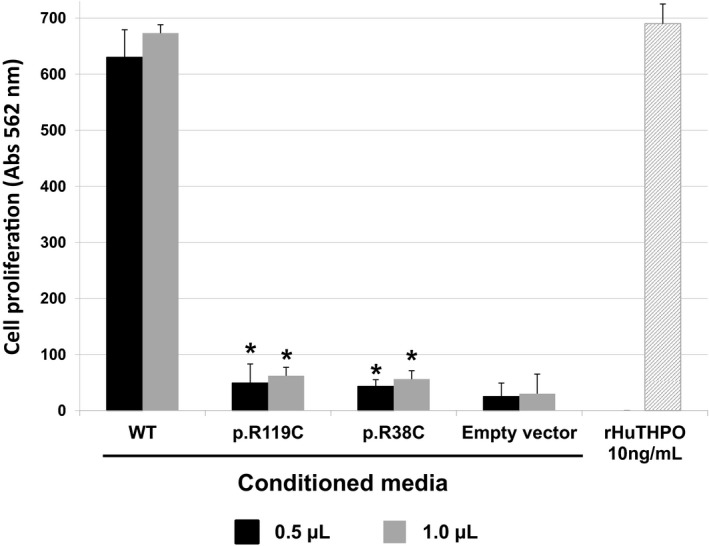
Congenital amegakaryocytic thrombocytopenia (CAMT) is an inherited disorder characterized at birth by thrombocytopenia with reduced megakaryocytes, which evolves into generalized bone marrow aplasia during childhood. Although CAMT is genetically heterogeneous, mutations of MPL, the gene encoding for the receptor of thrombopoietin (THPO), are the only known disease-causing alterations. We identified a family with three children affected with CAMT caused by a homozygous mutation (p.R119C) of the THPO gene. Functional studies showed that p.R119C affects not only ability of the cytokine to stimulate MPL but also its release, which is consistent with the relatively low serum THPO levels measured in patients. In all the three affected children, treatment with the THPO-mimetic romiplostim induced trilineage hematological responses, remission of bleeding and infections, and transfusion independence, which were maintained after up to 6.5 years of observation. Recognizing patients with THPO mutations among those with juvenile bone marrow failure is essential to provide them with appropriate substitutive therapy and prevent the use of invasive and unnecessary treatments, such as hematopoietic stem cell transplantation or immunosuppression.
Keywords: MPL; congenital amegakaryocytic thrombocytopenia; mutation; romiplostim; thrombopoietin.
© 2017 The Authors. Published under the terms of the CC BY 4.0 license.
Conflict of interest statement
The authors declare that they have no conflict of interest.
Figures
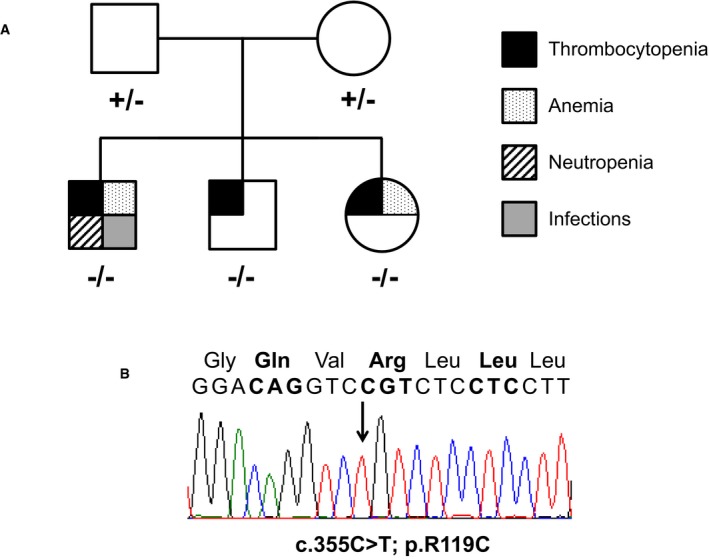
Family pedigree indicating the genotype and phenotype of the family members. “+” and “−” indicate the wild‐type and the mutant (c.355C>T; p.R119C) allele, respectively. Different symbols indicate the presence of severe thrombocytopenia, anemia, neutropenia, or infections, as shown in the figure.
Electropherogram showing the homozygous c.355C>T mutation in the proband.

Multiple‐sequence alignment analysis of THPO orthologs from different species. Hs, Homo sapiens (NP_000451.1); Bt, Bos taurus (NP_001159512.1); Oa, Ovis aries (XP_011984347.1); Cl, Canis lupus familiaris (XP_005639837.1); Fc, Felis catus (NP_001157128.1); Mm, Mus musculus (NP_033405.1); Rn, Rattus norvegicus (NP_112395.1). Residues in bold are conserved among both THPO and EPO orthologs. Residues in gray are not conserved within THPO or EPO.
Cartoon representation of the structure of the receptor binding domain of THPO (in sky blue) in complex with a neutralizing antibody fragment (in magenta) (PDB 1V7M) (Feese et al, 2004). The inset shows a zoom of the interaction involving R119 (in red) with the D31 of the antibody fragment (in green).
Multiple‐sequence alignment analysis of EPO orthologs from different species. Hs, Homo sapiens (NP_000790.2); Bt, Bos taurus (NP_776334.1); Oa, Ovis aries (NP_001019908.1); Cl, Canis lupus familiaris (NP_001006647.1); Fc, Felis catus (NP_001009269.1); Mm, Mus musculus (NP_031968.1); Rn, Rattus norvegicus (NP_058697.1). Residues in bold are conserved among both THPO and EPO orthologs. Residues in gray are not conserved within THPO or EPO.
Cartoon representation of the structure of the receptor binding domain of EPO (in violet) in complex with its receptor (in green) (PDB 1EER) (Syed et al, 1998). The inset shows a zoom of the cluster salt bridge interactions involving R103 (in red), the analogous of R119 in THPO.
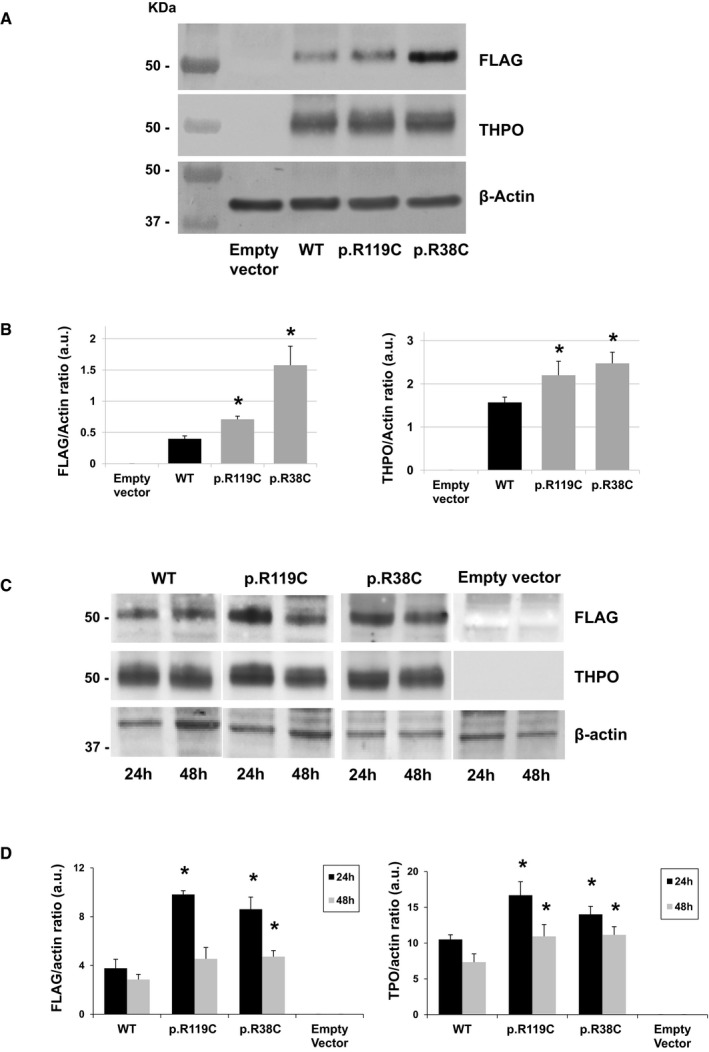
Representative images of immunoblotting of HEK293T cell lysates prepared 24 and 48 h after transfection with wild‐type (WT) or mutant (p.R119C and p.R38C) THPO‐expressing or empty vectors and then pooled into a ratio of 1:1 (Dasouki et al, 2013). THPO cDNAs were tagged with the FLAG epitope. β‐Actin was used as loading control.
Densitometric analysis of the bands obtained by immunoblotting of HEK293T cell lysates prepared 24 and 48 h after transfection and then pooled into a ratio of 1:1. Immunoblotting was performed on cells collected after n = 3 independent transfection experiments. THPO levels are expressed as FLAG/β‐actin ratio and THPO/β‐actin ratio.
Representative images of immunoblotting of HEK293T cell lysates prepared 24 and 48 h after transfection with wild‐type or mutant THPO‐expressing or empty vectors and then analyzed separately (24 and 48 h).
Densitometric analysis of the bands obtained by immunoblotting of HEK293T cell lysates prepared 24 and 48 h after transfection and then analyzed separately. Immunoblotting was performed on cells collected after n = 3 independent transfection experiments. Samples derive from the same experiment, and blots were processed in parallel.
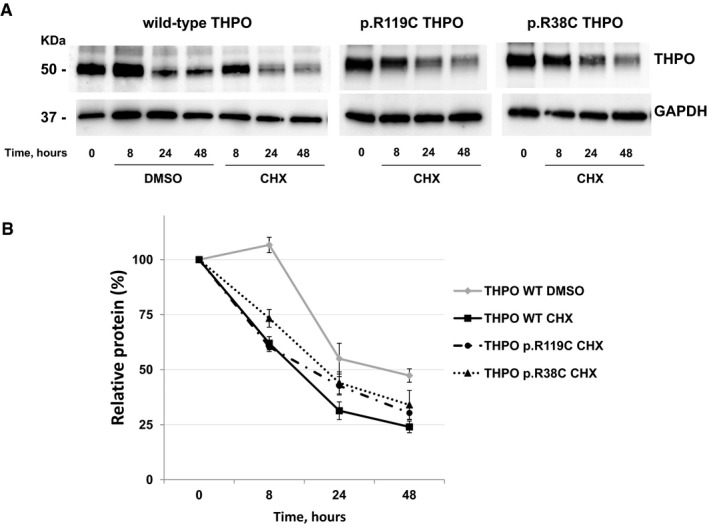
Representative images of immunoblotting of HEK293T cells transfected with wild‐type or mutant (p.R119C and p.R38C) THPO‐expressing vectors. Cell lysates were prepared just before treatment with cycloheximide (CHX) (time 0) and 8, 24, and 48 h after the addition of CHX in order to block de novo protein synthesis (CHX chase assay). DMSO alone was used as control in the WT sample. GAPDH was used as loading control.
Densitometric analysis of the bands obtained in n = 3 independent experiments. THPO amount was measured as THPO/GAPDH ratio and expressed as the percentage of the amount measured at time 0 in each condition (Relative protein, %). Of note, the expression of wild‐type THPO after CHX treatment was significantly lower compared with DMSO alone at each time point (P < 0.05, two‐tailed Student's t‐test), confirming that protein synthesis was efficiently blocked by CHX treatment. Data are presented as mean ± SD. The exact P‐values are reported in Appendix Table S3.
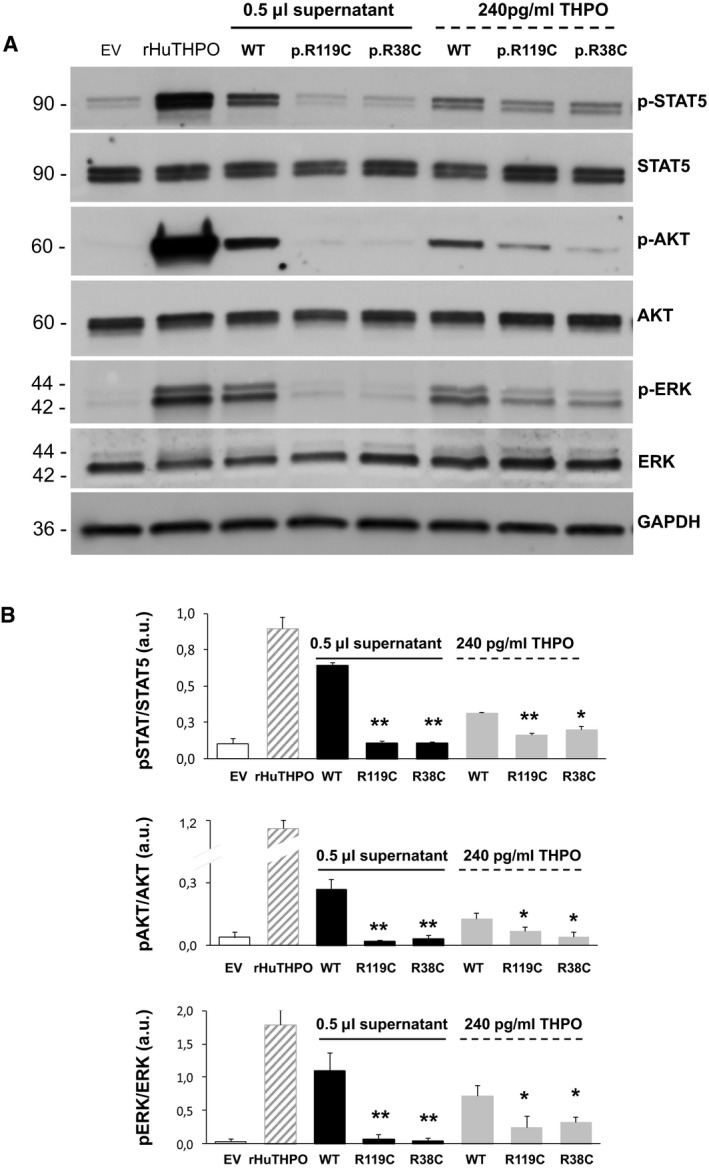
Representative images of immunoblotting of UT7‐TPO cells recapitulating conditions of the cell proliferation assays shown in Fig 3 (incubation with 0.5 μl of HEK293T wild‐type or mutant supernatants) and Fig 5 (incubation with 240 pg/ml of THPO from HEK293T wild‐type or mutant supernatants). The supernatant (0.5 μl) obtained after transfection of the empty vector (EV) was used as a negative control. Commercial recombinant human THPO (rHuTHPO) at 10 ng/ml was used as the positive control condition. The analysis investigated the phosphorylated forms of STAT5, ERK, and AKT (p‐STAT5, p‐ERK, and p‐AKT) and the total form of the three kinases (STAT5, ERK, and AKT). GAPDH was used as loading control.
Densitometric analysis of the bands obtained in n = 3 independent experiments. Protein phosphorylation was expressed as the ratio between the phosphorylated and the total forms of each protein. Data are presented as means ± SD. The asterisk (*) indicates a P‐value < 0.05, while (**) indicates a P‐value < 0.01 with respect to WT (two‐tailed Student's t‐test). The exact P‐values are reported in Appendix Table S5.
Comment in
-
Thrombopoietin: tickling the HSC's fancy.EMBO Mol Med. 2018 Jan;10(1):10-12. doi: 10.15252/emmm.201708450. EMBO Mol Med. 2018. PMID: 29191946 Free PMC article.
References
-
- Ballmaier M, Germeshausen M, Schulze H, Cherkaoui K, Lang S, Gaudig A, Krukemeier S, Eilers M, Strauss G, Welte K (2001) c‐mpl mutations are the cause of congenital amegakaryocytic thrombocytopenia. Blood 97: 139–146 - PubMed
-
- Ballmaier M, Germeshausen M, Krukemeier S, Welte K (2003) Thrombopoietin is essential for the maintenance of normal hematopoiesis in humans: development of aplastic anemia in patients with congenital amegakaryocytic thrombocytopenia. Ann N Y Acad Sci 996: 17–25 - PubMed
-
- Ballmaier M, Germeshausen M (2009) Advances in the understanding of congenital amegakaryocytic thrombocytopenia. Br J Haematol 146: 3–16 - PubMed
-
- Ballmaier M, Germeshausen M (2011) Congenital amegakaryocytic thrombocytopenia: clinical presentation, diagnosis, and treatment. Semin Thromb Hemost 37: 673–681 - PubMed
Publication types
MeSH terms
Substances
Supplementary concepts
LinkOut - more resources
Full Text Sources
Other Literature Sources
Molecular Biology Databases
