. 2018 Jan 8;131(1):jcs212159.
doi: 10.1242/jcs.212159.

NudE regulates dynein at kinetochores but is dispensable for other dynein functions in the C. elegans early embryo

Affiliations

NudE regulates dynein at kinetochores but is dispensable for other dynein functions in the C. elegans early embryo

Patrícia A Simões et al. J Cell Sci. .

Abstract

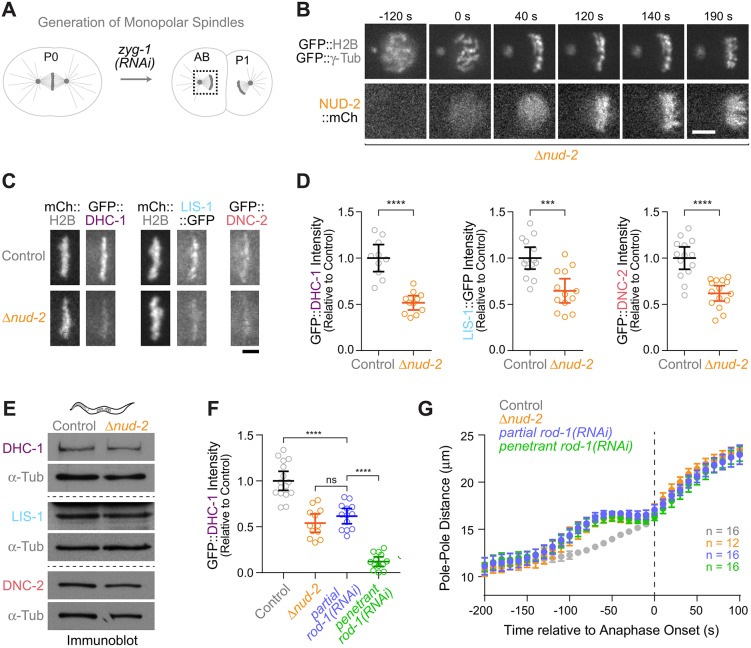
In mitosis, the molecular motor dynein is recruited to kinetochores by the Rod-Zw10-Zwilch complex (RZZ) and Spindly to control spindle assembly checkpoint (SAC) signaling and microtubule attachment. How the ubiquitous dynein co-factors Lis1 and NudE contribute to these functions remains poorly understood. Here, we show that the C. elegans NudE homolog NUD-2 is dispensable for dynein- and LIS-1-dependent mitotic spindle assembly in the zygote. This facilitates functional characterization of kinetochore-localized NUD-2, which is recruited by the CENP-F-like proteins HCP-1 and HCP-2 independently of RZZ-Spindly and dynein-LIS-1. Kinetochore dynein levels are reduced in Δnud-2 embryos, and, as occurs upon RZZ inhibition, loss of NUD-2 delays the formation of load-bearing kinetochore-microtubule attachments and causes chromatin bridges in anaphase. Survival of Δnud-2 embryos requires a functional SAC, and kinetochores without NUD-2 recruit an excess of SAC proteins. Consistent with this, SAC signaling in early Δnud-2 embryos extends mitotic duration and prevents high rates of chromosome mis-segregation. Our results reveal that both NUD-2 and RZZ-Spindly are essential for dynein function at kinetochores, and that the gain in SAC strength during early embryonic development is relevant under conditions that mildly perturb mitosis.

Keywords: Dynein; Kinetochore; Lis1; NDE1; NudE; PAFAH1B1; RZZ; Spindle assembly checkpoint.


Conflict of interest statement

Competing interestsThe authors declare no competing or financial interests.

Figures

Fig. 1.
Fig. 1.
NUD-2 is dispensable for positioning centrosomes and pronuclei in the C. elegans one-cell embryo but reinforces dynein function when LIS-1 levels are reduced. (A) Schematic summarizing general roles for the dynein co-factors NudE/L and Lis1: regulation of motor activity and recruitment to cargo. (B) Schematic of the null allele nud-2(ok949), referred to as Δnud-2, and the nud-2 transgene used in this study. (C) Graph showing modest embryonic lethality in Δnud-2, which is rescued by transgene-encoded NUD-2::mCherry. n indicates the number of hermaphrodite mothers whose progeny was counted (>250 total progeny per condition). ***P<0.001; ns, not significant, P>0.05 (one-way ANOVA followed by Bonferroni's multiple comparison test). (D) Stills from a time-lapse sequence in the one-cell embryo showing enrichment of NUD-2::mCherry in pronuclei just prior to NEBD (arrow) and on the mitotic spindle in metaphase. A slight enrichment at kinetochores is also visible at metaphase. Scale bar: 10 µm. (E) Top: cartoons highlighting the role of dynein in the positioning of centrosomes and pronuclei, spindle assembly and chromosome congression during the first embryonic division. Black arrows indicate dynein-dependent movement. Bottom: stills from time-lapse sequences showing normal mitotic spindle assembly and positioning in a Δnud-2 embryo. By contrast, depletion of LIS-1 (a binding partner of NUD-2) results in failure of centrosome separation and pronuclear migration. Scale bar: 10 µm. (F) Graph showing normal migration kinetics of the male pronucleus in Δnud-2 embryos and failure of pronuclear migration after lis-1(RNAi). The position of the pronucleus along the anterior-posterior axis (see cartoon) was determined in images captured every 10 s. Individual traces were normalized to embryo length, averaged for the indicated number n of embryos, and plotted against time. (G) Graph showing the normal kinetics of centrosome positioning along the anterior-posterior axis in Δnud-2 embryos, plotted as described for F. Solid lines indicate the midpoint between the two centrosomes (spindle position). Anaphase begins at 200 s. (H) Angle between the centrosome–centrosome axis and the anterior–posterior (A-P) axis in one-cell embryos at NEBD and anaphase onset. Circles correspond to measurements in individual embryos. ***P<0.001; ns, not significant, P>0.05 (t-test). (I) Embryonic lethality assay demonstrating that Δnud-2 embryos are sensitive to a reduction in LIS-1 levels. (J) Stills from time-lapse sequences in the one-cell embryo showing additive defects in pronuclear migration when LIS-1 is partially depleted in Δnud-2 embryos. The number of embryos in which the two pronuclei in the posterior half were joined at 100 s prior to NEBD/total number of embryos examined is indicated below the stills. Yellow arrows highlight joined pronuclei and magenta arrows separate pronuclei. Scale bar: 10 µm. The dotted line in D, E and J indicates the periphery of the one-cell embryo. All error bars represent the 95% c.i.
Fig. 2.
Fig. 2.
NUD-2 loss and RZZ inhibition cause identical delays in the formation of load-bearing kinetochore-microtubule attachments. (A) Assays for kinetochore function in the one-cell embryo. The distance between spindle poles serves as a readout for the ability of kinetochores to form load-bearing attachments to microtubules. (B) Stills from time-lapse sequences in one-cell embryos expressing GFP::histone H2B, showing that loss of NUD-2 results in lagging anaphase chromatin (arrows), similar to what is observed upon depletion of the RZZ subunit ROD-1. The number of embryos in which lagging anaphase chromatin was observed/total number of embryos examined is indicated below the stills. Scale bar: 5 µm. (C–G) Plots of spindle pole separation kinetics in one-cell embryos expressing GFP::γ-tubulin, showing that loss of NUD-2 and ROD-1 depletion results in identical defects. Pole–pole distances were measured in images acquired every 10 s, averaged for the indicated number n of embryos, and plotted against time. Error bars represent the 95% c.i.
Fig. 3.
Fig. 3.
Kinetochores are sensitive to reduced dynein levels. (A) Strategy for the generation of monopolar spindles in the second embryonic division. ZYG-1 kinase is required for centriole duplication. In zyg-1(RNAi) embryos, the first division is normal, because two intact centrioles are contributed by sperm that is not affected by RNAi. Centrioles are unable to duplicate, resulting in a monopolar spindle in the subsequent division. (B) Stills from a time-lapse sequence in a monopolar AB cell, showing that NUD-2::mCherry is enriched at kinetochores. Scale bar: 5 µm. (C) Stills from time-lapse sequences in monopolar AB cells, showing that loss of NUD-2 decreases kinetochore levels of GFP::DHC-1, LIS-1::GFP, and GFP::DNC-2. Scale bar: 2.5 µm. (D) Quantification of GFP levels on monopolar chromosomes as shown in C, as determined by fluorescence intensity measurements. Circles correspond to measurements in individual embryos. ***P<0.001; ****P<0.0001 (t-test). (E) Immunoblots of adult animals, showing that loss of NUD-2 does not decrease total protein levels of DHC-1, LIS-1 or DNC-2. α-Tubulin was used as a loading control. (F) Quantification of GFP::DHC-1 levels on monopolar chromosomes, showing that the reduction in dynein levels after NUD-2 loss can be recapitulated by partial ROD-1 depletion. Circles correspond to measurements in individual embryos. ****P<0.0001; ns, not significant, P>0.05 (one-way ANOVA followed by Bonferroni's multiple comparison test). (G) Plots of spindle pole separation kinetics in one-cell embryos expressing GFP::γ-tubulin, displayed as described in Fig. 2C–G. RNAi conditions were identical to those used for the intensity measurements in F. All error bars represent the 95% c.i.
Fig. 4.
Fig. 4.
Embryos without NUD-2 require the SAC for survival and hyper-accumulate SAC components at kinetochores. (A) Embryonic viability assay demonstrating that NUD-2 loss is lethal when combined with depletion of SAC components. n indicates the number of hermaphrodite mothers whose progeny was counted (>250 total progeny per condition). (B–D) Left: stills from time-lapse sequences in the metaphase one-cell embryo showing that NUD-2 loss results in increased kinetochore levels of mCherry::ROD-1 (B), GFP::SPDL-1 (C) and GFP::MAD-1 (D). Right: quantification of mCherry/GFP levels on chromosomes as shown on the left as determined using fluorescence intensity measurements. Circles correspond to measurements in individual embryos. Error bars in A–D represent the 95% c.i. *P<0.05; ****P<0.0001 (t-test). (E,F) Quantification of the mCherry::ROD-1 (E) and GFP::SPDL-1 (F) signal on mitotic chromosomes over time in one-cell embryos. Fluorescence intensities were measured in images acquired every 10 s, averaged for the indicated number n of embryos, and plotted against time. Values are plotted mean±95% c.i., normalized to the maximum signal in controls.
Fig. 5.
Fig. 5.
SAC signaling in early multicellular Δnud-2 embryos reduces the rate of chromosome mis-segregation. (A) Interval between NEBD and anaphase onset (AO) in one-cell embryos, showing that loss of NUD-2 has no effect on mitotic timing. n indicates the number of embryos. ns, not significant, P>0.05 (one-way ANOVA followed by Bonferroni's multiple comparison test). (B) Frequency of anaphases with lagging chromatin in one-cell embryos, showing that SAC inhibition in Δnud-2 embryos has no additive effect on the chromosome segregation fidelity. (C) Mitotic timing in Δnud-2 embryos increases at the 16- to 32-cell stage in an SAC-dependent manner. The total number of cells (n) scored in at least eight different embryos is indicated. ****P<0.0001; ns, not significant, P>0.05 (one-way ANOVA followed by Bonferroni's multiple comparison test). (D) Frequency of anaphases with lagging chromatin at the 16- to 32-cell stage, showing increased rates of chromosome mis-segregation after SAC inhibition in Δnud-2 embryos. The total number of cells (n) scored in at least eight different embryos is indicated. (E) Stills from time-lapse sequences in embryos (dotted line) at the 32-cell stage showing lagging anaphase chromatin in Δnud-2 embryos after SAC inhibition. Scale bar, 10 µm; inset, 5 µm. All error bars represent the 95% c.i.
Fig. 6.
Fig. 6.
HCP-1 and HCP-2 recruit NUD-2 to kinetochores and the spindle independently of dynein–LIS-1 and RZZ–SPDL-1. (A) Yeast two-hybrid experiments showing that nud-2 interacts with itself and with the paralogs hcp-1 and hcp-2. Cells containing bait and prey plasmids grow on −Leu/−Trp plates (Ctr), while −Leu/−Trp/−His plates select for the interaction between bait and prey (Sel). (B) Stills from time-lapse sequences in monopolar AB cells (generated as described in Fig. 3A), showing that co-depletion of HCP-1 and HCP-2 [hcp-1/2(RNAi)] abolishes NUD-2::mCherry recruitment to kinetochores and the spindle. Scale bar: 5 µm. (C) Line scans across mitotic chromosomes in monopolar AB cells, showing that NUD-2::mCherry and GFP::HCP-1 are enriched on both the pole-proximal and pole-distal side, whereas GFP::DHC-1 and LIS-1::GFP accumulate exclusively on the pole-distal side. The graphs are representative of at least five monopolar spindles examined per condition. (D) Stills from time-lapse imaging sequences in one-cell embryos showing that NUD-2::mCherry localization requires HCP-1 and HCP-2 but not CLS-2. Scale bar: 10 µm. (E) Stills as in D showing that NUD-2::mCherry localizes independently of DYCI-1, LIS-1, ROD-1 and SPDL-1. Scale bar: 10 µm. (F) Summary of localization dependencies (arrows) in the two kinetochore pathways that recruit dynein for accurate chromosome segregation. The dotted line in D,E indicates the outline of the one-cell embryo.

Similar articles

Cited by

References

    1. Alexander S. P. and Rieder C. L. (1991). Chromosome motion during attachment to the vertebrate spindle: initial saltatory-like behavior of chromosomes and quantitative analysis of force production by nascent kinetochore fibers. J. Cell Biol. 113, 805-815. 10.1083/jcb.113.4.805 - DOI - PMC - PubMed
    1. Barbosa D. J., Duro J., Prevo B., Cheerambathur D. K., Carvalho A. X. and Gassmann R. (2017). Dynactin binding to tyrosinated microtubules promotes centrosome centration in C. elegans by enhancing dynein-mediated organelle transport. PLoS Genet. 13, e1006941 10.1371/journal.pgen.1006941 - DOI - PMC - PubMed
    1. Barisic M., Sohm B., Mikolcevic P., Wandke C., Rauch V., Ringer T., Hess M., Bonn G. and Geley S. (2010). Spindly/CCDC99 is required for efficient chromosome congression and mitotic checkpoint regulation. Mol. Biol. Cell 21, 1968-1981. 10.1091/mbc.E09-04-0356 - DOI - PMC - PubMed
    1. Baumbach J., Murthy A., McClintock M. A., Dix C. I., Zalyte R., Hoang H. T. and Bullock S. L. (2017). Lissencephaly-1 is a context-dependent regulator of the human dynein complex. eLife 6, e21768 10.7554/eLife.21768 - DOI - PMC - PubMed
    1. Buffin E., Lefebvre C., Huang J., Gagou M. E. and Karess R. E. (2005). Recruitment of Mad2 to the kinetochore requires the Rod/Zw10 complex. Curr. Biol. 15, 856-861. 10.1016/j.cub.2005.03.052 - DOI - PubMed

Publication types

MeSH terms