. 2017 Dec 1;8(1):1884.
doi: 10.1038/s41467-017-02085-z.

Fine control of metal concentrations is necessary for cells to discern zinc from cobalt

Affiliations

Fine control of metal concentrations is necessary for cells to discern zinc from cobalt

Deenah Osman et al. Nat Commun. .

Abstract

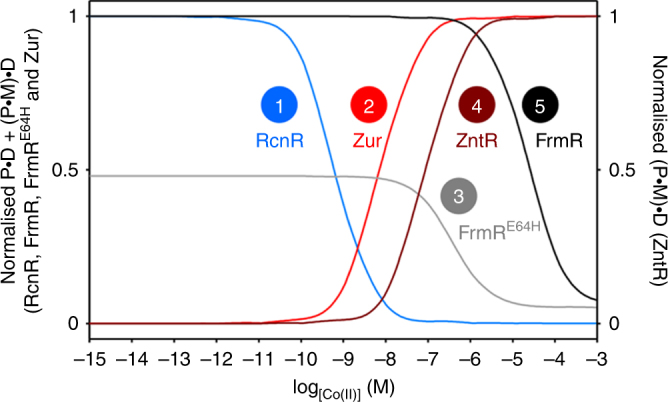
Bacteria possess transcription factors whose DNA-binding activity is altered upon binding to specific metals, but metal binding is not specific in vitro. Here we show that tight regulation of buffered intracellular metal concentrations is a prerequisite for metal specificity of Zur, ZntR, RcnR and FrmR in Salmonella Typhimurium. In cells, at non-inhibitory elevated concentrations, Zur and ZntR, only respond to Zn(II), RcnR to cobalt and FrmR to formaldehyde. However, in vitro all these sensors bind non-cognate metals, which alters DNA binding. We model the responses of these sensors to intracellular-buffered concentrations of Co(II) and Zn(II) based upon determined abundances, metal affinities and DNA affinities of each apo- and metalated sensor. The cognate sensors are modelled to respond at the lowest concentrations of their cognate metal, explaining specificity. However, other sensors are modelled to respond at concentrations only slightly higher, and cobalt or Zn(II) shock triggers mal-responses that match these predictions. Thus, perfect metal specificity is fine-tuned to a narrow range of buffered intracellular metal concentrations.


Conflict of interest statement

This work was supported by Biotechnology and Biological Research Council awards BB/J017787/1 and BB/L009226/1 to N.J.R. in conjunction with a financial contribution by Procter and Gamble (in association with BB/J017787/1 Industrial Partnership Award). The remaining authors declare no competing financial interests.

Figures

Fig. 1
Fig. 1
Zn(II), Co(II) and related formaldehyde sensors of Salmonella. Allosteric mechanisms of Salmonella sensors and structural models based on Protein Data Bank files 4MTD for Zur (a), 4WLW for ZntR (b), 5LCY for both RcnR (c) and FrmRE64H (d) with identified DNA-binding sites (bold), upstream of target genes. The DNA sequences shown were used for fluorescence anisotropy and orange bars indicate the region amplified by end point PCR and quantitative PCR. Known or inferred ligands for effector binding are enlarged: Zur contains a Cys4-structural site and at least one sensory site. The dinuclear Zn(II) site of E. coli ZntR (PDB: 1Q08) is shown, noting that solution studies of Salmonella ZntR indicate a mononuclear site, . An RcnR Co(II) site has been proposed, which may also include Glu32 . FrmRE64H and FrmR have overlapping sites for formaldehyde (Cys35, Pro2) and metal binding (Cys35, His60 and either His64 for FrmRE64H or Glu64 for FrmR). Cognate effectors are depicted
Fig. 2
Fig. 2
Each sensor responded specifically to one effector. Representative (n = 3) transcript abundance of znuA (regulated by Zur) (a), zntA (regulated by ZntR) (b), rcnA (regulated by RcnR) (c) and frm (regulated by FrmR or FrmRE64H) (df), following growth of Salmonella in minimal media without supplementation (−) or with 0.25 μM cobalt (Co), 50 μM Zn(II) (Zn) or 50 μM formaldehyde (F; ~10% growth inhibition observed with each supplementation). Both end point PCR (upper) and qPCR (lower, error bars are s.d.) are shown. Quantitative data for regulation by FrmR and FrmRE64H is relative to the control without supplementation (−) in d. Data for control genes are presented in Supplementary Fig. 3 and full gel images in Supplementary Figs. 4 and 5
Fig. 3
Fig. 3
Cobalt shock triggers other sensors. a Representative (n = 3) transcript abundance following 10 min exposure of Salmonella to increasing [cobalt] assayed by end point PCR. Arrows identify the lowest exogenous [cobalt] at which each sensor appears to respond. Data for control genes are presented in Supplementary Fig. 8 and full gel images in Supplementary Fig. 9. b Transcript abundance for the samples shown in a measured by qPCR (error bars are s.d.). Arrows represent a ≥twofold change in transcript abundance. Heat maps of qPCR data from three biological replicates are presented in Supplementary Fig. 10
Fig. 4
Fig. 4
Co(II) affinities of ZntR and Zur. a Representative (n = 3) fura-2 fluorescence emission (λ ex = 360 nm) upon titration of fura-2 (15.4 μM) and ZntR (9.8 μM) with Co(II). Solid line is a fit to a model describing competition from ZntR for one molar equivalent of Co(II). Dashed lines are simulated curves with K Co(II) tenfold tighter and tenfold weaker than the fitted value. b As in a but with fura-2 (14.6 μM) and Zur (9.8 μM) (n = 5). c Representative (n = 3) Zur absorbance spectra upon titration of Zur (52 μM) and EGTA (50 μM) with Co(II). d Binding isotherm at 350 nm for data shown in c. Solid line is a fit to a model describing competition from Zur for two molar equivalents of Co(II). Dashed lines are simulated curves with K Co(II) tenfold tighter and tenfold weaker than the fitted value
Fig. 5
Fig. 5
DNA affinities of Zur, Co(II)-FrmRE64H and ZntR. a Anisotropy change upon titration of 1 μM znuAPro with Zn(II)-Zur in the presence of 1 μM Zn(II). b As a but with 10 nM znuAPro and Zn(II)-Zur in the presence of 1 μM Zn(II) (orange symbols, n = 3), or apo-Zur with 5 mM EDTA (black symbols, n = 3). Symbol shapes represent individual experiments. Data were fit to a model describing a 2:1 Zur dimer (non-dissociable):DNA stoichiometry and lines are simulated curves using the mean DNA affinity across the experiments shown. c As b but with Co(II)-Zur and 1 μM Co(II) (n = 3). d Anisotropy change upon titration of frmRAPro (10 nM) with apo-FrmRE64H in 5 mM EDTA (black symbols, n = 3) or Co(II)-FrmRE64H in 100 μM Co(II) (blue symbols, n = 3). Co(II)-FrmRE64H data were fit to a model describing a 2:1 FrmRE64H tetramer (non-dissociable):DNA stoichiometry and solid line is a simulated curve using the mean DNA affinity across the experiments shown, . Dashed grey line is a simulated curve using the published DNA affinity for apo-FrmRE64H 7. e As a but with apo-ZntR and 2.5 μM zntAPro in 5 mM EDTA. Line is a linear fit to the first three data points predicting Δr obs = 0.0246 at 2:1 ZntR:zntAPro. f As b but with apo-ZntR and 10 nM zntAPro (n = 7). g As f but with Zn(II)-ZntR (n = 3). h As f but with Co(II)-ZntR in 5 μM Co(II) (n = 4). Data in f, g and h were fit to a model describing 1:1 ZntR dimer (non-dissociable):DNA and lines are simulated curves using the mean DNA affinity across the experiments shown. For g and h, to determine the DNA affinity of the tightest binding event, data to 1500 nM ZntR monomer were used
Fig. 6
Fig. 6
Thermodynamic coupling of metal and DNA binding. Four allosteric conformations (end-states) typical of metal sensor proteins: apo-protein (P), metal-protein (P•M), apo-protein-DNA (P•D) or metal-protein-DNA ((P•M)•D). Dynafit was used to simultaneously model these coupled equilibria to determine the fractional occupancy of each operator–promoter with sensor ((P•D + (P•M)•D)/Dtotal), as a function of buffered metal concentration (Mb) (see 'Methods' section, Supplementary Data 1 and Supplementary Software). K 1K 5 are association constants. Buffered metal was achieved by including a hypothetical buffer component (B) with defined metal affinity (1/K 5)
Fig. 7
Fig. 7
Calculated responses to intracellular Co(II). Calculated fractional occupancy ((P•D + (P•M)•D)/Dtotal) of DNA targets with RcnR (blue line), Zur (red line), FrmRE64H (grey line) or FrmR (black line), or of (P•M)•D/Dtotal (dark red line) for Co(II)-ZntR, as a function of buffered [Co(II)], determined using Co(II) affinities, DNA affinities and abundance values in Table 1. FrmR and FrmRE64H were normalised to the same scale. De-repression by RcnR, FrmR and FrmRE64H occurs as the fractional occupancy of their promoters decrease, co-repression by Zur occurs as occupancy of its promoter increases, and activation by ZntR occurs as the fractional occupancy of its promoter with metalated ZntR increases. Numbering reflects the order of response observed for each sensor in Fig. 3
Fig. 8
Fig. 8
Zn(II) affinity of RcnR and effects of Zn(II) on DNA binding. a Representative (n = 4) magfura-2 absorbance at 325 nm upon titration of magfura-2 (22.6 μM) and RcnR (16.9 μM) with Zn(II). Solid black line is a fit to a model describing competition from RcnR for one molar equivalent of Zn(II). Solid red lines are simulated curves with K Zn(II) tenfold tighter (not visible) and tenfold weaker than the fitted value. Dashed line is a simulated curve with K Zn(II) 100-fold weaker. b Representative (n = 4) quin-2 absorbance at 265 nm upon titration of quin-2 (18.0 μM) and RcnR (14.9 μM) with Zn(II). Solid line is a fit to a model describing competition from RcnR for one molar equivalent of Zn(II). Dashed lines are simulated curves with K Zn(II) tenfold tighter and tenfold weaker than the fitted value. c Anisotropy change upon titration of rcnAPro (10 nM) with apo-RcnR in the presence of 5 mM EDTA (black symbols, n = 3), or Zn(II)-RcnR (orange symbols, n = 3). Symbol shapes represent individual experiments. Data for Zn(II)-RcnR were fit to a model describing a 2:1 RcnR tetramer (non-dissociable):DNA stoichiometry and solid line is a simulated curve using the mean DNA affinity across the experiments shown. Dashed grey line is a simulated curve describing the published apo-RcnR DNA affinity for comparison. d Anisotropy change upon titration of znuAPro (10 nM) with Zn(II)2-Zur (orange symbols, n = 5). Symbol shapes represent individual experiments. Data were fit to a model describing a 2:1 Zur dimer (non-dissociable):DNA stoichiometry and lines are simulated curves using the mean DNA affinity across the experiments shown
Fig. 9
Fig. 9
Predicted and observed responses to Zn(II). a Calculated fractional occupancy ((P•D + (P•M)•D)/Dtotal) of DNA targets with RcnR (blue line), Zur (red line), FrmRE64H (grey line) or FrmR (black line), or of (P•M)•D/Dtotal (dark red line) for Zn(II)-ZntR, as a function of buffered [Zn(II)], determined using Zn(II) affinities, DNA affinities and abundance values in Table 1. Numbering reflects the order of response visualised for each sensor in Fig. 9b, c. b Representative (n = 3) transcript abundance following 10 min exposure of Salmonella to increasing [Zn(II)] assayed by end point PCR. Arrows identify the lowest observed exogenous [Zn(II)] at which each sensor appeared to respond. Data for control genes are presented in Supplementary Fig. 15 and full gel images in Supplementary Fig. 16. c Transcript abundance for the samples shown in b measured by qPCR (error bars are s.d.). Arrows represent a ≥twofold change in transcript abundance. Heat maps of qPCR data from three biological replicates are presented in Supplementary Fig. 17

References

    1. Guerra AJ, Giedroc DP. Metal site occupancy and allosteric switching in bacterial metal sensor proteins. Arch. Biochem. Biophys. 2012;519:210–222. doi: 10.1016/j.abb.2011.11.021. - DOI - PMC - PubMed
    1. Gilston BA, et al. Structural and mechanistic basis of zinc regulation across the E. coli Zur regulon. PLoS Biol. 2014;12:e1001987. doi: 10.1371/journal.pbio.1001987. - DOI - PMC - PubMed
    1. Gaballa A, Helmann JD. Identification of a zinc-specific metalloregulatory protein, Zur, controlling zinc transport operons in Bacillus subtilis. J. Bacteriol. 1998;180:5815–5821. - PMC - PubMed
    1. Outten CE, Outten FW, O’Halloran TV. DNA distortion mechanism for transcriptional activation by ZntR, a Zn(II)-responsive MerR homologue in Escherichia coli. J. Biol. Chem. 1999;274:37517–37524. doi: 10.1074/jbc.274.53.37517. - DOI - PubMed
    1. Changela A, et al. Molecular basis of metal-ion selectivity and zeptomolar sensitivity by CueR. Science. 2003;301:1383–1387. doi: 10.1126/science.1085950. - DOI - PubMed

Publication types

MeSH terms