. 2017 Nov 30;7(1):16687.
doi: 10.1038/s41598-017-16774-8.

Monkeys share the neurophysiological basis for encoding sound periodicities captured by the frequency-following response with humans

Affiliations

Monkeys share the neurophysiological basis for encoding sound periodicities captured by the frequency-following response with humans

Yaneri A Ayala et al. Sci Rep. .

Abstract

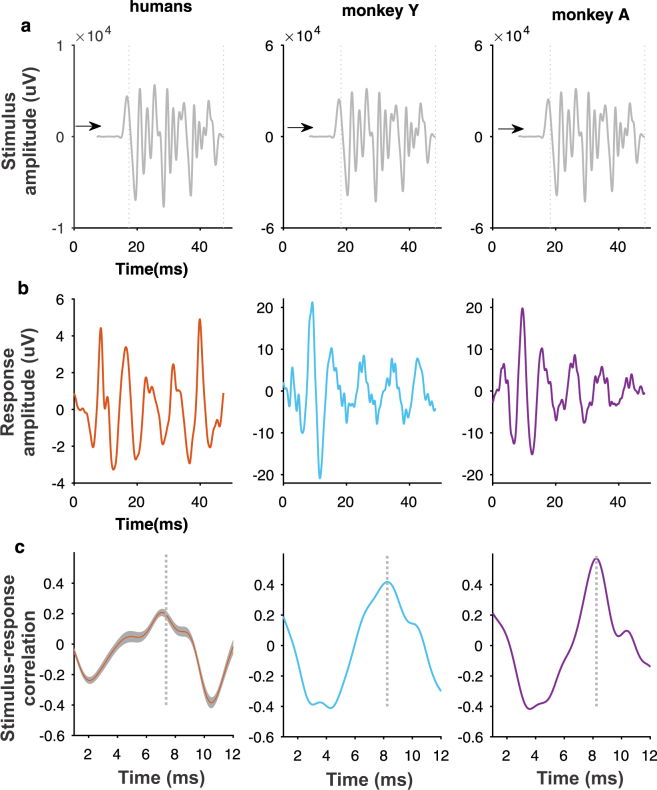
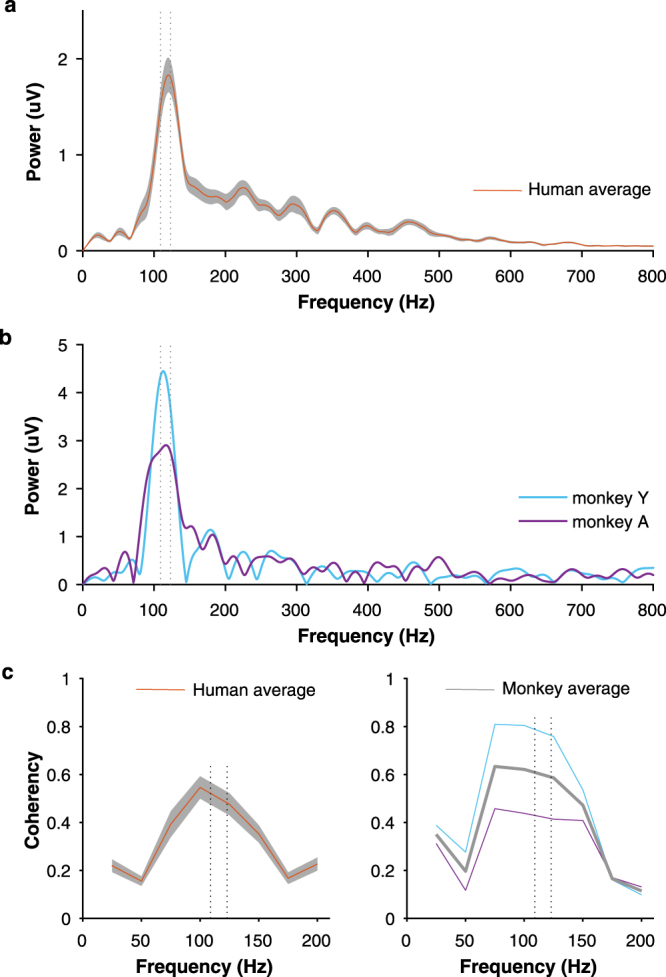
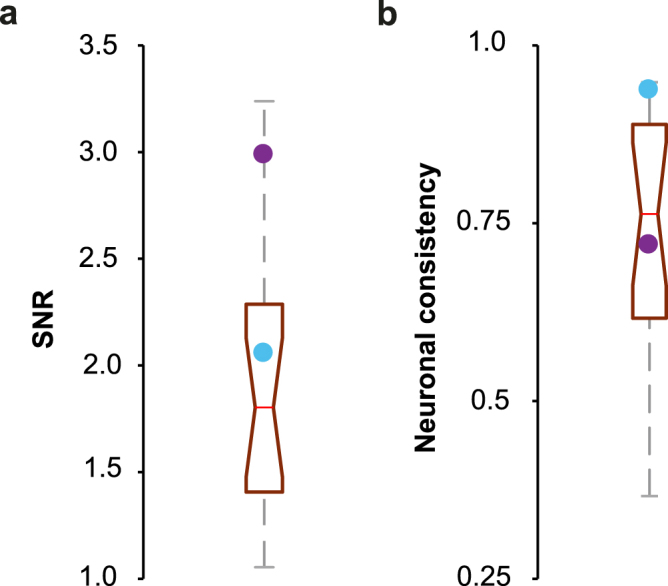
The extraction and encoding of acoustical temporal regularities are fundamental for human cognitive auditory abilities such as speech or beat entrainment. Because the comparison of the neural sensitivity to temporal regularities between human and animals is fundamental to relate non-invasive measures of auditory processing to their neuronal basis, here we compared the neural representation of auditory periodicities between human and non-human primates by measuring scalp-recorded frequency-following response (FFR). We found that rhesus monkeys can resolve the spectrotemporal structure of periodic stimuli to a similar extent as humans by exhibiting a homologous FFR potential to the speech syllable /da/. The FFR in both species is robust and phase-locked to the fundamental frequency of the sound, reflecting an effective neural processing of the fast-periodic information of subsyllabic cues. Our results thus reveal a conserved neural ability to track acoustical regularities within the primate order. These findings open the possibility to study the neurophysiology of complex sound temporal processing in the macaque subcortical and cortical areas, as well as the associated experience-dependent plasticity across the auditory pathway in behaving monkeys.


Conflict of interest statement

The authors declare that they have no competing interests.

Figures

Figure 1
Figure 1
Human and macaque FFR to speech syllable /da/ in the time domain. (a) FFR of a representative human case. (b) Grand average FFR of the human population is shown as the mean ± SEM (shaded area). (c) FFR in two macaques, Y and A. Onset and sustained response peaks are numbered from 1–7. Peaks corresponding to the sustained part of the FFR are in bold. Note the ‘not reliable’ peak in gray in monkey A.
Figure 2
Figure 2
Stimulus-response correlation. (a) Low-pass filtered version of the stimulus /da/ syllable. Stimulus onset is shifted in time (arrow) to account for the time lag resulting in maximal correlation between signals with the aim of maximizing the visual coherence between stimulus and response waveforms. The dotted lines delimitate the sustained part of the stimulus (10–40 ms). (b) FFR waveform of human subjects (grand average) and macaques (individual averages). (c) Correlation coefficients between stimulus and response as a function of the time shift between them. The maximal correlation is reached at time displacement of 7–8 ms indicated by the dotted line.
Figure 3
Figure 3
Spectral amplitude of the FFR. (a) Average frequency spectra of the FFR from the human population. (b) Frequency spectra of the individual FFR of each macaque. (c) Coherency index between the FFR segment and /da/ stimulus for human subjects (left) and monkeys (right). The mean ± SEM of frequency spectrum and coherency are shown for human data. The gray line shows the coherency average of the two macaque values. Dotted lines illustrate the F0 of the stimulus (103–121 Hz).
Figure 4
Figure 4
Intrinsic measures of the FFR. (a) Signal-to-noise ratio (SNR) between the FFR segment (20–60 ms) and baseline period (−10 ms) estimated by root-mean-square values. Data is shown as a box plot for the human data and as discrete values for monkeys (blue: monkey Y; purple, monkey A). The red line within each box represents the median values, the edges of the box delimit the 25th and 75th percentiles and the whiskers indicate the 10th and 90th percentiles. (b) Neural consistency index estimated by correlating the response waveforms resulting from averaging the odd and even epochs.
Figure 5
Figure 5
Human and monkey FFR potential. Average FFR across human subjects (n = 18) and monkeys (n = 2) recorded in the head vertex. The overall morphology of both primate responses exhibited three sustained peaks labeled as 4–6 reflecting the phase-locked activity of large neural ensembles to the fundamental frequency of the /da/ stimulus. Note the absence of peak 2 and larger amplitude and latencies in monkey FFR.

Similar articles

Cited by

References

    1. Moore BC, Gockel HE. Properties of auditory stream formation. Philos Trans R Soc Lond B Biol Sci. 2012;367:919–931. doi: 10.1098/rstb.2011.0355. - DOI - PMC - PubMed
    1. Skoe E, Kraus N. Auditory brain stem response to complex sounds: a tutorial. Ear Hear. 2010;31:302–324. doi: 10.1097/AUD.0b013e3181cdb272. - DOI - PMC - PubMed
    1. Kraus, N., Anderson, S. & White-Schwoch T. The Frequency-Following Response: A Window into Human Communication (eds Kraus, N. et al.) Ch. 1, 1–15 (Springer-Nature, 2017).
    1. Chandrasekaran B, Kraus N. The scalp-recorded brainstem response to speech: neural origins and plasticity. Psychophysiology. 2010;47:236–246. doi: 10.1111/j.1469-8986.2009.00928.x. - DOI - PMC - PubMed
    1. Aiken SJ, Picton TW. Envelope and spectral frequency-following responses to vowel sounds. Hear Res. 2008;245:35–47. doi: 10.1016/j.heares.2008.08.004. - DOI - PubMed

Publication types

LinkOut - more resources