

Bending and breaking of stripes in a charge ordered manganite
- PMID: 29192204
- PMCID: PMC5709367
- DOI: 10.1038/s41467-017-02156-1
Bending and breaking of stripes in a charge ordered manganite
Abstract
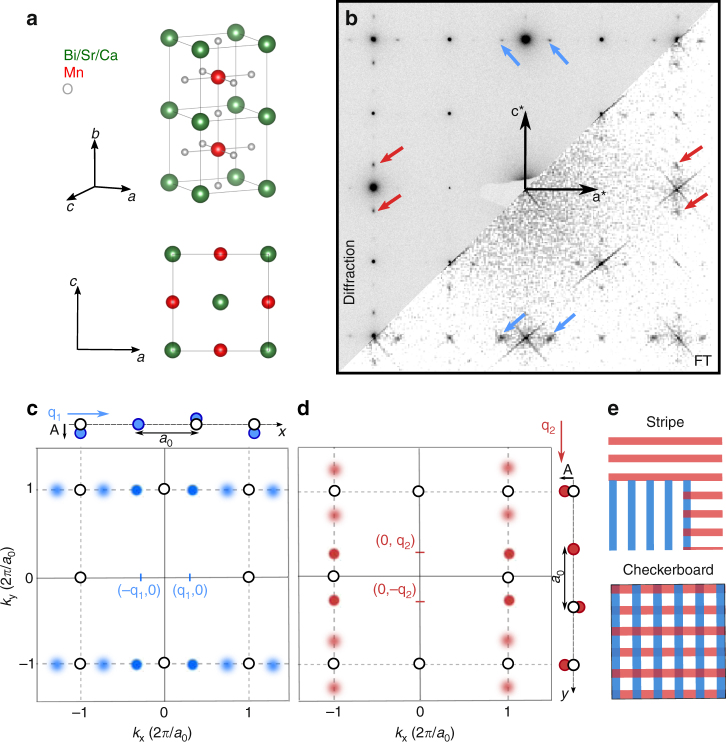
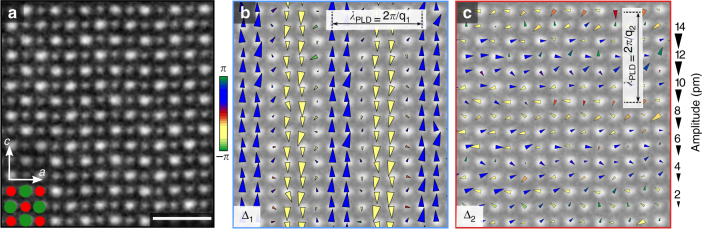
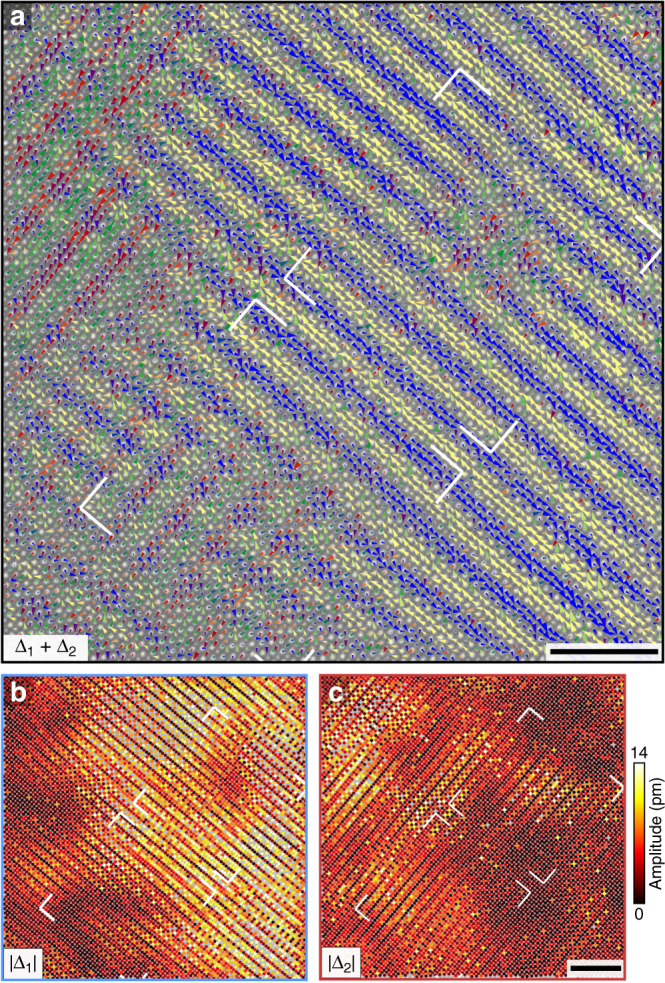
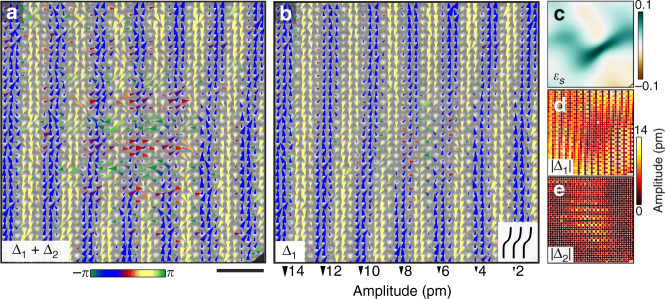
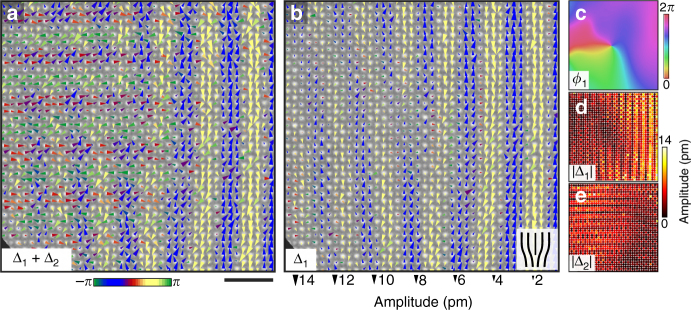
In charge-ordered phases, broken translational symmetry emerges from couplings between charge, spin, lattice, or orbital degrees of freedom, giving rise to remarkable phenomena such as colossal magnetoresistance and metal-insulator transitions. The role of the lattice in charge-ordered states remains particularly enigmatic, soliciting characterization of the microscopic lattice behavior. Here we directly map picometer scale periodic lattice displacements at individual atomic columns in the room temperature charge-ordered manganite Bi0.35Sr0.18Ca0.47MnO3 using aberration-corrected scanning transmission electron microscopy. We measure transverse, displacive lattice modulations of the cations, distinct from existing manganite charge-order models. We reveal locally unidirectional striped domains as small as ~5 nm, despite apparent bidirectionality over larger length scales. Further, we observe a direct link between disorder in one lattice modulation, in the form of dislocations and shear deformations, and nascent order in the perpendicular modulation. By examining the defects and symmetries of periodic lattice displacements near the charge ordering phase transition, we directly visualize the local competition underpinning spatial heterogeneity in a complex oxide.
Conflict of interest statement
The authors declare no competing financial interests.
Figures
Similar articles
-
Atomic-Resolution Cryogenic Scanning Transmission Electron Microscopy for Quantum Materials.Acc Chem Res. 2021 Sep 7;54(17):3277-3287. doi: 10.1021/acs.accounts.1c00303. Epub 2021 Aug 20. Acc Chem Res. 2021. PMID: 34415721
-
Nature and evolution of incommensurate charge order in manganites visualized with cryogenic scanning transmission electron microscopy.Proc Natl Acad Sci U S A. 2018 Feb 13;115(7):1445-1450. doi: 10.1073/pnas.1714901115. Epub 2018 Jan 30. Proc Natl Acad Sci U S A. 2018. PMID: 29382750 Free PMC article.
-
Atomic-scale images of charge ordering in a mixed-valence manganite.Nature. 2002 Apr 4;416(6880):518-21. doi: 10.1038/416518a. Nature. 2002. PMID: 11932740
-
Evolution and control of the phase competition morphology in a manganite film.Nat Commun. 2015 Nov 25;6:8980. doi: 10.1038/ncomms9980. Nat Commun. 2015. PMID: 26603478 Free PMC article.
-
Ordering phenomena in quasi-one-dimensional organic conductors.Naturwissenschaften. 2007 Jul;94(7):527-41. doi: 10.1007/s00114-007-0227-1. Epub 2007 May 4. Naturwissenschaften. 2007. PMID: 17479236 Review.
Cited by
-
Local orbital degeneracy lifting as a precursor to an orbital-selective Peierls transition.Nat Commun. 2019 Aug 13;10(1):3638. doi: 10.1038/s41467-019-11372-w. Nat Commun. 2019. PMID: 31409783 Free PMC article.
-
Well-defined double hysteresis loop in NaNbO3 antiferroelectrics.Nat Commun. 2023 Mar 30;14(1):1776. doi: 10.1038/s41467-023-37469-x. Nat Commun. 2023. PMID: 36997552 Free PMC article.
-
Coexisting commensurate and incommensurate charge ordered phases in CoO.Sci Rep. 2021 Sep 30;11(1):19415. doi: 10.1038/s41598-021-98739-6. Sci Rep. 2021. PMID: 34593883 Free PMC article.
-
Torsional periodic lattice distortions and diffraction of twisted 2D materials.Nat Commun. 2022 Dec 19;13(1):7826. doi: 10.1038/s41467-022-35477-x. Nat Commun. 2022. PMID: 36535920 Free PMC article.
-
Endotaxial stabilization of 2D charge density waves with long-range order.Nat Commun. 2024 Feb 15;15(1):1403. doi: 10.1038/s41467-024-45711-3. Nat Commun. 2024. PMID: 38360698 Free PMC article.
References
-
- Uehara M, Mori S, Chen CH, Cheong SW. Percolative phase separation underlies colossal magnetoresistance in mixed-valent manganites. Nature. 1999;399:560–563. doi: 10.1038/21142. - DOI
-
- Chang J, et al. Direct observation of competition between superconductivity and charge density wave order in YBa2Cu3O6.67. Nat. Phys. 2012;8:871–876. doi: 10.1038/nphys2456. - DOI
Publication types
LinkOut - more resources
Full Text Sources
Other Literature Sources
Research Materials
