. 2017 Nov 30;8(1):1862.
doi: 10.1038/s41467-017-01990-7.

Restoration of patterned vision with an engineered photoactivatable G protein-coupled receptor

Affiliations

Restoration of patterned vision with an engineered photoactivatable G protein-coupled receptor

Michael H Berry et al. Nat Commun. .

Erratum in

Abstract

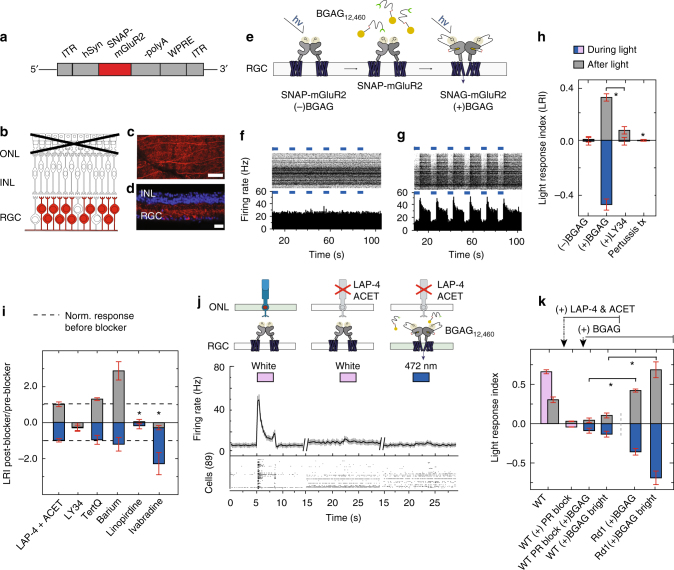
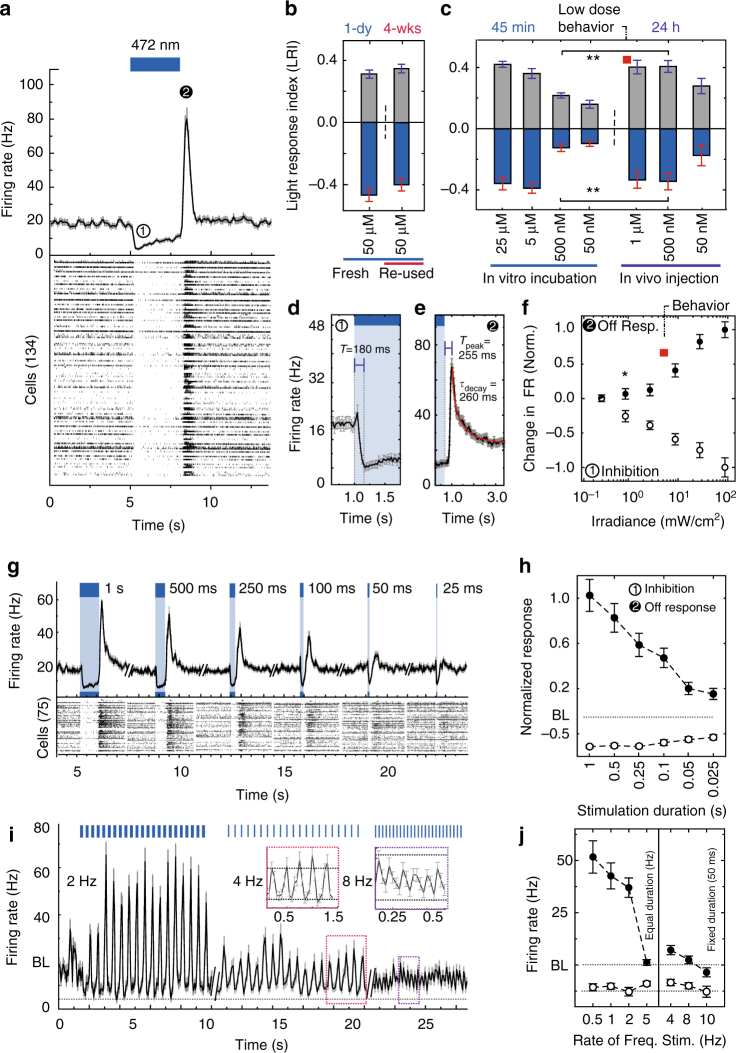
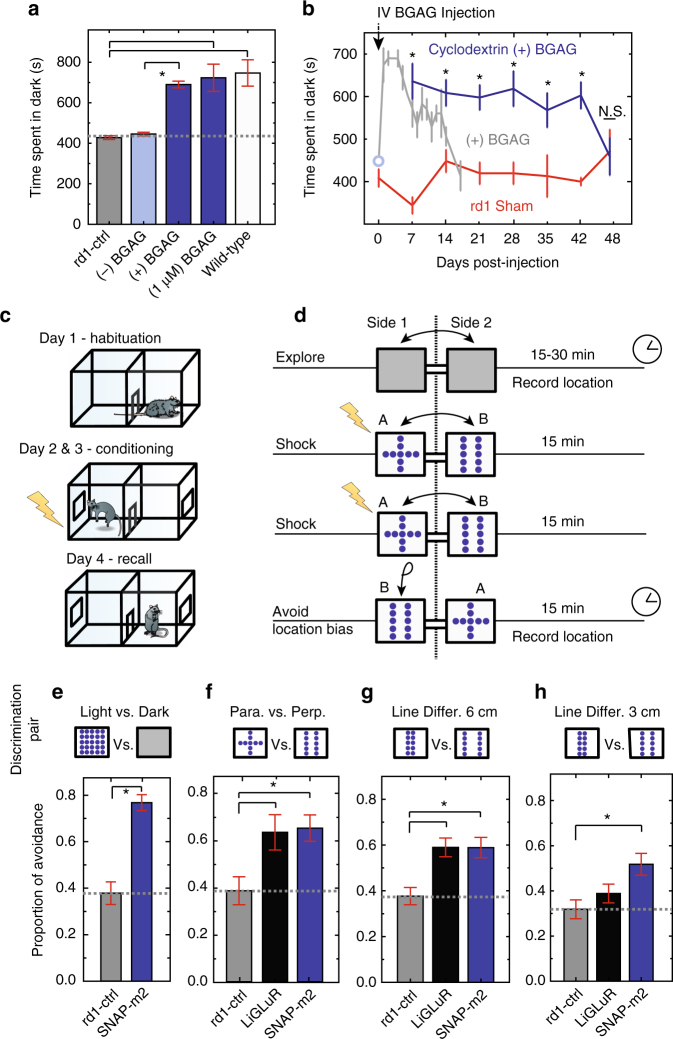
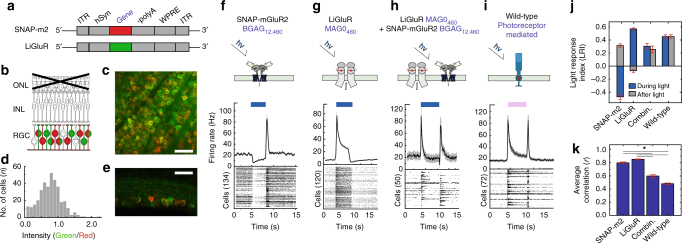
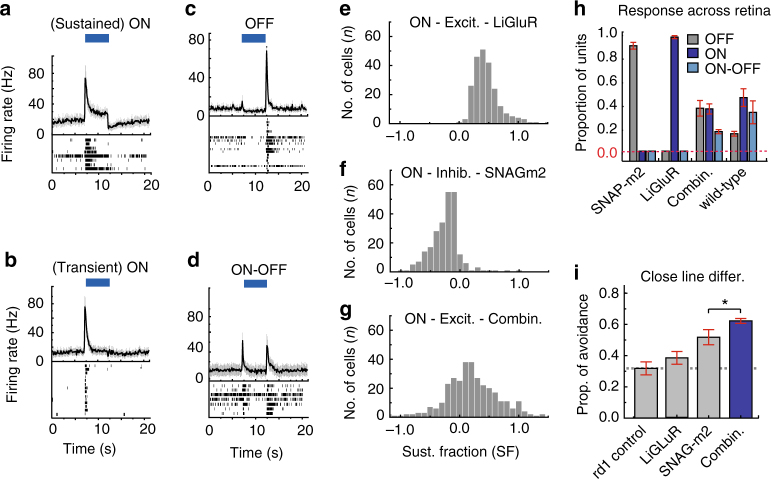
Retinitis pigmentosa results in blindness due to degeneration of photoreceptors, but spares other retinal cells, leading to the hope that expression of light-activated signaling proteins in the surviving cells could restore vision. We used a retinal G protein-coupled receptor, mGluR2, which we chemically engineered to respond to light. In retinal ganglion cells (RGCs) of blind rd1 mice, photoswitch-charged mGluR2 ("SNAG-mGluR2") evoked robust OFF responses to light, but not in wild-type retinas, revealing selectivity for RGCs that have lost photoreceptor input. SNAG-mGluR2 enabled animals to discriminate parallel from perpendicular lines and parallel lines at varying spacing. Simultaneous viral delivery of the inhibitory SNAG-mGluR2 and excitatory light-activated ionotropic glutamate receptor LiGluR yielded a distribution of expression ratios, restoration of ON, OFF and ON-OFF light responses and improved visual acuity. Thus, SNAG-mGluR2 restores patterned vision and combinatorial light response diversity provides a new logic for enhanced-acuity retinal prosthetics.


Conflict of interest statement

E.Y.I. is a co-founder of Photoswitch Therapeutics, which is developing approaches to vision restoration that may include use of the system described here. The remaining authors declare no competing financial interests.

Figures

Fig. 1
Fig. 1
Expression of SNAG-mGluR2 in RGCs of rd1 mouse retina. a Viral DNA expression cassette. SNAP-mGluR2 (red) under control of the hsyn-1 promoter. b Schematic of a degenerated rd1 mouse retina with targeted cells highlighted (red). ONL outer nuclear layer. IPL: inner plexiform layer. c, d Flat mount (c) and slice (d) confocal images of SNAP-mGluR2 expression in RGCs of rd1 mouse retina 4 weeks after intravitreal injection of AAV2/2-hSyn-SNAP-mGluR. SNAP-Surface Alexa Fluor 647 dye (red) used to visualize SNAP-mGluR2 and DAPI (blue) to visualize nuclei. Scale of 60 and 20 μm. e Schematic of SNAP-mGluR2 labeling by BGAG12,460 and photo-activation in RGCs. f, g MEA recordings from expressing rd1 mouse retinas in the absence of photoswitch (f) or following labeling with BGAG12,460 (g). (Top) Raster plot with spikes for each RGC (f:n = 120; g:n = 124). (Bottom) Peristimulus time histogram (PSTH). Light stimulation protocol: 5 × 5 s light (λ = 445 nm, blue bars) separated by 10 s dark. h Normalized Light response Index (LRI) for retina expressing SNAP-mGluR2 with no BGAG12,460, after 45 min of BGAG12,460, then in the presence of 5 μM LY341495 (N = 3, n = 156) and in separate retina LRI following retina injected with 150 µM pertussis toxin for 24 h (N = 4, n = 188). i Ratio of change in LRI before compared to after (LRI post-/LRI pre-) application of 50µM L-AP4 and 1 µM ACET (N = 2, nchannel = 65), 5 µM LY341495LY (N = 3, nc = 73), 300 nM Tertiapin-Q (N = 2, nc = 42), 1 mM barium (N = 2, nc = 27), 500 nM linopirdine (N = 2, nc = 37), or 50 µM ivabradine (N = 2, nc = 46) in the recording solution. j Schematic (top) trace response to 3 s light pulse in wt retina expressing SNAG-mGluR2. White light response before (left) and after (middle) photoreceptor block via addition of 50µM L-AP4 and 1 µM ACET and minimal light response to 445 nm with BGAG12,460 (right) (n = 98). k Normalized LRI of wt retina expressing SNAG-mGluR2 with photoreceptor blocker (before and after PR blocker = 50µM L-AP4 and 1 µM ACET) when illuminated by white light 100 µW cm−2 (pink), 445 nm light (20 mW cm−2) or 472 nm light (50 mW cm−2). Response compared with rd1 mice expressing SNAG-mGluR2. Light intensity 25 mW cm−2, BGAG12,460 labeling at 25 μM, N = # of retina, n = # of cells/units, nc = # of channels. All units refer to sorted cells. SEM in gray or as error bars. Statistical significance assessed using Mann-Whitney U test (*p ≤ 0.001) (Supplementary Table 1)
Fig. 2
Fig. 2
Properties of light response in isolated rd1 mouse retina with SNAG-mGluR2 in RGCs. a (top) Average response of RGC population showing peak inhibition (1) and OFF response following light termination (2). (bottom) Averaged raster plot (n = 134) 5 × 3 s duration with 472 nm light flashes. b BGAG12,460 stable for weeks in solution. No significant difference in peak responses between SNAP-mGluR2 expressing rd1 retinas labeled with freshly solubilized BGAG12,460 (n = 58 cells) vs. BGAG12,460 stored in aqueous solution for 4 weeks (n = 46) (N = 2). c BGAG12,460 labeling responses appear maximal at 5 µM when bathing retina for 45 min and 500 nM when injected intravitreally in vivo 24 h before retinal isolation (n > 50 units per retina, N = 14). Low done behavioral experiments performed at concentration indicated by red square. d, e Time-course of light response. Population average traces with time from light onset to max inhibition (d), exponential fit for OFF response decay (red) and time from light termination to max excitation (e). n = 109 and 95, N = 2. Time to peak of wt OFF responses also measured for comparisons n = 63, N = 2. f Light sensitivity for SNAG-mGluR2 in RGCs of rd1 mouse retina. Peak firing rates normalized for inhibition (open circle) and OFF response (closed circle). (n = 100, N = 2). Behavioral experiments performed at intensity indicated by red square. g, h Dependence of response on flash duration. g Representative retina light response (n = 75): individual cell response raster plot (top) and population average firing rate (bottom). ± SEM reveal detectable responses down to 25 ms duration flashes. h Average peak inhibition (open circle) and OFF response (filled circle) for different stimulation durations (n = 139, N = 2). i, j SNAG-mGluR2 enables RGCs to follow light pulses at up to 8 Hz. j Average peak inhibition ± SEM (open circle) and OFF response (filled circle) for different frequencies with either equal duration light pulses and dark intervals (0.5–5 Hz: 1 s light/1 s dark–100 ms light/100 ms dark) or fixed duration (50 ms) flashes with varying dark intervals (4–10 Hz) (n = 120, N = 2). Light intensity 25 or 50 mW cm−2, Wavelength: λ = 445 nm, BGAG12,460 labeling after retinal isolation for 45 min at 50 μM unless otherwise specified. N = # of retina, n = total units/cells. All units refer to sorted cells. SEM in gray or as error bars. Statistical significance assessed using Mann–Whitney U test (*p ≤ 0.001) (Supplementary Table 1)
Fig. 3
Fig. 3
Light avoidance and learned visually guided behavior in rd1 mouse expressing SNAG-mGluR2. a Restoration of light avoidance behavior. rd1 mice (n = 7) and rd1 mice expressing SNAP-mGluR2 spend equal times in dark and light compartments (grey dotted line) before delivery of BGAG12,460 (–BGAG) but prefer the dark compartment after intravitreal injection of BGAG12,460 ( + BGAG) (n = 7) to a similar level to wild-type mice (n = 7) and to mice treated with 500x lower photoswitch (n = 8). b Restored light avoidance persists 2 weeks after single injection of 1 mM BGAG12,460 (gray) (n = 7). When 3uM BGAG12,460 is combined with beta cyclodextrin in PBS as a method slow release drug delivery, light avoidance persists for 42 days (one-way ANOVA p < 0.005) with no decline in performance (blue) until day 48 (n = 11) (rANOVA p = 0.401). Rd1 sham injected mice were assessed over the same 48-day period (red) (n = 8) (Supplementary Table 2). c, d Schematic of pattern discrimination experiment. Mice habituated at day 1, exposed to electric shock in association with specific pattern of light (stimulus A/B) paired randomly in either chamber on days 2 and 3 and tested (time spent in each chamber) on day 4, in absence of shock with light patterns reversed to avoid location bias. e Learned dark avoidance behavior. Proportion of time spent avoiding the dark after paired conditioning with shock. rd1 SNAG-mGluR2 (n = 6), rd1 control (n = 6). Values mean ± SEM fh Learned pattern discrimination. Proportion of time spent avoiding pattern paired with shock. f Perpendicular vs. parallel bars. g, h Discrimination of parallel bars at distances of 1 vs. 6 cm (g) or 1 vs. 3 cm (h). Respectively for fg and h: rd1 control (n = 7, 13, 12 mice), rd1 LiGluR (n = 7, 14, 15 mice), rd1 SNAG-mGluR2 (n = 7, 10, 18 mice). In addition, proportion of success was also calculated (Supplementary Fig. 5b, d–g and Supplementary Table 3). All animals received 2 μL intravitreal injection of 1 μM BGAG12,460 in each eye and assayed following 24 h recovery. Display of 472 nm light equaled 5 mW cm−2 at decision point. n = # of mice. Statistical significance was assessed using repeated-measures ANOVA (b), one-way ANOVA: *p < 0.005 (b) (Supplementary Table 2), and Student’s two-tailed t-test with Bonferroni correction: *p < 0.01
Fig. 4
Fig. 4
Light responses when combining LiGluR and SNAG-mGluR2 in RGCs. a Viral DNA expression cassette. SNAP-mGluR2 (red) and LiGluR (green). be RGCs expressing LiGluR (green) and SNAP-mGluR2 (red). b Schematic of degenerated rd1 mouse retina. c, e Confocal images of rd1 mouse retina 4 weeks after intravitreal injection of 1:1 mixture of AAV2/2-hSyn-LiGluR and AV2/2-hSyn-SNAP-mGluR2 (5 × 1011 viral genomes). LiGluR stained with anti-iGluR6 (green); SNAP-mGluR2 with BG-Alexa Fluor 647 (red). d Histogram displaying the distribution of anti-iGluR6 (green)/SNAP-mGluR2 (red) intensity ratios for each cell n = 354, N = 3. fi Schematic (top) and RGC MEA response to 5 s pulse of 472 nm light (bottom) in rd1 retina whose RGCs contain either SNAP-mGluR2 + BGAG12,460 (f), LiGluR + MAG0460 (g), or both SNAP-mGluR2 and LiGluR + photoswitchs (h). Photoreceptor-mediated response in wt shown for comparison (i). Raster plots of individual units are averages of 5 flashes, SEM in gray. j LRI of peak responses during (blue) and after (gray) illumination in rd1 retinae with SNAG-mGluR2, LiGluR, SNAP-mGluR2 and LiGluR together (Combin.), and in wt retina. Values mean ± SEM n ≥ 50, N = 4. k Average cross-correlation values in rd1 retinas with SNAG-mGluR2 (n = 134), LiGluR (n = 120), SNAG-mGluR2 + LiGluR (n = 90), and in wild-type retina (n = 93). Cross-correlation of all light-sensitive units in period 1 s before to 2 s after light pulse. Values mean ± SEM. Light 472 nm at 50 mW cm−2. Photoswitch concentration 50 μM. N = # of retina, n = # of units/cells, all units refer to sorted cells. Statistical significance was assessed using Mann-Whitney U test (*p < 0.001) (Supplementary Table 1)
Fig. 5
Fig. 5
Assessment and behavioral function with restoration using co-expression of LiGluR with SNAG-mGluR2. ad (top) Averaged response of RGC ON-sustained (a), ON transient (b), OFF (c), ON–OFF (d) responding population within the same retina expressing both SNAG-mGluR2 and LiGluR. Standard errors in gray. (Bottom) Averaged raster plot of individual units for 10 flashes of blue light. eg Histograms showing distribution across RGC population in sustained fraction of the light response, calculated as the firing rate at the end of illumination divided by the peak-firing rate for each cell (larger peak response selected between initial response at the start of illumination and the rebound OFF response). N = 3 retinas per condition: LiGluR alone (n = 227); f), SNAG-mGluR2 alone (n = 246) and SNAP-mGluR2 + LiGluR co-expression (n = 222). h Proportion of units identified in retinas that display ON (blue), OFF (gray) and ON-OFF (light blue) response to full field illumination. Retinas expressing SNAP-mGluR2 (Left), LiGluR (Middle-left), both SNAP-mGluR2 and LiGluR (Middle-right), or wt (N = 3 retinas per condition). Error bars represent S.D., red dashed line denotes zero, emphasizing the absence of ON and ON-OFF responses in SNAG-mGluR2 alone and of OFF and ON-OFF responses in LiGluR alone. i Learned pattern discrimination behavior using paring of parallel bars with distances of 1 vs. 3 cm. Plotted mean proportion of time spent on non-aversive side (avoiding) the pattern associated with the shock for rd1 co-expressing LiGluR + SNAG-mGluR2 (Blue) (N = 18). rd1 untreated control (Gray-Left) (n = 12), LiGluR (Gray-Middle) (N = 15), rd1- SNAP-mGluR2 (Gray-right) (N = 18), reproduced from Fig. 4h for reference and comparison. In addition, proportion of success was also calculated (Supplementary Fig. 5 b, d–g and Table 3). Light intensity 25–50 mW cm−2, BGAG12,460 labeling at 50 μM. N = retina or mice per condition, n = total units/cells. All units refer to sorted cells. All animals received 2 μL intravitreal injection of 1 μM BGAG12,460 in each eye and assayed following 24 h recovery. Display of 472 nm light equaled 5 mW cm2 at decision point. Statistical significance was assessed using Student’s two-tailed t-test: *p < 0.05 (i)

References

    1. Shintani K, Shechtman DL, Gurwood AS. Review and update: current treatment trends for patients with retinitis pigmentosa. Optometry. 2009;80:384–401. doi: 10.1016/j.optm.2008.01.026. - DOI - PubMed
    1. Marc RE, Jones BW, Watt CB, Strettoi E. Neural remodeling in retinal degeneration. Prog. Retin. Eye Res. 2003;22:607–655. doi: 10.1016/S1350-9462(03)00039-9. - DOI - PubMed
    1. Leveillard T, Sahel JA. Rod-derived cone viability factor for treating blinding diseases: from clinic to redox signaling. Sci. Transl. Med. 2010;2:26ps16. doi: 10.1126/scitranslmed.3000866. - DOI - PMC - PubMed
    1. Mazzoni F, Novelli E, Strettoi E. Retinal ganglion cells survive and maintain normal dendritic morphology in a mouse model of inherited photoreceptor degeneration. J. Neurosci. 2008;28:14282–14292. doi: 10.1523/JNEUROSCI.4968-08.2008. - DOI - PMC - PubMed
    1. Haverkamp S, et al. Synaptic plasticity in CNGA3(-/-) mice: cone bipolar cells react on the missing cone input and form ectopic synapses with rods. J. Neurosci. 2006;26:5248–5255. doi: 10.1523/JNEUROSCI.4483-05.2006. - DOI - PMC - PubMed

Publication types

MeSH terms

Substances