. 2017 Nov 30;7(1):16623.
doi: 10.1038/s41598-017-16811-6.

Profiling of different pancreatic cancer cells used as models for metastatic behaviour shows large variation in their N-glycosylation

Affiliations

Profiling of different pancreatic cancer cells used as models for metastatic behaviour shows large variation in their N-glycosylation

Stephanie Holst et al. Sci Rep. .

Abstract

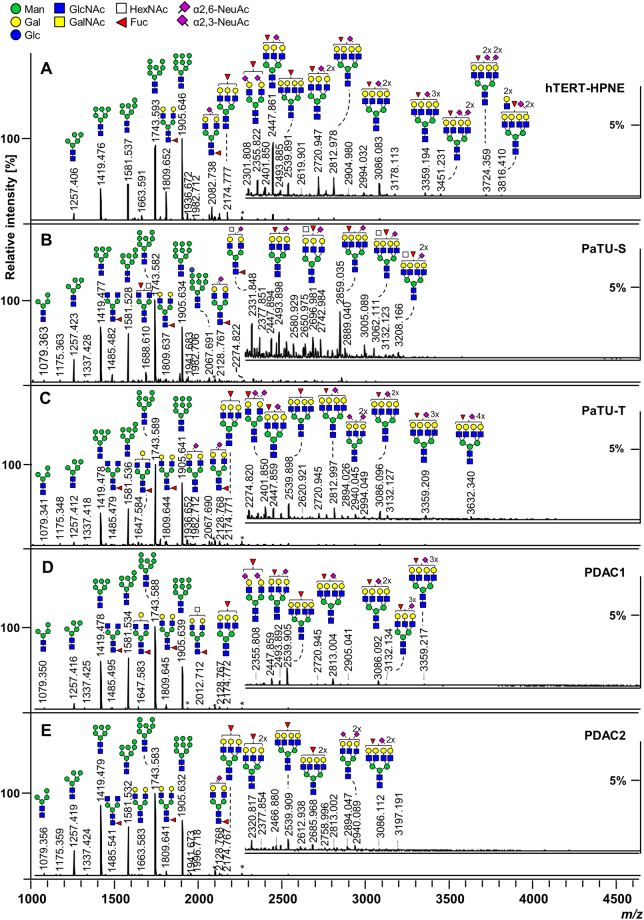
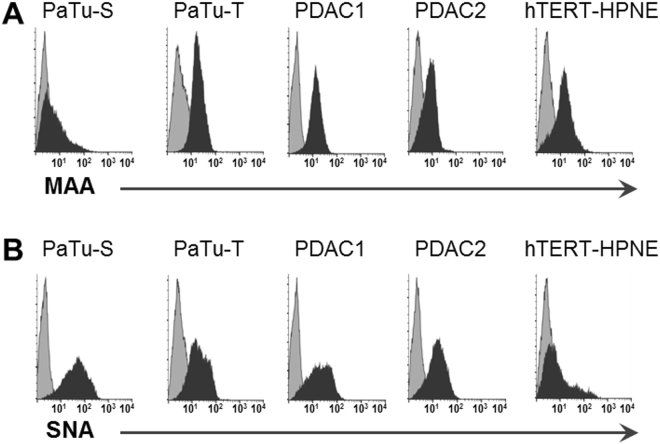
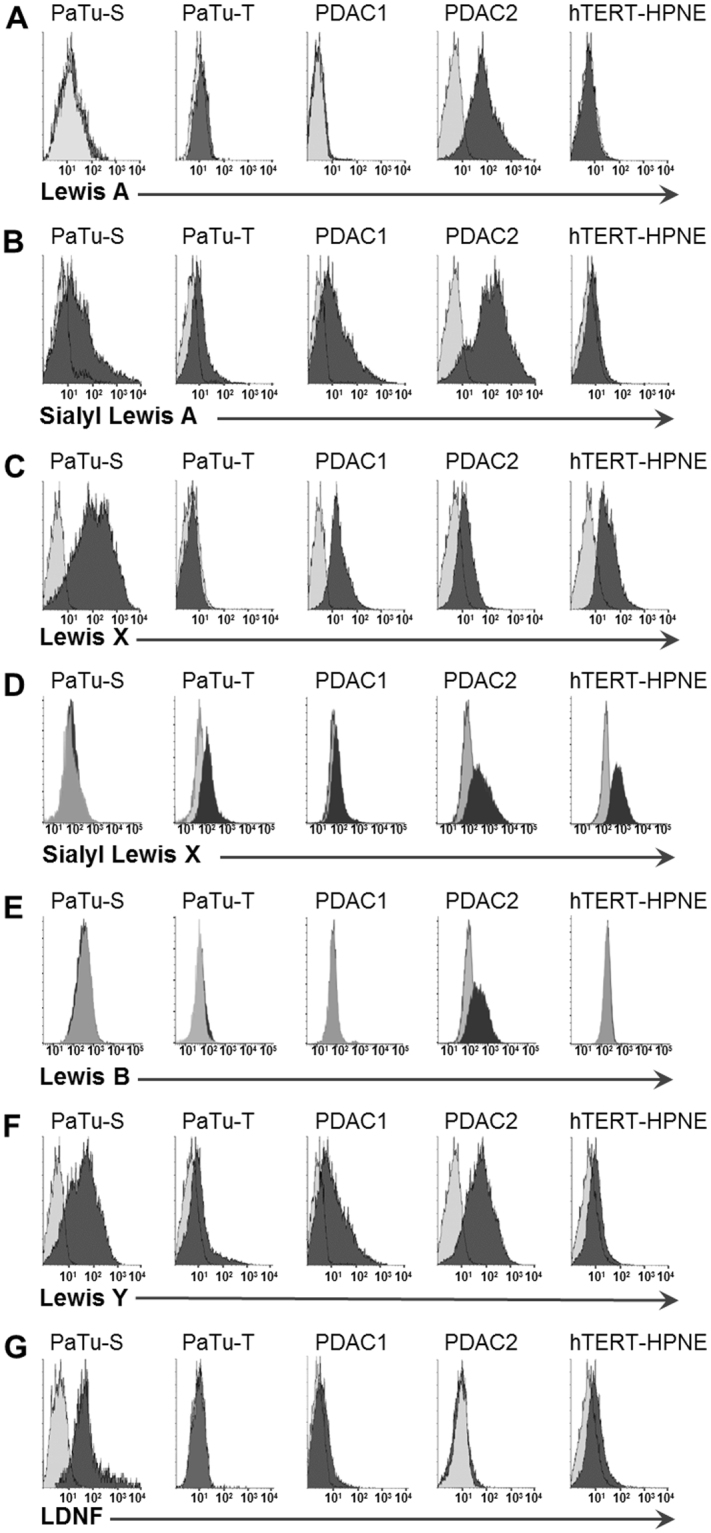
To characterise pancreatic cancer cells from different sources which are used as model systems to study the metastatic behaviour in pancreatic ductal adenocarcinoma (PDAC), we compared the N-glycan imprint of four PDAC cells which were previously shown to differ in their galectin-4 expression and metastatic potential in vivo. Next to the sister cell lines Pa-Tu-8988S and Pa-Tu-8988T, which were isolated from the same liver metastasis of a PDAC, this included two primary PDAC cell cultures, PDAC1 and PDAC2. Additionally, we extended the N-glycan profiling to a normal, immortalized pancreatic duct cell line. Our results revealed major differences in the N-glycosylation of the different PDAC cells as well as compared to the control cell line, suggesting changes of the N-glycosylation in PDAC. The N-glycan profiles of the PDAC cells, however, differed vastly as well and demonstrate the diversity of PDAC model systems, which ultimately affects the interpretation of functional studies. The results from this study form the basis for further biological evaluation of the role of protein glycosylation in PDAC and highlight that conclusions from one cell line cannot be generalised, but should be regarded in the context of the corresponding phenotype.


Conflict of interest statement

The authors declare that they have no competing interests.

Figures

Figure 1
Figure 1
Representative positive ion mode MALDI-TOF-MS spectra of released and derivatized N-glycans. Exemplary mass spectra of (A) Pancreatic duct cell line hTERT-HPNE, (B) Pancreatic duct adenocarcinoma (PDAC) sister cell lines PaTu-S and (C) PaTu-T, as well as the primary PDAC cell cultures (D) PDAC1, and (E) PDAC2 are shown. Major glycan peaks are annotated. Symbolic glycan depictions represent compositions and the presence of structural isomers cannot be excluded. Glc = glucose; Gal = galactose; Man = mannose; GlcNAc = N-acetylglucosamine; GalNAc = N-acetylgalactosamine; Fuc = deoxyhexose, fucose; NeuAc = N-acetylneuraminic acid; *reducing end adduct.
Figure 2
Figure 2
Fragmentation spectra. (A) MALDI-TOF/TOF-MS/MS fragmentation spectrum of the N-glycan Hex7HexNAc6Fuc2(α2,6)NeuAc1 with m/z 3005.48 [M + Na]+. The fragment ion at m/z 707.2 [M + Na]+ is indicative for Hex1HexNAc1(α2,6)NeuAc1. The mass shift of + 28 Da from a non-modified N-acetylneuraminic acid to an ethyl esterified N-acetylneuraminic acid indicates α2,6-linkage. The position of the α2,6NeuAc as well as the antenna fucose cannot be identified. (B) MALDI-TOF/TOF-MS/MS fragmentation spectrum of the N-glycan Hex4HexNAc5Fuc3 with m/z 2142.78 [M + Na]+. Fragment ions for antenna-fucosylation (m/z 712.1 [M + Na]+, m/z 874.1 [M + Na]+) as well as core-fucosylation (m/z 1077.0 [M + Na]+) were identified. (C) LC-MS/MS fragmentation spectrum of the N-glycan Hex3 HexNAc6Fuc3 with m/z 1142.05 [M + H]2+. Indicative fragment ions at m/z 407 [M + H]+ (HexNAc2) and m/z 553 [M + H]+ (HexNAc2dHex1) show the presence of LacdiNAc structures. Annotation was performed in GlycoWorkbench 2.1 stable build 146 (http://www.eurocarbdb.org/) using the Glyco-Peakfinder tool (http://www.eurocarbdb.org/ms-tools/). The presence of structural isomers cannot be excluded. Hex = hexose; blue circle = Glc, glucose; yellow circle = Gal, galactose; green circle = Man, mannose; blue square = GlcNAc, N-acetylglucosamine; yellow square = GalNAc, N-acetylgalactosamine; white square = HexNAc, N-acetylhexosamine; red triangle = Fuc, deoxyhexose, fucose; purple diamond = NeuAc, N-acetylneuraminic acid; *reducing end adduct.
Figure 3
Figure 3
Analysis of structural N-glycan classes. Derived traits were calculated and averaged per cell line for the biological replicates from mass spectrometry analysis. Boxplots are illustrated with median and interquartile range. (A) Total high-mannose type content, (B) Total complex-type N-glycans, (C) Total hybrid type structures. Following derived traits were calculated including exclusively N-glycans of the complex type: (D) α2,6-Sialylation, (E) α2,3-Sialylation, (F) Fucosylation, (G) Multi-fucosylation defined as the presence of more than one fucose, representative for antenna-fucosylation, (H) Multi-fucosylation of α2,3-sialylated N-glycans, indicative for sialyl Lewis antigens, (I) N-glycans featuring an equal number of N-acetylhexosamines (HexNAc) compared to hexoses (Hex), (J) N-glycans featuring smaller number of Hex than HexNAc, (K) N-glycans with HexNAc = 4, indicative for di-antennary N-glycans, (L) N-glycans with HexNAc = 6, indicative for tetra-antennary N-glycans as well as LacNAc-repeats, bisecting GlcNAc, or GalNAcs additions. Traits were tested for significant differences between the samples and p-values are given in Supplemental Table S7.
Figure 4
Figure 4
Principal Component Analysis (PCA). The PCA resulted in five principal components (PCs) explaining 85.2% of variation in the data (R2Xcum) with a very good prediction power (Q2cum) of 76%. Unit variance (UV)-scaling was applied to the data and validation of the model was performed by internal cross-validation (CV) based on biological replicates (n = 8) as CV groups. (A) Score plot of PC1 (45.5%) vs PC2 (15.1%) demonstrating the largest separation between PaTu-S and the normal cell line on PC1 and between the two cell lines PaTu-S and PaTu-T versus the two primary cell cultures PDAC1 and PDAC2 on PC2. (B) Corresponding loading plot of PC1 vs. PC2 illustrating the derived N-glycan traits on which the PCA model is build. Coloring the loadings according to glycan features, here α2,6-sialylation (E), blue) vs. α2,3-sialylation (L, rose) vs. non-sialylated (default, grey), was used in order to facilitate the identification of differences between the samples. (C) Loading plot as in B, colored according to fucosylation with non-fucosylated (F0, green) vs. multi-fucosylated (Fa, purple). (D) Loading plot as B, colored according to the ratio of the number of hexoses (Hex, H) to the amount of N-acetylhexosamines (HexNAc, N) with H equal to N (HeqN, blue) vs. H smaller than N (HltN, red). The table provides the statistic of the model.
Figure 5
Figure 5
Flow cytometry binding assay with plant lectins. The avidity of binding of plant lectins (A) Maackia amurensis agglutinin (MAA) and (B) Sambucus nigra agglutinin (SNA) to PaTu-S, PaTu-T, PDAC1, PDAC2, and hTERT-HPNE was determined. Overlay histograms of representative experiments from at least three independent experiments are shown. Dark grey field: staining with the antibody against the respective structure by means of fluorescent intensity; light grey field: background staining with secondary antibodies. Averaged mean fluorescence intensities (MFI) are given in Supplemental Table S3.
Figure 6
Figure 6
Flow cytometry binding assay with monoclonal antibodies. Binding of antibodies recognizing (A) Lewis A, (B) sialyl Lewis A (CA 19-9), (C) Lewis X, (D) sialyl Lewis X (E) Lewis B, (F) Lewis Y and (G) LDNF to PaTu-S, PaTu-T, PDAC1, PDAC2, and hTERT-HPNE was investigated. Overlay histograms of representative experiments from at least three independent experiments are shown. Dark grey field: staining with the antibody against the respective structure by means of fluorescent intensity; light grey field: background staining with secondary antibodies. Averaged mean fluorescence intensities (MFI) are given in Supplemental Table S3.

References

    1. Siegel RL, Miller KD, Jemal A. Cancer statistics, 2016. CA: a cancer journal for clinicians. 2016;66:7–30. - PubMed
    1. Cooperman AM. PANCREATIC CANCER: The Bigger Picture. Surgical Clinics of North America. 2001;81:557–574. doi: 10.1016/S0039-6109(05)70143-2. - DOI - PubMed
    1. Bosetti C, et al. Pancreatic cancer: overview of descriptive epidemiology. Mol Carcinog. 2012;51:3–13. doi: 10.1002/mc.20785. - DOI - PubMed
    1. Kleeff J, et al. Pancreatic cancer. Nat Rev Dis Primers. 2016;2:16022. doi: 10.1038/nrdp.2016.22. - DOI - PubMed
    1. Winter JM, et al. Survival after resection of pancreatic adenocarcinoma: results from a single institution over three decades. Annals of surgical oncology. 2012;19:169–175. doi: 10.1245/s10434-011-1900-3. - DOI - PubMed

Publication types