. 2018 Feb;12(2):623-633.
doi: 10.1038/ismej.2017.197. Epub 2017 Dec 1.

Microbial life on a sand grain: from bulk sediment to single grains

Affiliations

Microbial life on a sand grain: from bulk sediment to single grains

David Probandt et al. ISME J. 2018 Feb.

Abstract

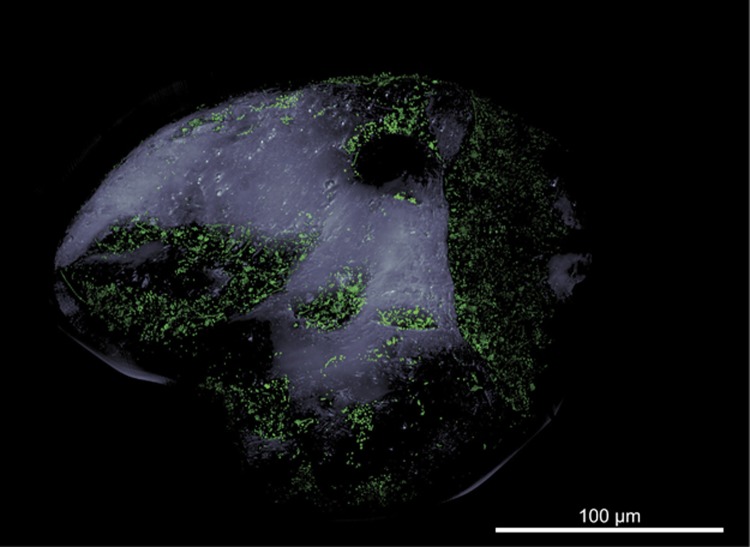
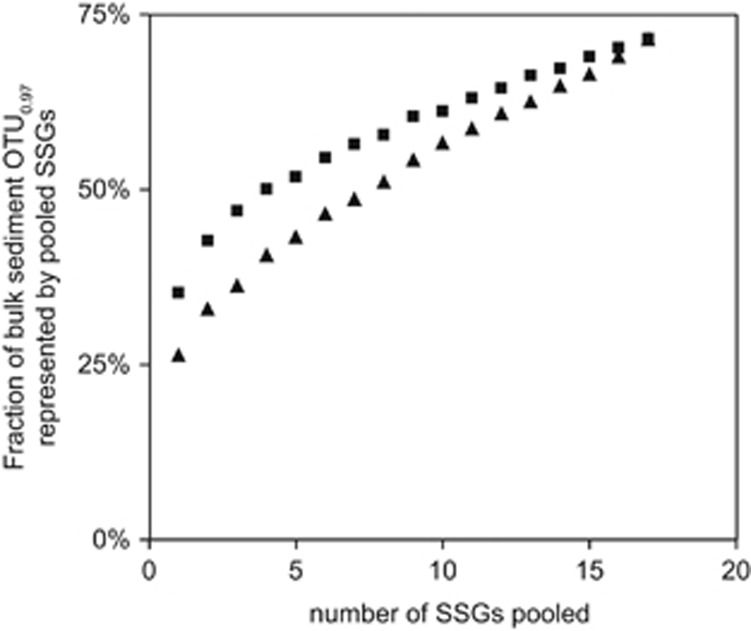
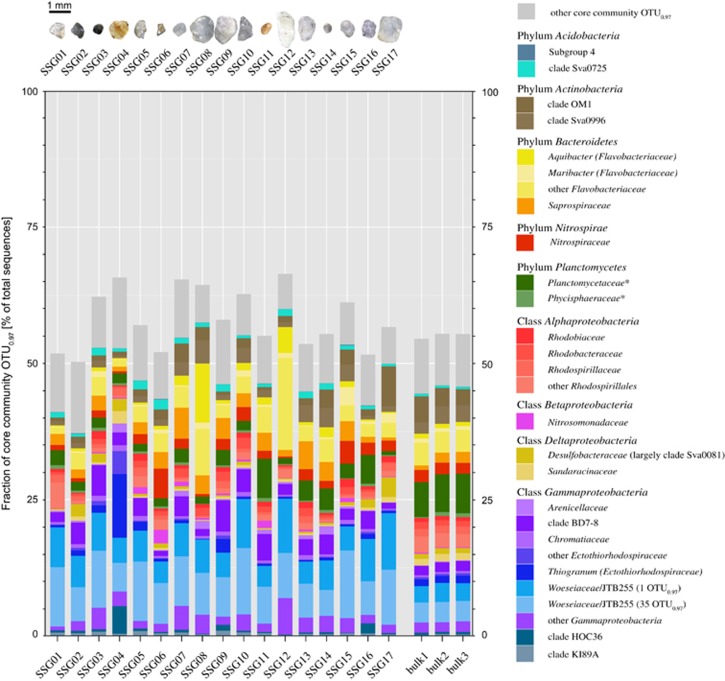
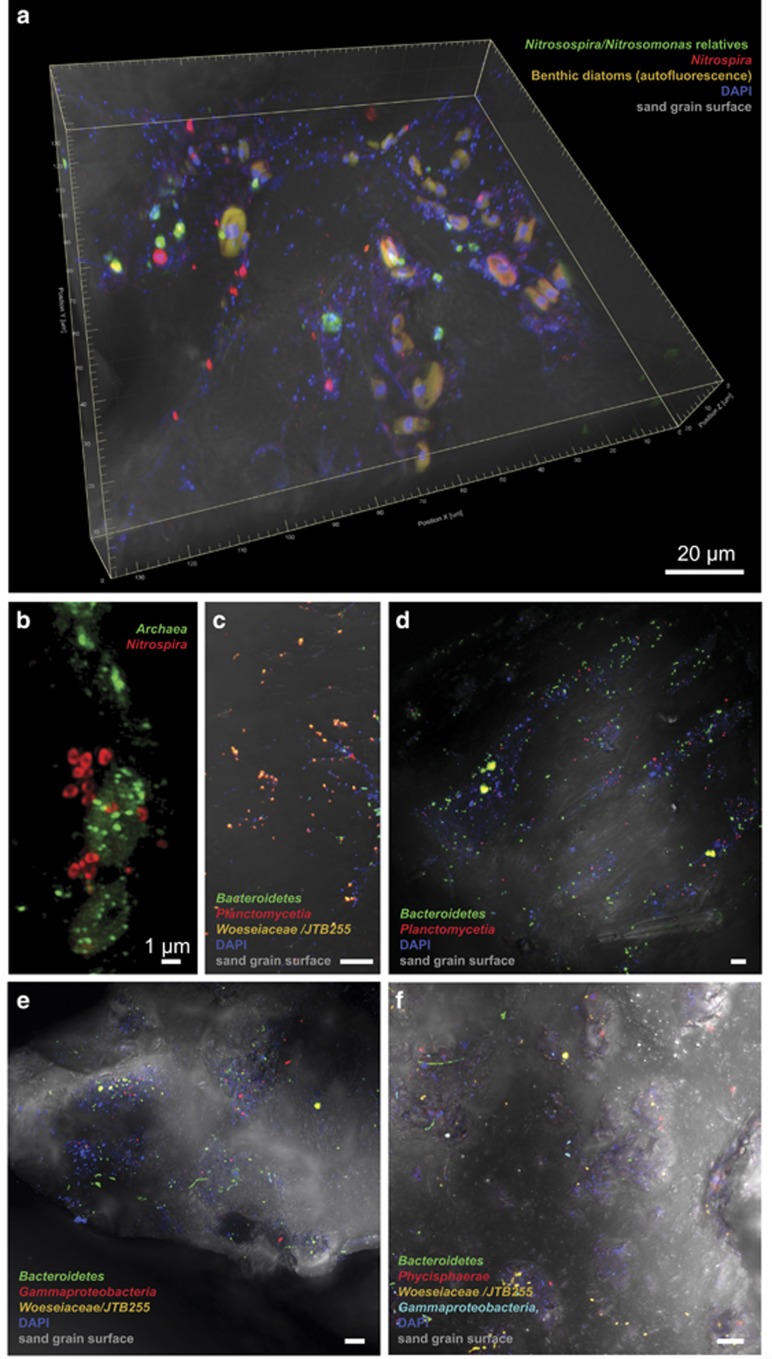
Globally, marine surface sediments constitute a habitat for estimated 1.7 × 1028 prokaryotes. For benthic microbial community analysis, usually, several grams of sediment are processed. In this study, we made the step from bulk sediments to single sand grains to address the microbial community directly in its micro-habitat: the individual bacterial diversity on 17 sand grains was analyzed by 16S ribosomal RNA gene sequencing and visualized on sand grains using catalyzed reporter deposition fluorescence in situ hybridization. In all, 104-105 cells were present on grains from 202 to 635 μm diameter. Colonization was patchy, with exposed areas largely devoid of any epi-growth (mean cell-cell distance 4.5±5.9 μm) and protected areas more densely populated (0.5±0.7 μm). Mean cell-cell distances were 100-fold shorter compared with the water column. In general, growth occurred in monolayers. Each sand grain harbors a highly diverse bacterial community as shown by several thousand species-level operational taxonomic units (OTU)0.97. Only 4-8 single grains are needed to cover 50% of OTU0.97 richness found in bulk sediment. Although bacterial communities differed between sand grains, a core community accounting for >50% of all cells was present on each sand grain. The communities between sediment grains are more similar than between soil macroaggregates.


Conflict of interest statement

The authors declare no conflict of interest.

Figures

Figure 1
Figure 1
Microbial colonization of a sand grain. Confocal laser scanning micrograph showing SYBR green I-stained microbial cells on a sand grain visualized as three-dimensional reconstruction. The grain’s surface was visualized by transmitted light microscopy. Note the bare surfaces of convex and exposed areas in contrast to protected areas dominated by macrotopography, which are densely populated by microbes.
Figure 2
Figure 2
Fraction of bulk sediment OTU0.97 richness shared by data sets from pools of SSGs. Depicted values based on consecutively pooled SSGs in decreasing order (▪) or increasing order (▴) of their individual OTU0.97 richness. For bacterial diversity indices of individual sand grains see Supplementary Table S2. Subsampling of SSG data sets and bulk sediment data sets were done in a way that always identical number of sequences were compared.
Figure 3
Figure 3
Relative contribution of sand grain core community OTU0.97 to total community based on sequencing of 16S rRNA gene fragments. The core community that was present on all 17 individual sand grains in June 2016, comprised 394 OTU0.97. The taxonomic classification of core community OTU0.97 is given on family level. Thus, each depicted family can comprise several OTU0.97. Core community families and uncultivated clades contributing on average <0.5% to total 16S rRNA gene sequences are summarized as 'other core community OTU0.97'. Depicted core community composition is based on subsampled data sets (n=44 901 sequences). For some families, that is, Woeseiaceae/JTB255, Flavobacteriaceae and Ectothiorhodospiraceae, a higher taxonomic resolution is given. *Sequences classified as Planctomycetaceae and Phycisphaeraceae rather represent several unclassified families within the class Planctomycetia and Phycisphaerae, respectively.
Figure 4
Figure 4
Direct visualization of taxa on sand grains using CARD-FISH and confocal laser scanning microscopy. Targeted taxa are indicated in the individual panels a to f. DAPI signal (in blue) shows all cells not targeted by the probes. All images (except for b) are composite micrographs of fluorescent signals and transmitted light of the sand grain’s surface. Micrograph a is also available as a video in the Supplementary Information showing the microbial colonization of protected and exposed areas in the three-dimensional space. Micrograph b is a superresolution structured illumination image (SR-SIM). If not otherwise indicated, scale bar refers to 10 μm. Probes used are listed in Supplementary Table S1.

References

    1. Ahmerkamp S. (2016) Regulation of Oxygen Dynamics in Sandy Sediments. Dissertation, Faculty of Geosciences, FB 5, University of Bremen: Germany.
    1. Ahmerkamp S, Winter C, Krämer K, de Beer D, Janssen F, Friedrich J et al. (2017). Regulation of benthic oxygen fluxes in permeable sediments of the coastal ocean. Limnol Oceanogr 62: 1935–1954.
    1. Bailey VL, Fansler SJ, Stegen JC, McCue LA. (2013). Linking microbial community structure to β-glucosidic function in soil aggregates. ISME J 7: 2044–2053. - PMC - PubMed
    1. Chao A. (1984). Nonparametric estimation of the number of classes in a population. Scand J Stat 11: 265–270.
    1. Chen J. (2012), GUniFrac: generalized UniFrac distances. R-package version 1.0.

Publication types