

Quantitative profiling of carbonyl metabolites directly in crude biological extracts using chemoselective tagging and nanoESI-FTMS
- PMID: 29192912
- PMCID: PMC6759371
- DOI: 10.1039/c7an01256j
Quantitative profiling of carbonyl metabolites directly in crude biological extracts using chemoselective tagging and nanoESI-FTMS
Erratum in
-
Correction: Quantitative profiling of carbonyl metabolites directly in crude biological extracts using chemoselective tagging and nanoESI-FTMS.Analyst. 2018 Feb 12;143(4):999. doi: 10.1039/c8an90009d. Analyst. 2018. PMID: 29359211
Abstract
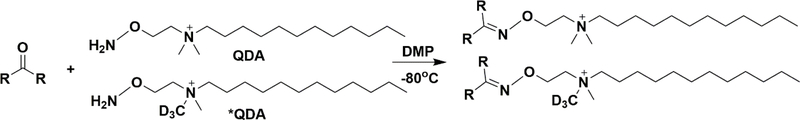
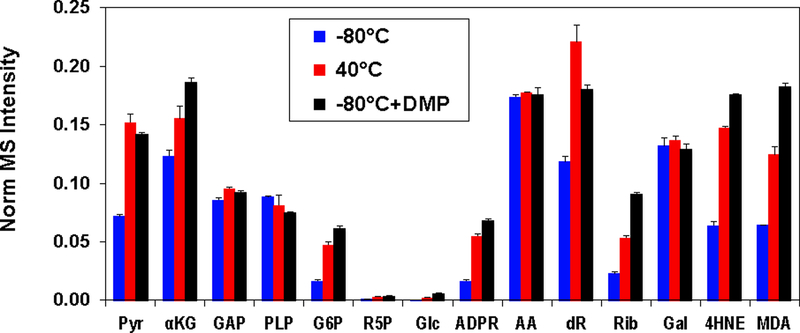
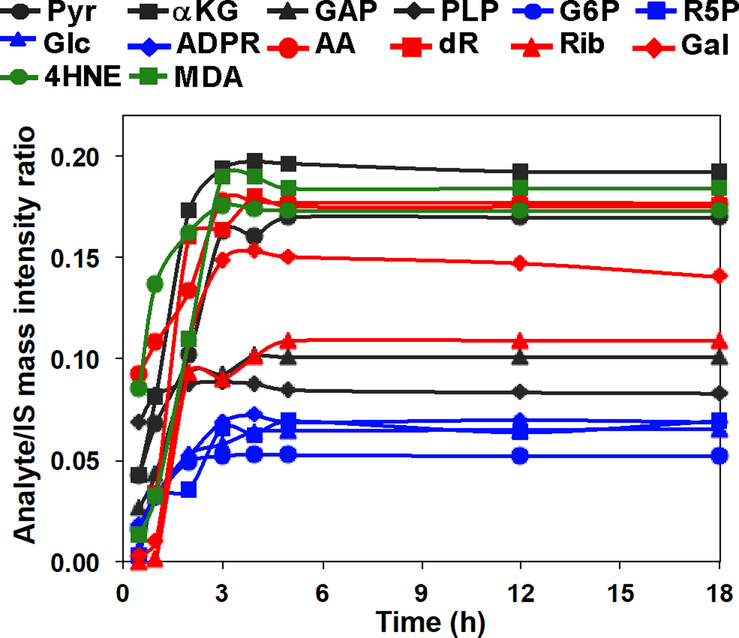
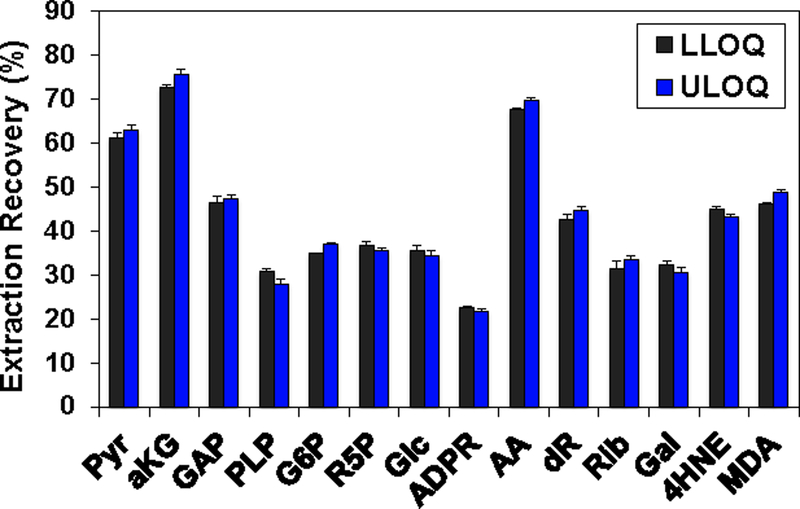
The extensive range of chemical structures, wide range of abundances, and chemical instability of metabolites present in the metabolome pose major analytical challenges that are difficult to address with existing technologies. To address these issues, one approach is to target a subset of metabolites that share a functional group, such as ketones and aldehydes, using chemoselective tagging. Here we report a greatly improved chemoselective method for the quantitative analysis of hydrophilic and hydrophobic carbonyl-containing metabolites directly in biological samples. This method is based on direct tissue or cells extraction with simultaneous derivatization of stable and labile carbonylated metabolites using N-[2-(aminooxy)ethyl]-N,N-dimethyl-1-dodecylammonium (QDA) and 13CD3 labeled QDA. We combined innovations of direct quenching of biological sample with frozen derivatization conditions under the catalyst N,N-dimethyl-p-phenylenediamine, which facilitated the formation of oxime stable-isotope ion pairs differing by m/z 4.02188 while minimizing metabolite degradation. The resulting oximes were extracted by HyperSep C8 tips to remove interfering compounds, and the products were detected using nano-electrospray ionization interfaced with a Thermo Fusion mass spectrometer. The quaternary ammonium tagging greatly increased electrospray MS detection sensitivity and the signature ions pairs enabled simple identification of carbonyl compounds. The improved method showed the lower limits of quantification for carbonyl standards to be in the range of 0.20-2 nM, with linearity of R2 > 0.99 over 4 orders of magnitude. We have applied the method to assign 66 carbonyls in mouse tumor tissues, many of which could not be assigned solely by accurate mass and tandem MS. Fourteen of the metabolites were quantified using authentic standards. We also demonstrated the suitability of this method for determining 13C labeled isotopologues of carbonyl metabolites in 13C6-glucose-based stable isotope-resolved metabolomic (SIRM) studies.
Conflict of interest statement
Conflicts of Interest
There are no conflicts of interest to declare.
Figures
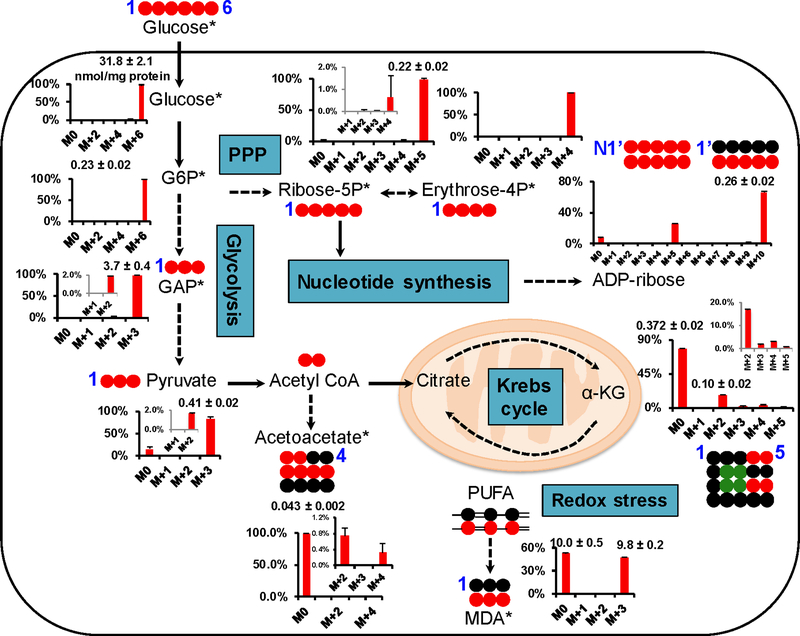
 : 12C;
  ,
,  : 13C from pyruvate dehydrogenase and pyruvate carboxylase-initiated Krebs cycle reactions, respectively; N1’: 1’-ribose attached to the nicotinamide ring.
References
Publication types
Grants and funding
LinkOut - more resources
Full Text Sources
Other Literature Sources