Review
. 2018 Mar;27(3):595-613.
doi: 10.1002/pro.3355. Epub 2017 Dec 15.

Thermodynamic secrets of multidrug resistance: A new take on transport mechanisms of secondary active antiporters

Affiliations
Review

Thermodynamic secrets of multidrug resistance: A new take on transport mechanisms of secondary active antiporters

Xuejun C Zhang et al. Protein Sci. 2018 Mar.

Abstract

Multidrug resistance (MDR) presents a growing challenge to global public health. Drug extrusion transporters play a critical part in MDR; thus, their mechanisms of substrate recognition are being studied in great detail. In this work, we review common structural features of key transporters involved in MDR. Based on our membrane potential-driving hypothesis, we propose a general energy-coupling mechanism for secondary-active antiporters. This putative mechanism provides a common framework for understanding poly-specificity of most-if not all-MDR transporters.

Keywords: energy coupling; exporters; membrane potential; multidrug resistance; titratable residue.


Figures

Figure 1
Figure 1
Crystal structures of MDR transporters. Examples of PMF‐driven antiporters of the MFS (MdfA, PDB ID: 4ZOW), MATE (PfMATE, 3W4T), SMR (dimeric EmrE, 3B5D), RND (trimeric AcrB, 4DX5), and ABC (Pgp, 3G5U) families are shown in ribbon diagrams. The N‐ and C‐terminal TM domains (and two protomers of EmrE) are shown in green and blue, respectively, and other domains in pink. Amphipathic helices are shown in orange color. Two subunits of the AcrB trimer are shown in grey. Key titratable residues are marked by red spheres.
Figure 2
Figure 2
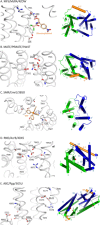
Titratable residues and TM helices in MDR transporters. In the left column, environments of titratable residues are shown in tube‐stick models. Labels of the key titratable residues are underlined. Substrates bound in MdfA and EmrE are shown in wheat color. In the right column, TM domains (except that of RND/AcrB) are viewed from the cytosolic direction, and TM helices are shown as cylinders and labelled. The color code is the same as in Fig. 1 (except that, in the ABC/Pgp structure, coupling helices are shown in grey color).
Figure 3
Figure 3
Schematic diagram of the membrane potential‐driving hypothesis. The hydrophobic mismatch forces are generated at the interface between the transporter and surrounding lipid bilayer, to balance the electrostatic force that exerts on the protonated key residue. However, these forces are not colinear. Thus, distinct torques (depicted as white arc‐arrows) are generated on the two domains, promoting the C out‐to‐C in conformational change. A sliding hinge‐point (depicted as a red dot) is restricted to moving only on the inner surface of the lipid bilayer. The two statuses in the middle may be in equilibrium with each other (i.e. having a small differential free energy), which permits electroneutral transports.
Figure 4
Figure 4
King–Altman plot and energy landscape of antiporters. Panel A is the King–Altman plot of an ideal antiporter. Panels B and C are those of antiporters of H+‐leakage. Labels E and E* stand for transporters (enzymes) in the C Out and C In states, respectively; and S and H+ for substrate and proton, respectively. Functional cycles are shown in thick blue arrows. Futile cycles are shown in red arrows. Panel D is a schematic of the energy landscape of electrogenic transport of an ideal antiporter. Horizontal lines represent the different states. Tilted lines represent transitions between states. Green and blue arrows are associated with ΔµΨ and ΔµpH, respectively. Red arrows are associated with the chemical potential of the substrate. Purple lines and sand color polygons depict transition barriers. Subscripts L, R, D, and C stand for energy terms associated with loading, releasing, differential binding, and conformational change, respectively. The starting and ending states are identical, only differing by the release of heat (Q) during one transport cycle.
Figure A1
Figure A1
Analogy between the King–Altman plot of an antiporter and a linear electric circuit.

Similar articles

Cited by

References

    1. Li XZ, Plesiat P, Nikaido H (2015) The challenge of efflux‐mediated antibiotic resistance in Gram‐negative bacteria. Clin Microbiol Rev 28:337–418. - PMC - PubMed
    1. Paulsen IT, Brown MH, Skurray RA (1996) Proton‐dependent multidrug efflux systems. Microbiol Rev 60:575–608. - PMC - PubMed
    1. Higgins CF (2007) Multiple molecular mechanisms for multidrug resistance transporters. Nature 446:749–757. - PubMed
    1. Schindler BD, Kaatz GW (2016) Multidrug efflux pumps of Gram‐positive bacteria. Drug Resist Updates 27:1–13. - PubMed
    1. Zhang XC, Zhao Y, Heng J, Jiang D (2015) Energy coupling mechanisms of MFS transporters. Protein Sci 24:1560–1579. - PMC - PubMed

Publication types

LinkOut - more resources