

Investigating the cardiac pathology of SCO2-mediated hypertrophic cardiomyopathy using patients induced pluripotent stem cell-derived cardiomyocytes
- PMID: 29193756
- PMCID: PMC5783844
- DOI: 10.1111/jcmm.13392
Investigating the cardiac pathology of SCO2-mediated hypertrophic cardiomyopathy using patients induced pluripotent stem cell-derived cardiomyocytes
Abstract
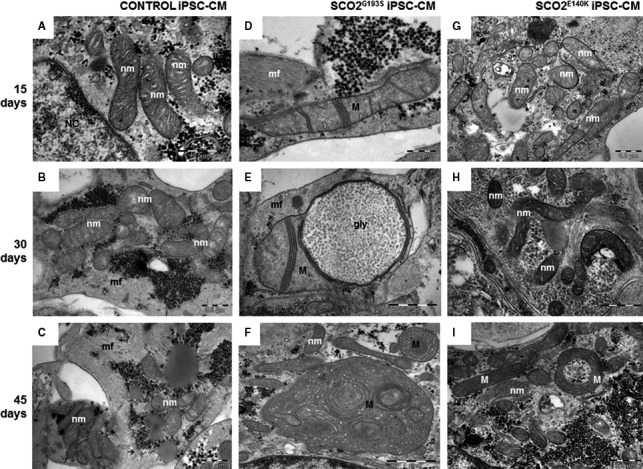
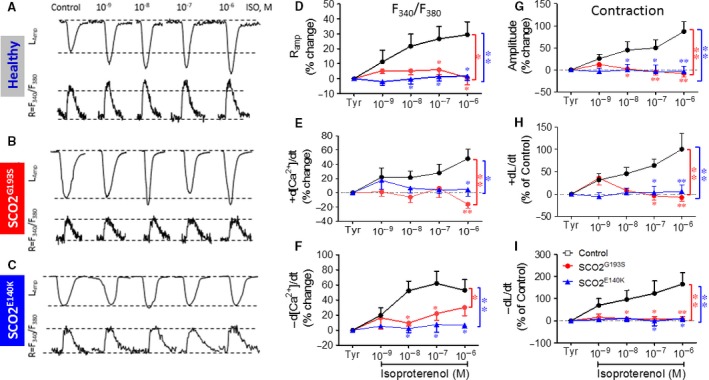
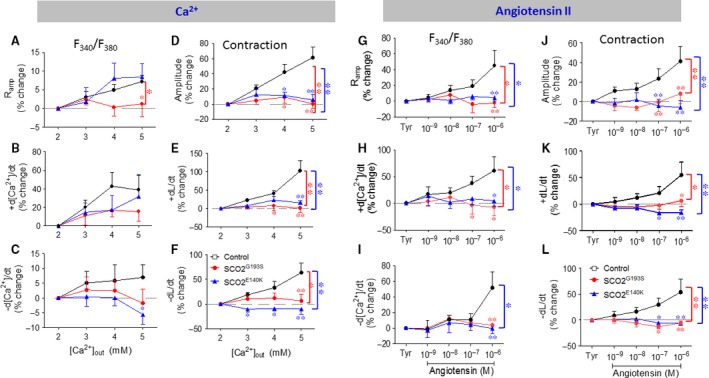
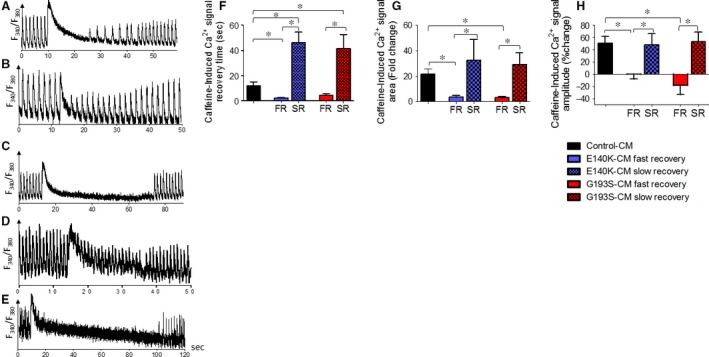
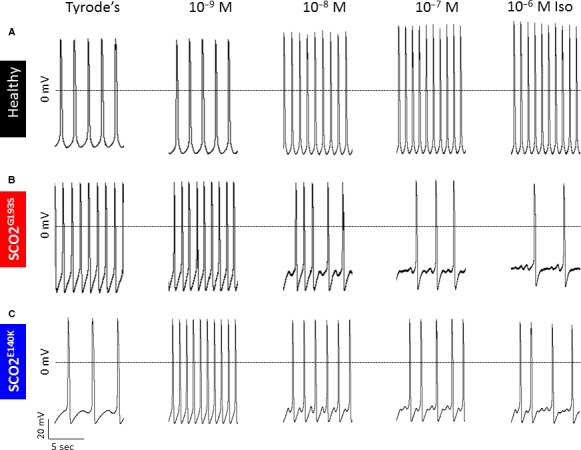
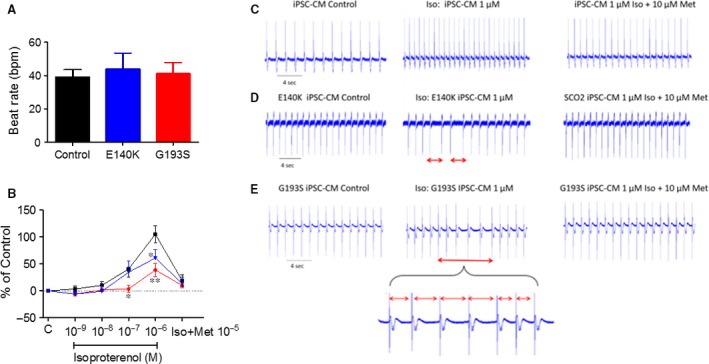
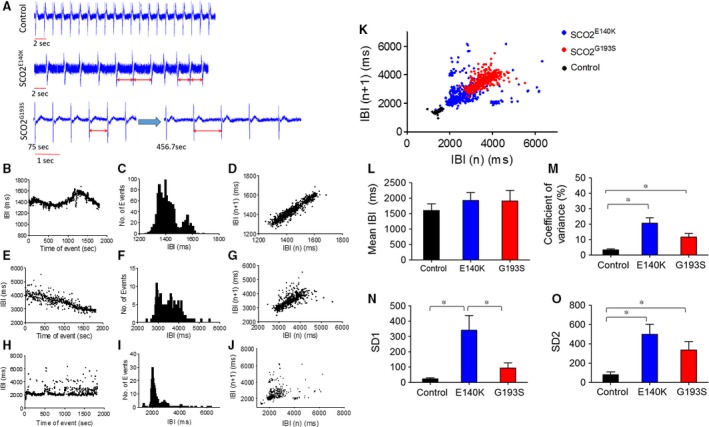
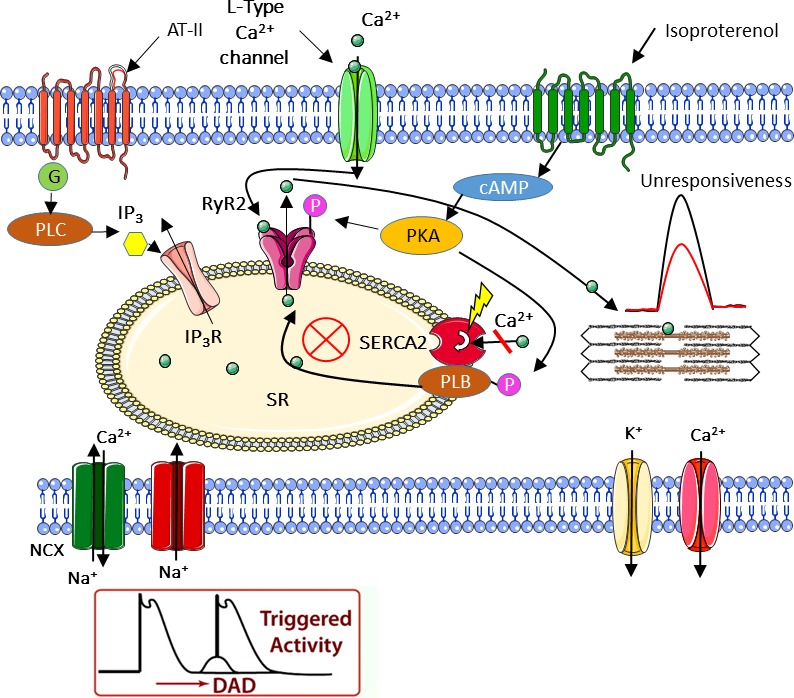
Mutations in SCO2 are among the most common causes of COX deficiency, resulting in reduced mitochondrial oxidative ATP production capacity, often leading to hypertrophic cardiomyopathy (HCM). To date, none of the recent pertaining reports provide deep understanding of the SCO2 disease pathophysiology. To investigate the cardiac pathology of the disease, we were the first to generate induced pluripotent stem cell (iPSC)-derived cardiomyocytes (iPSC-CMs) from SCO2-mutated patients. For iPSC generation, we reprogrammed skin fibroblasts from two SCO2 patients and healthy controls. The first patient was a compound heterozygote to the common E140K mutation, and the second was homozygote for the less common G193S mutation. iPSC were differentiated into cardiomyocytes through embryoid body (EB) formation. To test the hypothesis that the SCO2 mutation is associated with mitochondrial abnormalities, and intracellular Ca2+ -overload resulting in functional derangements and arrhythmias, we investigated in SCO2-mutated iPSC-CMs (compared to control cardiomyocytes): (i) the ultrastructural changes; (ii) the inotropic responsiveness to β-adrenergic stimulation, increased [Ca2+ ]o and angiotensin-II (AT-II); and (iii) the Beat Rate Variability (BRV) characteristics. In support of the hypothesis, we found in the mutated iPSC-CMs major ultrastructural abnormalities and markedly attenuated response to the inotropic interventions and caffeine, as well as delayed afterdepolarizations (DADs) and increased BRV, suggesting impaired SR Ca2+ handling due to attenuated SERCA activity caused by ATP shortage. Our novel results show that iPSC-CMs are useful for investigating the pathophysiological mechanisms underlying the SCO2 mutation syndrome.
Keywords: HCM; SCO2 mutation; [Ca2+]i transients and contractions; action potentials; arrhythmias; cardiomyocytes; iPSC.
© 2017 The Authors. Journal of Cellular and Molecular Medicine published by John Wiley & Sons Ltd and Foundation for Cellular and Molecular Medicine.
Figures

Similar articles
-
Induced Pluripotent Stem Cell-Derived Cardiomyocytes from a Patient with MYL2-R58Q-Mediated Apical Hypertrophic Cardiomyopathy Show Hypertrophy, Myofibrillar Disarray, and Calcium Perturbations.J Cardiovasc Transl Res. 2019 Oct;12(5):394-403. doi: 10.1007/s12265-019-09873-6. Epub 2019 Feb 22. J Cardiovasc Transl Res. 2019. PMID: 30796699
-
Functional abnormalities in iPSC-derived cardiomyocytes generated from CPVT1 and CPVT2 patients carrying ryanodine or calsequestrin mutations.J Cell Mol Med. 2015 Aug;19(8):2006-18. doi: 10.1111/jcmm.12581. Epub 2015 Jul 8. J Cell Mol Med. 2015. PMID: 26153920 Free PMC article.
-
Modelling diastolic dysfunction in induced pluripotent stem cell-derived cardiomyocytes from hypertrophic cardiomyopathy patients.Eur Heart J. 2019 Dec 1;40(45):3685-3695. doi: 10.1093/eurheartj/ehz326. Eur Heart J. 2019. PMID: 31219556 Free PMC article.
-
Characterization of cardiac metabolism in iPSC-derived cardiomyocytes: lessons from maturation and disease modeling.Stem Cell Res Ther. 2022 Jul 23;13(1):332. doi: 10.1186/s13287-022-03021-9. Stem Cell Res Ther. 2022. PMID: 35870954 Free PMC article. Review.
-
Modeling hypertrophic cardiomyopathy with human cardiomyocytes derived from induced pluripotent stem cells.Stem Cell Res Ther. 2022 Jun 3;13(1):232. doi: 10.1186/s13287-022-02905-0. Stem Cell Res Ther. 2022. PMID: 35659761 Free PMC article. Review.
Cited by
-
Modelling sarcomeric cardiomyopathies with human cardiomyocytes derived from induced pluripotent stem cells.J Physiol. 2020 Jul;598(14):2909-2922. doi: 10.1113/JP276753. Epub 2019 Feb 6. J Physiol. 2020. PMID: 30624779 Free PMC article. Review.
-
Recent Advances in Modeling Mitochondrial Cardiomyopathy Using Human Induced Pluripotent Stem Cells.Front Cell Dev Biol. 2022 Jan 10;9:800529. doi: 10.3389/fcell.2021.800529. eCollection 2021. Front Cell Dev Biol. 2022. PMID: 35083221 Free PMC article. Review.
-
INDUCED PLURIPOTENT STEM CELLS FOR MODELLING ENERGETIC ALTERATIONS IN HYPERTROPHIC CARDIOMYOPATHY.Cond Med. 2019;2(4):142-151. Cond Med. 2019. PMID: 32457935 Free PMC article.
-
Molecular Epidemiology of Mitochondrial Cardiomyopathy: A Search Among Mitochondrial and Nuclear Genes.Int J Mol Sci. 2021 May 27;22(11):5742. doi: 10.3390/ijms22115742. Int J Mol Sci. 2021. PMID: 34072184 Free PMC article. Review.
-
Mitochondrial Transfer Induced by Adipose-Derived Mesenchymal Stem Cell Transplantation Improves Cardiac Function in Rat Models of Ischemic Cardiomyopathy.Cell Transplant. 2023 Jan-Dec;32:9636897221148457. doi: 10.1177/09636897221148457. Cell Transplant. 2023. PMID: 36624995 Free PMC article.
References
-
- Holmgren D. Cardiomyopathy in children with mitochondrial disease Clinical course and cardiological findings. Eur Heart J. 2003; 24: 280–8. - PubMed
-
- Leary SC, Cobine PA, Kaufman BA, et al The human cytochrome c oxidase assembly factors SCO1 and SCO2 have regulatory roles in the maintenance of cellular copper homeostasis. Cell Metab. 2007; 5: 9–20. - PubMed
-
- Jaksch M, Ogilvie I, Yao J, et al Mutations in SCO2 are associated with a distinct form of hypertrophic cardiomyopathy and cytochrome c oxidase deficiency. Hum Mol Genet. 2000; 9: 795–801. - PubMed
Publication types
MeSH terms
Substances
LinkOut - more resources
Full Text Sources
Other Literature Sources
Molecular Biology Databases
Research Materials
Miscellaneous
