Review
. 2018 Mar;9(2):10.1002/wcs.1458.
doi: 10.1002/wcs.1458. Epub 2017 Nov 28.

Bayesian statistical approaches to evaluating cognitive models

Affiliations
Review

Bayesian statistical approaches to evaluating cognitive models

Jeffrey Annis et al. Wiley Interdiscip Rev Cogn Sci. 2018 Mar.

Abstract

Cognitive models aim to explain complex human behavior in terms of hypothesized mechanisms of the mind. These mechanisms can be formalized in terms of mathematical structures containing parameters that are theoretically meaningful. For example, in the case of perceptual decision making, model parameters might correspond to theoretical constructs like response bias, evidence quality, response caution, and the like. Formal cognitive models go beyond verbal models in that cognitive mechanisms are instantiated in terms of mathematics and they go beyond statistical models in that cognitive model parameters are psychologically interpretable. We explore three key elements used to formally evaluate cognitive models: parameter estimation, model prediction, and model selection. We compare and contrast traditional approaches with Bayesian statistical approaches to performing each of these three elements. Traditional approaches rely on an array of seemingly ad hoc techniques, whereas Bayesian statistical approaches rely on a single, principled, internally consistent system. We illustrate the Bayesian statistical approach to evaluating cognitive models using a running example of the Linear Ballistic Accumulator model of decision making (Brown SD, Heathcote A. The simplest complete model of choice response time: linear ballistic accumulation. Cogn Psychol 2008, 57:153-178). WIREs Cogn Sci 2018, 9:e1458. doi: 10.1002/wcs.1458 This article is categorized under: Neuroscience > Computation Psychology > Reasoning and Decision Making Psychology > Theory and Methods.


Figures

Figure 1
Figure 1
The Linear Ballistic Accumulator (LBA) model is an example of a formal cognitive model that predicts response probabilities and distributions of response times. LBA can be used to decompose response time and accuracy into core cognitive parameters: evidence accumulation, response caution, perceptual encoding. LBA assumes that after the stimulus is perceptually encoded after time τ, evidence towards each response alternative, i, accumulates with drift rate di. Drift rates across trials are sampled from normal distributions with mean vi and standard deviation s. In our examples, we constrain mean drift rate for the Response B accumulator to be 1 minus mean drift rate for the Response A accumulator. The starting point of the evidence accumulation process on each is sampled from a uniform distribution between 0 and a. The response is determined by the first accumulator to reach threshold a+k.
Figure 2
Figure 2
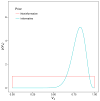
Prior distributions represent our subjective a priori beliefs about parameter values. This figure illustrates two different prior distributions chosen for vA in the LBA model, which in one common instantiation is constrained to fall between 0 and 1. Both priors are beta distributions with different shapes (controlled by the rate parameter α and the shape parameter β of the beta). When α = β, the beta distribution is mathematically equivalent to the uniform distribution, depicted in red. This prior is noninformative because it represents the belief that all values of vA are equally likely. Depicted in blue is a beta distribution with α = 5 and β = 20 and represents the prior belief that relatively large values of vA are more likely than relatively small values. This prior is informative because we have concentrated a large amount of mass over a relatively small range of parameter values.
Figure 3
Figure 3
Panel A plots the path of the Markov chain for τ and vA. The chain begins in low density region around τ = .2 and vA = .2 and quickly moves to a higher density region as per the Metropolis acceptance probability ratio. Panel B (below Panel A) shows the resulting samples drawn from the joint posterior distribution of τ and vA, excluding the first 100 samples as burn-in. Panel C shows the path the chain took over the marginal distribution for vA at each iteration of the algorithm. The resulting marginal distribution is plotted below in Panel D. The path of the chain over the marginal distribution of τ and the resulting samples are shown in Panels E and F, respectively.
Figure 4
Figure 4
Shows the predictive distribution for each of several posterior samples (black lines) and the overall posterior predictive distribution (red line) plotted against the response time distribution simulated from the LBA (histogram bars).
Figure 5
Figure 5
Graphical depiction of the Savage-Dickey ratio test. The dotted line is the prior placed on the effect size and solid line is posterior. The black dots represent the height of the prior and posterior when the effect size is 0. The ratio of these heights is the Bayes factor, the weight of the evidence. The height of the posterior at zero is 178 times less than the prior at zero, indicating the data have decreased our belief in the effect size being zero by a factor of 178.

References

    1. Brown SD, Heathcote A. The simplest complete model of choice response time: Linear ballistic accumulation. Cogn Psychol. 2008;57:153–78. - PubMed
    1. Lewandowsky S, Farrel S. Computational modeling in cognition: Principles and practice. Thousand Oaks, CA: Sage Publications; 2011.
    1. Ratcliff R, Smith PL. A comparison of sequential sampling models for two-choice reaction time. Psychol Rev. 2004;111:333–67. - PMC - PubMed
    1. Nosofsky RM. Exemplar-based approach to relating categorization, identification, and recognition. In: Ashby G, editor. Multidimensional Models of Perception and Cognition. Hillsdale, NJ: LE; 1992. pp. 363–94. http://psycnet.apa.org/psycinfo/1992-98026-014.
    1. Richler JJ, Palmeri TJ. Visual category learning. Wiley Interdiscip Rev Cogn Sci. 2014;5:75–94. - PubMed

LinkOut - more resources