. 2018 Jan;26(1):213-222.
doi: 10.1002/oby.22075. Epub 2017 Nov 28.

Genetic Fine-Mapping and Identification of Candidate Genes and Variants for Adiposity Traits in Outbred Rats

Affiliations

Genetic Fine-Mapping and Identification of Candidate Genes and Variants for Adiposity Traits in Outbred Rats

Gregory R Keele et al. Obesity (Silver Spring). 2018 Jan.

Abstract

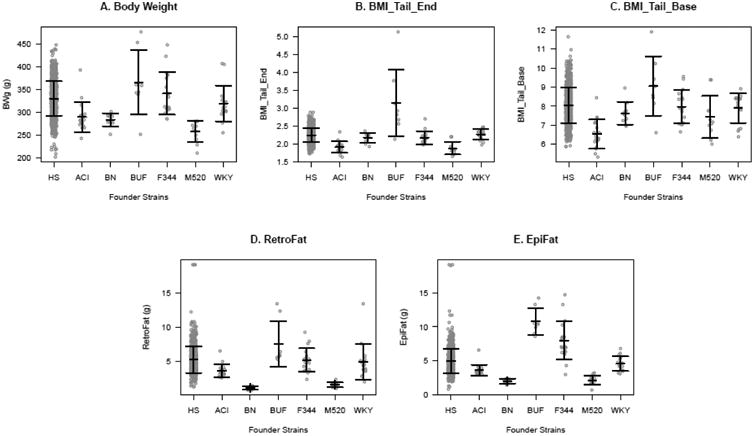
Objective: Obesity is a major risk factor for multiple diseases and is in part heritable, yet the majority of causative genetic variants that drive excessive adiposity remain unknown. Here, outbred heterogeneous stock (HS) rats were used in controlled environmental conditions to fine-map novel genetic modifiers of adiposity.

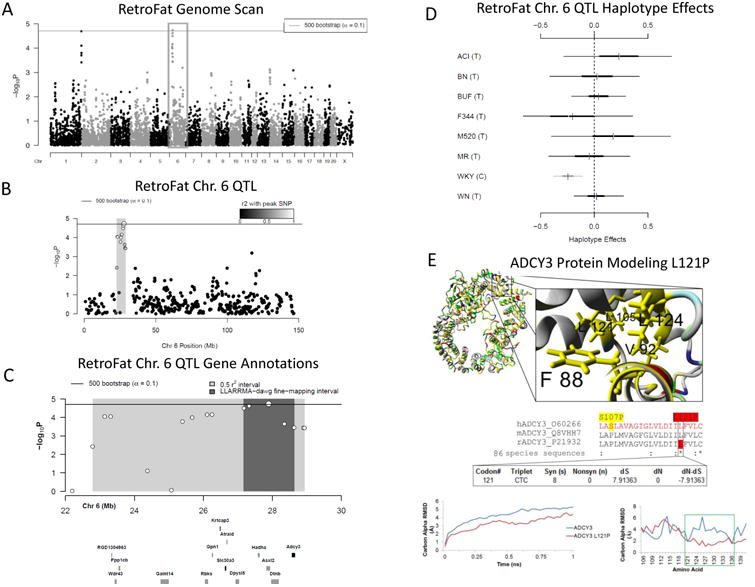
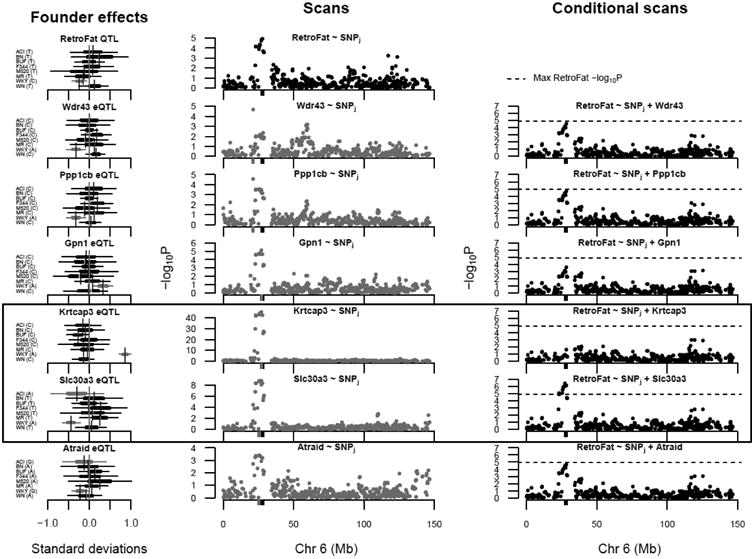
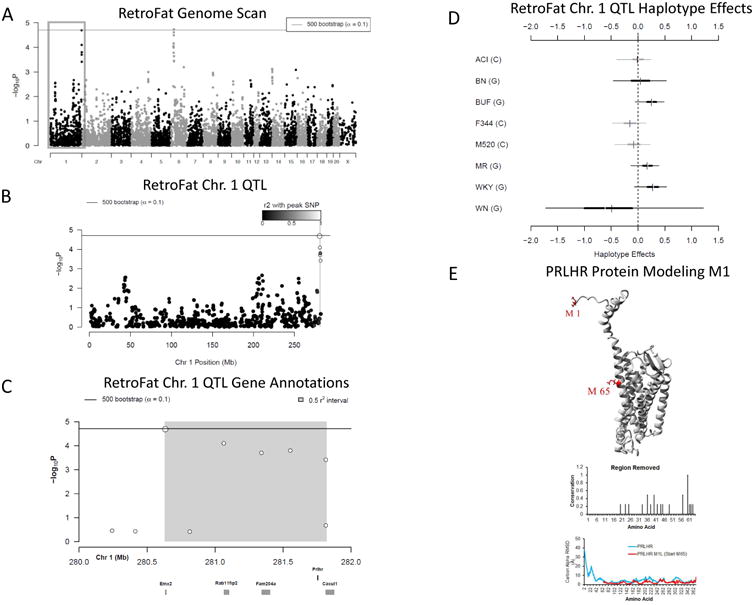
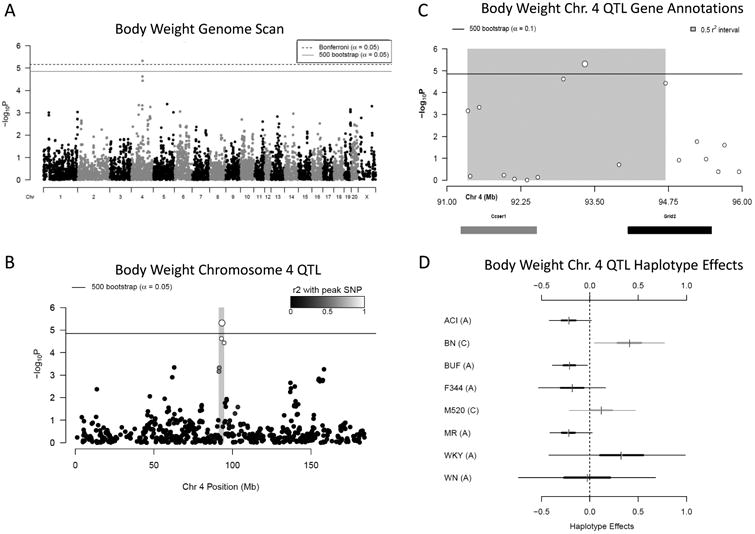
Methods: Body weight and visceral fat pad weights were measured in male HS rats that were also genotyped genome-wide. Quantitative trait loci (QTL) were identified by genome-wide association of imputed single-nucleotide polymorphism (SNP) genotypes using a linear mixed effect model that accounts for unequal relatedness between the HS rats. Candidate genes were assessed by protein modeling and mediation analysis of expression for coding and noncoding variants, respectively.

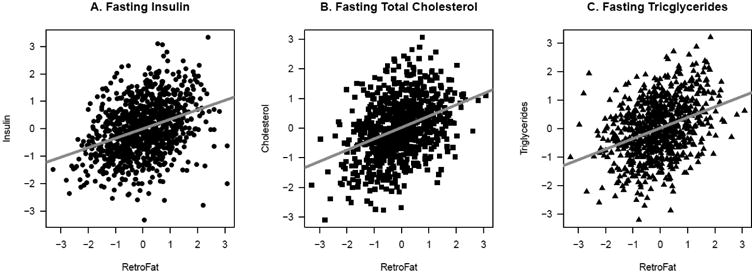
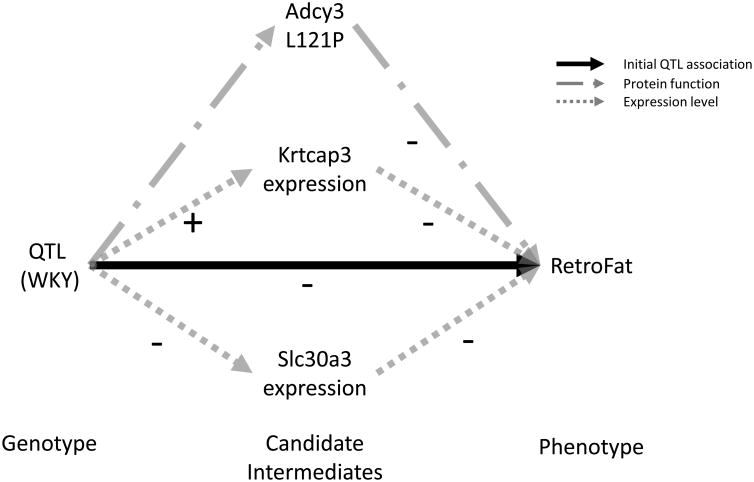
Results: HS rats exhibited large variation in adiposity traits, which were highly heritable and correlated with metabolic health. Fine-mapping of fat pad weight and body weight revealed three QTL and prioritized five candidate genes. Fat pad weight was associated with missense SNPs in Adcy3 and Prlhr and altered expression of Krtcap3 and Slc30a3, whereas Grid2 was identified as a candidate within the body weight locus.

Conclusions: These data demonstrate the power of HS rats for identification of known and novel heritable mediators of obesity traits.


Conflict of interest statement

Conflicts of interest statement: The authors have no conflicts of interest.

Figures

Figure 1
Figure 1
Adiposity traits in inbred founders and HS rats. Mean + SD are shown. BMI is body mass index from nose to end of tail (BMI_Tail_End) and from nose to base of the tail (BMI_Tail_Base). EpiFat and RetroFat are epididymal and retroperitoneal fat pad weight, respectively. Gray circles represent individual animals from 8-19 individuals from 6 of the founder strains, and the HS rats (989 in body weight; 741 in RetroFat, EpiFat, and BMI_Tail_End; and 740 in BMI_Tail_Base). See text for statistical differences between founder strains.
Figure 2
Figure 2
Significant correlations between RetroFat (retroperitoneal fat pad weight) and A) fasting insulin (p = 4.75e-27), B) fasting total cholesterol (p = 1.02e-20) and C) fasting triglycerides (p = 2.55e-20) in HS rats. Plots show the residuals of rank-inverse normal transformed phenotypes with nuisance factors regressed out to restrict correlation estimates to that between RetroFat and these metabolic traits. Significant correlations were also found between RetroFat and several other measures of metabolic health (see Table 1).
Figure 3
Figure 3
A) Genome scan of RetroFat. X-axis is position on chromosome and y-axis is the −logP level of association. Genome-wide significance thresholds were calculated using parametric bootstraps from the null model (α = 0.1, logP = 4.70). B) The grey region highlights the 6.14 LD support interval of the chromosome 6 QTL showing neighboring markers that are correlated with the peak marker, representing genomic regions likely to contain the causal variant underlying the statistical signal. C) Annotation of genes that fall within the support interval. The entire 6.14 region is shaded in grey, with the fine-mapped 1.46 Mb region shaded in dark grey. Only genes that have a cis eQTL are shown. All 130 genes within the region are listed in Supplementary Table S1. D) Additive haplotype effects were estimated using the Diploffect model, which takes into account uncertainty in haplotype state. SNP allele information is overlaid on the haplotype effects, and are distinguished by black or gray. The WKY haplotype, the only haplotype with the C allele at the chromosome 6 locus, has a significantly negative effect on phenotype. E) Protein modeling for ADCY3. Variant L121P of ADCY3 is found with the conserved hydrophobic core of the transmembrane helices. A zoomed in view is shown to the right. The middle panel shows sequence alignments of amino acids. ADCY3 amino acid 121 is also 100% conserved (red) as a leucine in 86 analyzed vertebrate species. A human SNP is known at amino acid 107 (yellow). Using the DNA information from the 86 nucleotide sequences for ADCY3, there is also evidence of selective pressure in the DNA sequence to conserve the amino acid. Bottom panel shows molecular dynamic simulations for ADCY3. Simulations performed on the protein dimer for wild type (WT blue) or the mutant (ADCY3 L121P, red) suggests that the models' average movement over time is altered. Altered movement is seen in the simulations for ADCY3 with fluctuation of amino acids found near amino acid 121 when mutated.
Figure 4
Figure 4
Mediation analysis identified the expression levels of six genes (Wdr43, Ppp1cb, Gpn1, Krtcap3, Slc30a3, and Atraid;Table S5) in the RetroFat chromosome 6 QTL interval as potential mediators of the QTL effect on the phenotype. [Middle column] Comparisons of the RetroFat chromosome 6 association scan with association scans for the potential mediators reveals them to likely have co-localizing cis eQTL with the RetroFat QTL. [Left column] The haplotype effects on RetroFat at the QTL and on the mediators at the eQTL reveals that in this region, the WKY haplotype is largely driving the differences in RetroFat and mediator gene expression, suggesting a possible connection between RetroFat and local gene expression. [Right column] RetroFat chromosome 6 association scans, conditioned on candidate gene expression, is consistent with the mediation analysis finding that Krtcap3 is a strong candidate as full mediator of the effect of QTL on RetroFat. When Krtcap3 expression is included in the model, the QTL is largely removed. Slc30a3, as a potential suppressor of the QTL effect on RetroFat, actually increases the significance seen at the QTL.
Figure 5
Figure 5
Model demonstrating role of Adcy3, Krtcap3 and Slc30a3 on RetroFat. WKY haplotype increases expression of Krtcap3, which is itself negatively correlated with RetroFat (Figure S4), and thus the causal path is consistent with the negative WKY effect on RetroFat at the locus. In contrast, WKY decreases expression of Slc30a3, which is also negatively correlated RetroFat, suggesting Slc30a3 is a suppressor of the QTL/Krtcap3 effect. Finally, the non-synonymous variant with Adcy3 causes amino acid change L121P leading to lower RetroFat.
Figure 6
Figure 6
A) Genome scan of RetroFat as described in Figure 3A. B) The grey region highlights the 1.19 Mb LD support interval for the chromosome 1 locus representing neighboring markers that are correlated with the peak marker, representing genomic regions likely to contain the causal variant underlying the statistical signal. C) Annotation of the five characterized genes that fall within the support interval. D) Additive founder haplotype effects for the chromosome 1 RetroFat locus. Additive haplotype effects were estimated using the Diploffect model, which takes into account uncertainty in haplotype state. SNP allele information is also overlaid on the haplotype effects. The C allele is shared by ACI, F344, and M520, that possesses a variant with a negative effect on RetroFat, whereas BUF, MR and WKY haplotypes result in increased RetroFat at this locus. E) Protein modeling for PRLHR. Variant M1I of PRLHR is found within the methionine start site. The next start site is at position 65 leading to removal of the conserved N-terminal region and half of transmembrane helix 1. 16 amino acids removed are under selective pressure (middle panel) and the deletion of the first 64 amino acids causes a destabilization of the entire proteins dynamics as seen by the molecular dynamic simulations (bottom panel).
Figure 7
Figure 7
A) Genome scan of body weight. X-axis is position on chromosome and y-axis is the −logP level of association. Genome-wide significance thresholds were calculated using parametric bootstraps from the null model (significant: α = 0.05, logP = 4.86) and conservative α = 0.05 Bonferroni thresholds (logP = 5.16). B) Linkage disequilibrium support interval in grey is 3.35 Mb. C) Annotation of the two characterized genes that fall within the support interval. D) Additive haplotype effects for chromosome 4 body weight QTL. The C allele at the marker could represent shared haplotype descent between BN and M520, both which have an increasing effect on body weight at this locus. ACI, BUF, F344 and MR haplotypes have a decreasing effect of body weight at this locus, all of which share the A allele. The WKY and WN also have an A allele and the WKY haplotype has an increasing effect on body weight, while the WN haplotype appears not to effect body weight, although the credible interval of both is fairly large and not well represented in the data at this locus.

References

    1. Wang YC, et al. Health and economic burden of the projected obesity trends in the USA and the UK. Lancet. 2011;378(9793):815–25. - PubMed
    1. Emdin CA, et al. Genetic Association of Waist-to-Hip Ratio With Cardiometabolic Traits, Type 2 Diabetes, and Coronary Heart Disease. JAMA. 2017;317(6):626–634. - PMC - PubMed
    1. Stunkard AJ, Foch TT, Hrubec Z. A twin study of human obesity. Jama. 1986;256(1):51–4. - PubMed
    1. Katzmarzyk PT, et al. Familial resemblance in fatness and fat distribution. Am J Hum Biol. 2000;12(3):395–404. - PubMed
    1. Locke AE, et al. Genetic studies of body mass index yield new insights for obesity biology. Nature. 2015;518(7538):197–206. - PMC - PubMed

LinkOut - more resources