Case Reports
. 2018 Jan;6(1):77-91.
doi: 10.1002/mgg3.350. Epub 2017 Nov 30.

Somatic mosaicism of an intragenic FANCB duplication in both fibroblast and peripheral blood cells observed in a Fanconi anemia patient leads to milder phenotype

Affiliations
Case Reports

Somatic mosaicism of an intragenic FANCB duplication in both fibroblast and peripheral blood cells observed in a Fanconi anemia patient leads to milder phenotype

Rajalakshmi S Asur et al. Mol Genet Genomic Med. 2018 Jan.

Abstract

Background: Fanconi anemia (FA) is a rare disorder characterized by congenital malformations, progressive bone marrow failure, and predisposition to cancer. Patients harboring X-linked FANCB pathogenic variants usually present with severe congenital malformations resembling VACTERL syndrome with hydrocephalus.

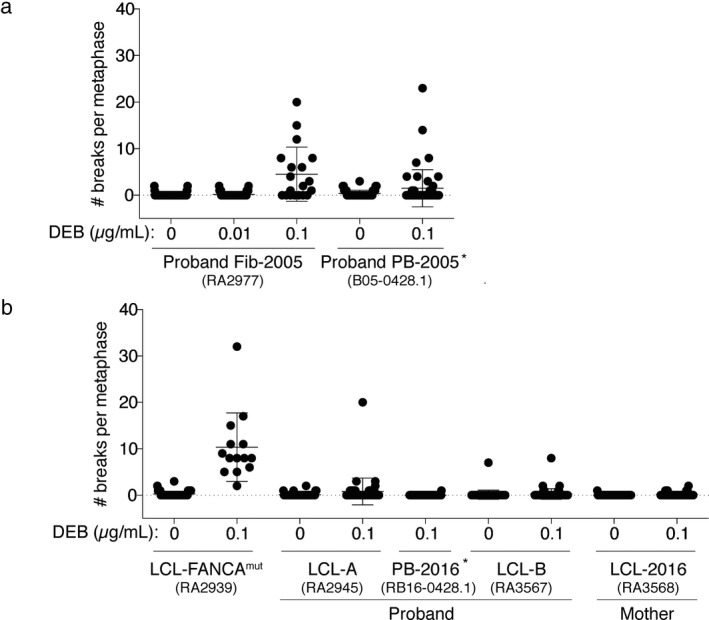
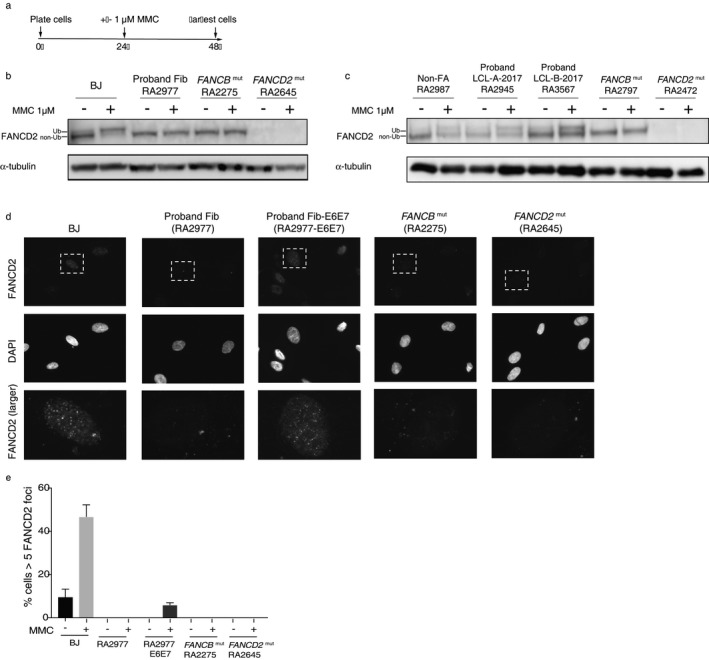
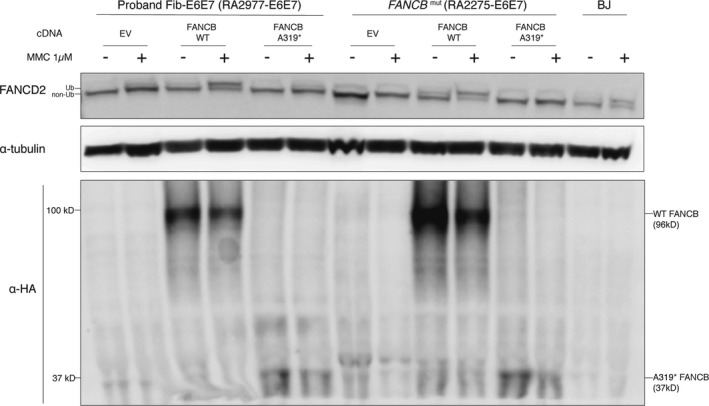
Methods: We employed the diepoxybutane (DEB) test for FA diagnosis, arrayCGH for detection of duplication, targeted capture and next-gen sequencing for defining the duplication breakpoint, PacBio sequencing of full-length FANCB aberrant transcript, FANCD2 ubiquitination and foci formation assays for the evaluation of FANCB protein function by viral transduction of FANCB-null cells with lentiviral FANCB WT and mutant expression constructs, and droplet digital PCR for quantitation of the duplication in the genomic DNA and cDNA.

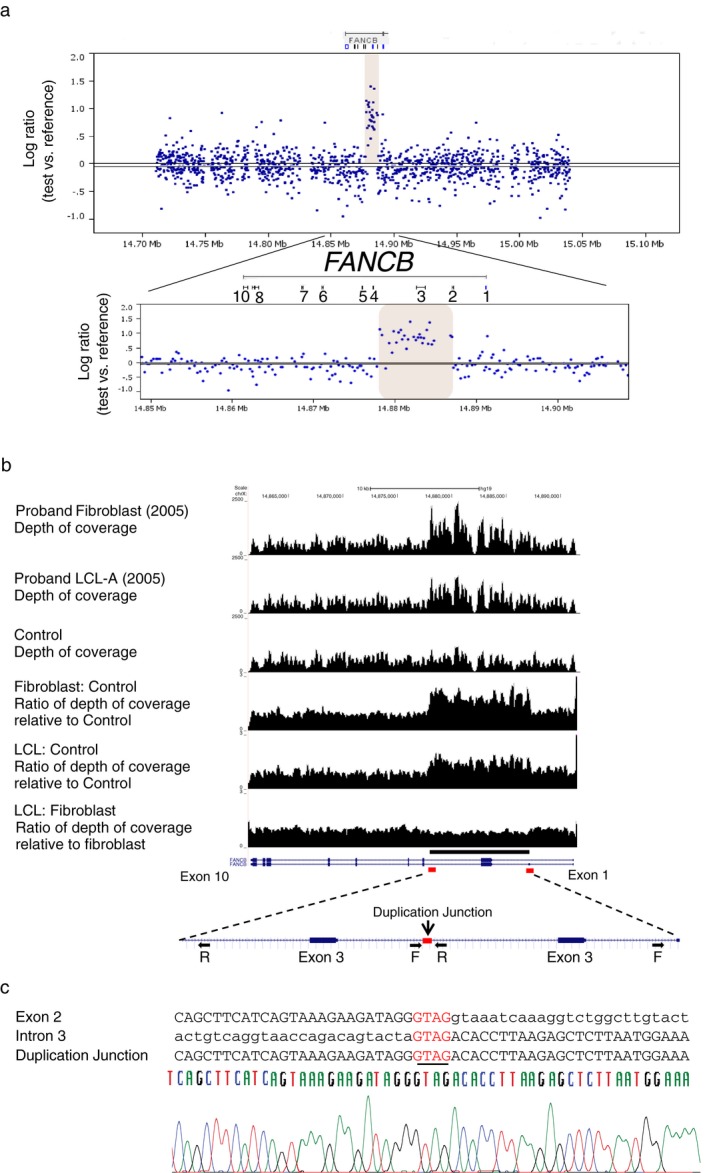
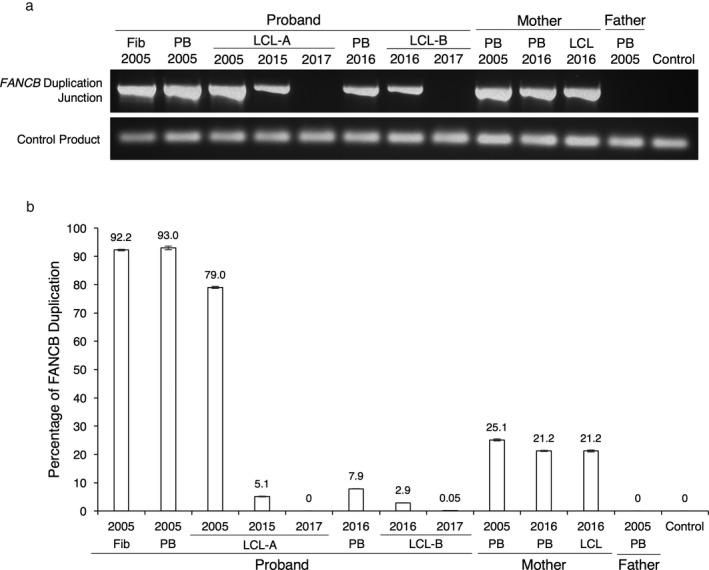
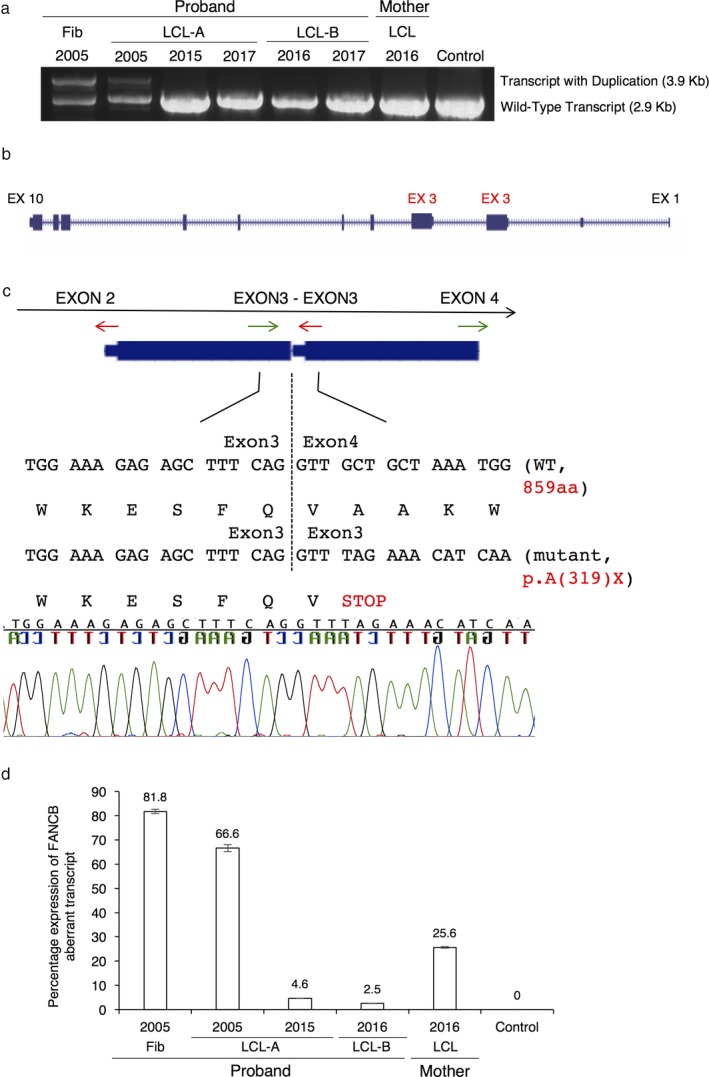
Results: We describe here an FA-B patient with a mild phenotype. The DEB diagnostic test for FA revealed somatic mosaicism. We identified a 9154 bp intragenic duplication in FANCB, covering the first coding exon 3 and the flanking regions. A four bp homology (GTAG) present at both ends of the breakpoint is consistent with microhomology-mediated duplication mechanism. The duplicated allele gives rise to an aberrant transcript containing exon 3 duplication, predicted to introduce a stop codon in FANCB protein (p.A319*). Duplication levels in the peripheral blood DNA declined from 93% to 7.9% in the span of eleven years. Moreover, the patient fibroblasts have shown 8% of wild-type (WT) allele and his carrier mother showed higher than expected levels of WT allele (79% vs. 50%) in peripheral blood, suggesting that the duplication was highly unstable.

Conclusion: Unlike sequence point variants, intragenic duplications are difficult to precisely define, accurately quantify, and may be very unstable, challenging the proper diagnosis. The reversion of genomic duplication to the WT allele results in somatic mosaicism and may explain the relatively milder phenotype displayed by the FA-B patient described here.

Keywords: FANCB; droplet digital PCR; intragenic duplication; milder phenotype; revertant mosaicism.


Figures

Figure 1
Figure 1
Results of chromosome breakage with and without DEB. (a) Results of clinical testing. Proband fibroblasts (Fib‐2005) and PB‐2005 were tested as part of the original diagnosis in the year 2005. (b) Results of research testing performed in 2017 on the proband's LCL from 2005 (LCL‐A) and 2016 (LCL‐B), as well as the proband's peripheral blood drawn in 2016 (PB‐2016). The FANCA mut LCL represents the typical DEB test results from the LCL of a patient with FA and the mother's LCL (LCL‐2016) was included as a healthy control. The details of the breakage test results are shown in Table S1 Asterisks indicated that the test was done on a separate date even though it is shown on the same graph
Figure 2
Figure 2
Detection and sequencing of duplication breakpoint. (a) ArrayCGH of DNA from proband's fibroblasts. Differential hybridization data obtained from the hybridization of genomic DNA from proband fibroblasts against a male reference DNA on a custom designed CGH array. The Log2 ratio of the signal intensity from test versus reference DNA is shown on the y‐axis, and X‐ axis shows the entire FANCB gene region. Increased signal intensity from proband DNA (expanded at the bottom), around exon 3 indicates duplication of this ~10 kb region in FANCB (NM_001018113.2). (b) Targeted capture and next‐gen sequencing (NGS) of the FANCB gene region. Targeted capture/sequencing of genomic DNA shows increased number of reads for the duplicated region (chrX:14877976‐14887129 or chrX:14877972‐14887133) in the proband fibroblast and LCL‐A‐2005, compared to a control DNA (top 3 tracks). The ratio of depth of coverage (bottom 3 tracks) confirms the duplicated region. Discordant reads at the region of duplication showed a tandem intragenic duplication of 9154 bp in FANCB, head to tail, in the same orientation and is expanded at the bottom of the hg tracks for FANCB. The red rectangular boxes indicate a shared homology of four bases (GTAG) at both ends of the breakpoint region, but only one in the duplicated region. (c) Sequence alignment of the FANCB duplication junction. The sequence alignment of the breakpoint junction, along with the sequence of the exon 2 and intron 3, the two ends of the duplication are shown here. The sequence at the junction suggested a microhomology‐mediated duplication event leading to the disease
Figure 3
Figure 3
Evaluation of gDNA by PCR to show the presence of the unique duplication junction in the proband and the mother. (a) PCR of FANCB duplication junction. DNA samples from the patient, mother, father, and control were tested for the presence of the breakpoint junction. Presence of the duplication in the mother's as well as the proband's DNA was observed. The top panel represents the 702 bp PCR product of the FANCB duplicated region. The bottom panel represents a 91 bp PCR product from the FANCB intron 1 (control) amplification. Fib refers to Fibroblast DNA and PB refers to peripheral blood DNA. LCL‐A was established from the patient's PB‐2005, and DNA was collected from the LCL at that time (LCL‐A‐2005). This cell line was subsequently grown at different times in 2015 and 2017. LCL‐B was established from the patient's PB‐2016, and DNA was collected at that time (LCL‐B‐2016). This cell line was grown again in 2017 and DNA was collected (LCL‐B‐2017). (b) Copy Number Variance Analysis of FANCB duplication in gDNA using ddPCR. Standard errors are barely visible as they do not exceed ±0.63%; n = 9 observations per sample. The copy number variance was evaluated by performing ddPCR with probes specific for the FANCB genomic DNA duplication junction region, and a two‐copy reference gene. The variability in the extent of duplication in DNA from proband supports mosaicism. The extent of duplication in DNA from mother is <50% indicating mosaicism in her DNA as well
Figure 4
Figure 4
Evaluation of the consequence of duplication on the FANCB transcript. (a) RTPCR product of full‐length FANCB (NM_001018113.2) transcript in the proband, mother and control cells. The primers amplified a 2.9 kb FANCB transcript and a larger (3.9 kb) transcript with the duplication. Proband's cells, particularly the LCL‐A‐2005 and Fib‐2005, showed a larger transcript in addition to the WT transcript. (b) PacBio sequencing of the larger transcript. The sequences from the larger transcript, aligned to the reference genome modified to accommodate exon 3 duplication, indicate the duplicated exon 3 is now part of the aberrant transcript. (c) Diagram showing the unique FANCB exon 3‐exon 3 duplication junction. RTPCR and sequencing of the exon 3‐exon 3 junction region in the transcript with the duplication reveals a stop codon at the beginning of the junction. Primers (red and green arrows) were designed to amplify a unique 187 bp junction product from cDNA template. The transcript sequence predicts translation termination in close proximity to the junction. (d) The RNA from fibroblasts and LCL were evaluated by RTPCR followed by ddPCR quantitation, with probes specific for the aberrant FANCB message (probe for the exon 3‐exon 3 duplication junction region), and WT FANCB transcript (probe for the exon 4‐exon 5 junction). The percentage of aberrant transcript compared to the total FANCB transcript is presented. Vertical bars represent the standard error of the measurements; n = 3 separate observations performed in triplicate (total of nine data points) for each sample
Figure 5
Figure 5
Functional assessment of Fanconi anemia pathway. (a) The experimental scheme for MMC treatment. Twenty‐four hours after plating, cells were cultured with or without MMC 1 μM for an additional 24 hr, after which the cells were harvested for western blot or immunostaining. (b) Western blot with FANCD2 antibody of BJ, proband fibroblasts, FANCB mutant (null) fibroblasts and FANCD2 mutant (null) fibroblasts. (c) Western blot with FANCD2 antibody of non‐FA control lymphoblasts (LCL), proband LCL‐A‐2017, proband LCL‐B‐2017, FANCB mutant (null) LCL, and FANCD2 mutant (null) LCL. (d) Representative figures of FANCD2 foci formation in the indicated cells. (e) Quantification of FANCD2 foci formation following treatment with or without 1 μM MMC. Experiments were performed in triplicate. One hundred cells were counted for each experiment
Figure 6
Figure 6
Functional evaluation of FANCB WT and mutant cDNA. Proband fibroblasts, FANCB mutant (null) fibroblasts and BJ control fibroblasts were HPV16 E6E7 transformed. Either empty vector, wild‐type FANCB cDNA, or mutant FANCB cDNA (p.A319*) was introduced into proband fibroblasts and FANCB mutant (null) fibroblasts. After puromycin selection, cells were cultured with or without MMC 1 μM for 24 hr, after which cells were harvested for the FANCD2 and HA western blot assays

References

    1. Alter, B. P. , & Rosenberg, P. S. (2013). VACTERL‐H Association and Fanconi Anemia. Molecular Syndromology, 4(1–2), 87–93. - PMC - PubMed
    1. Auerbach, A. D. (2009). Fanconi anemia and its diagnosis. Mutation Research, 668(1–2), 4–10. https://doi.org/10.1016/j.mrfmmm.2009.01.013 - DOI - PMC - PubMed
    1. Auerbach, A. D . (2015). Diagnosis of Fanconi anemia by diepoxybutane analysis. Current Protocols in Human Genetics, 85, 8.7.1–17. - PMC - PubMed
    1. Biesecker, L. G. , & Spinner, N. B. (2013). A genomic view of mosaicism and human disease. Nature Reviews Genetics, 14(5), 307–320. https://doi.org/10.1038/nrg3424 - DOI - PubMed
    1. Chandrasekharappa, S. C. , Lach, F. P. , Kimble, D. C. , Kamat, A. , Teer, J. K. , Donovan, F. X. , … Smogorzewska, A . (2013). Massively parallel sequencing, aCGH, and RNA‐Seq technologies provide a comprehensive molecular diagnosis of Fanconi anemia. Blood, 121(22), e138–e148. https://www.ncbi.nlm.nih.gov/books/NBK1401/. https://doi.org/10.1182/blood-2012-12-474585 - DOI - PMC - PubMed

Publication types

Substances

LinkOut - more resources