. 2018 Feb 28;46(4):1710-1723.
doi: 10.1093/nar/gkx1207.

BmILF and i-motif structure are involved in transcriptional regulation of BmPOUM2 in Bombyx mori

Affiliations

BmILF and i-motif structure are involved in transcriptional regulation of BmPOUM2 in Bombyx mori

Kangkang Niu et al. Nucleic Acids Res. .

Abstract

Guanine-rich and cytosine-rich DNA can form four-stranded DNA secondary structures called G-quadruplex (G4) and i-motif, respectively. These structures widely exist in genomes and play important roles in transcription, replication, translation and protection of telomeres. In this study, G4 and i-motif structures were identified in the promoter of the transcription factor gene BmPOUM2, which regulates the expression of the wing disc cuticle protein gene (BmWCP4) during metamorphosis. Disruption of the i-motif structure by base mutation, anti-sense oligonucleotides (ASOs) or inhibitory ligands resulted in significant decrease in the activity of the BmPOUM2 promoter. A novel i-motif binding protein (BmILF) was identified by pull-down experiment. BmILF specifically bound to the i-motif and activated the transcription of BmPOUM2. The promoter activity of BmPOUM2 was enhanced when BmILF was over-expressed and decreased when BmILF was knocked-down by RNA interference. This study for the first time demonstrated that BmILF and the i-motif structure participated in the regulation of gene transcription in insect metamorphosis and provides new insights into the molecular mechanism of the secondary structures in epigenetic regulation of gene transcription.


Figures

Figure 1.
Figure 1.
PCR amplification of the promoter sequence of BmPOUM2 at different reaction conditions. (A) PCR reaction in the presence of 0, 5 and 8% DMSO. The faster migrating small bands are the non-target PCR products, non-specifically amplified. (B) The DMSO dose-dependent PCR assay with 0–10% (v/v) of DMSO in the PCR reaction mix. (C) The effect of denaturation temperatures on the amplification of PCR product without DMSO. (D) The effect of denaturation time on the amplification of PCR product. The denaturation temperatures kept at 94 or 95°C and the denaturation time were kept for 0.5 or 1.0 min. The general PCR conditions are described in Materials and Methods. The arrow shows the targeted PCR product.
Figure 2.
Figure 2.
Identification of the G4 and i-motif structures in the promoter region of the BmPOUM2 gene. (A) The nucleotide sequence of the promoter region of the BmPOUM2 gene. The G and C bases are shown in red. (B) CD analysis of the +1 to –237 nts region of the promoter truncated into three fragments with or without 100 mM KCl. (C) Comparison of the G4 region of the BmPOUM2 promoter and some reported G4-containing sequences predicted by the QGRS Mapper. (D) CD analysis of the forward ssDNA of the –88 to –127 nts region of the promoter in absence or presence of 100 mM KCl. The mutated nucleotides are shown in the mutant sequence. F-WT: forward wild type strand; F-Mut: forward mutated strand. (E) CD analysis of the reverse ssDNA of the –88 to –127 nts region of the promoter at pH 4.1 and 8.0. The mutated nucleotides are shown in the mutant sequence. R-WT: reverse wild type strand; R-Mut: reverse mutated strand.
Figure 3.
Figure 3.
Effects of mutation and ASOs on the promoter activity of BmPOUM2. (A) Determination of the activity of the BmPOUM2 wild-type or mutated promoter by the luciferase assay. WT, wild-type; Mut, mutant; EV, empty vector. (B) Descriptive diagram of the principle of ASO assay. In normal conditions, the dsDNA was unwound to ssDNA and the G-rich and C-rich ssDNA fold to form G4 and i-motif structures, respectively (a); when the excessive ASOs of the G4 or i-motif were added, the G4 or i-motif would be inhibited (b). (C) Effect of ASOs interfering assay on the BmPOUM2 promoter activity. Non-specific-ssDNA: non-specific single-stranded DNA was used as a control. WT-ASO-i-motif and Mut-ASO-i-motif: wild-type and mutated complementary anti-sense oligonucleotides of i-motif. WT-ASO-G4 and Mut-ASO-G4: wild-type and mutated complementary anti-sense oligonucleotides of G4. F-ASO-Bmβ-actin and R-ASO-Bmβ-actin: complementary anti-sense oligonucleotides of reverse and forward strand. Data is means ± SEM (n = 3). ***P < 0.001 (Student's t test).
Figure 4.
Figure 4.
Effects of TMPyP4 and TMPyP2 on the i-motif structure and promoter activity of BmPOUM2. (A) The structure of the porphyrin compounds TMPyP2 and TMPyP4. (B) CD analysis of the i-motif structure in the presence of TMPyP4 or TMPyP2. (C) CD analysis of melting temperature of the i-motif structure in the presence of TMPyP4 or TMPyP2. The synthesized ssDNA oligonucleotides that contained the i-motif region (5 μM) were heated at 95°C for 10 min in 50 mM Tris-acetate buffer at pH 4.1 and slowly cooled to room temperature over 4 h period to allow i-motif structure to form. TMPyP2 or TMPyP4 was then added into the solution at a final concentration of 25 μM and incubated overnight at 4°C, followed by CD analysis. The dot lines show the melting temperatures. (D) Determination of the promoter activity by the luciferase assay in the presence of TMPyP4 or TMPyP2. Data are means ± SEM (n = 3). ***P < 0.001 (Student's t test).
Figure 5.
Figure 5.
Identification of nuclear proteins that bind to the i-motif structure. (A) Pull-down experiment with nuclear proteins of Bm12 cells. The oligonucleotide probes were shown in the top panel. WT and Mut: wild-type and mutated ssDNA. The arrows point to the protein band observed in WT but not in the mutant. (B) EMSA (6% PAGE) analysis of the recombinant BmILF binding with the i-motif probe. The cold probe was the unlabeled i-motif probe. (C) EMSA (12% PAGE) analysis of the recombinant BmILF binding with the i-motif structure or linear DNA probe at different pH conditions. The positions of the labeled i-motif-containing probe, labeled linear DNA probe and the labeled bound i-motif and BmILF are shown by arrows. (D) Bm12 cells transfected with EGFP vector as a control or with BmILF-EGFP. The green fluorescence shows the similar transfection efficiency and expression of EGFP and BmILF-EGFP. Chromatin immunoprecipitated (ChIP) target sequence was detected by RT-PCR (top panel) and by qRT-PCR (bottom panel). The enrichment of the promoter sequence in immunoprecipitated DNA samples was normalized with DNA present in the 10% input material. Data is means ± SEM (n = 3). ***P < 0.001 (Student's t test). (E) The reverse strand sequence of the -68∼-153 nt region of the BmPOUM2 promoter. The region that forms the i-motif structure is boxed in red. The primer aligned regions are underlined. (F) The sequencing atlas of the enriched RT-PCR product of the ChIP assay.
Figure 6.
Figure 6.
Regulation of the BmPOUM2 promoter activity by over-expression or RNAi suppression of BmILF. (A) Bm12 cells co-transfected with EGFP vector as a control or with BmILF-EGFP. The green fluorescence shows the similar transfection efficiency and expression of EGFP and BmILF-EGFP. (B) The luciferase activity in Bm12 cells co-transfected with EGFP vector or BmILF-EGFP and the pGL3-WT-BmPOUM2 promoter-luciferase vector (WT-BmPOUM2-P-Luc) or the i-motif-mutated pGL3-Mut-BmPOUM2 promoter-luciferase vector (Mut-BmPOUM2-P-Luc). (C) Reduction of BmILF by RNAi detected at 48 h and 72 h after BmILF dsRNA was transfected into Bm12 cells. (D) Changes of the luciferase activity in Bm12 cells co-transfected with BmILF dsRNA or EGFP dsRNA and the luciferase reporter vector. Data in (B) and (D) are means ± SEM (n = 3). **P < 0.01 (Student's t test).
Figure 7.
Figure 7.
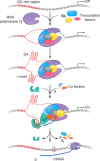
Diagram of proposed epigenetic regulatory mechanism of BmPOUM2 by the i-motif secondary structure, which was bound by BmILF. When BmPOUM2 starts to transcribe, the basal transcription factors bind to the core promoter, separating the dsDNA strands. At this time, the GC-rich dsDNA in the upstream region would open because of negative supercoil. The G-rich and C-rich ssDNA immediately fold to form G4 and i-motif structures, respectively. The i-motif recruits the transcription factor BmILF, which may recruit other co-factors required for expression of BmPOUM2. After transcription, the basal transcription factor(s) disassemble from the core promoter and the secondary structures unfold to form dsDNA, turning the transcription off.

References

    1. Ruvkun G., Finney M.. Regulation of transcription and cell identity by POU domain proteins. Cell. 1991; 64:475–478. - PubMed
    1. Herr W., Sturm R.A., Clerc R.G., Corcoran L.M., Baltimore D., Sharp P.A., Ingraham H.A., Rosenfeld M.G., Finney M., Ruvkun G. et al. The POU domain: a large conserved region in the mammalian pit-1, oct-1, oct-2, and Caenorhabditis elegans unc-86 gene products. Genes Dev. 1988; 2:1513–1516. - PubMed
    1. Ryan A.K., Rosenfeld M.G.. POU domain family values: flexibility, partnerships, and developmental codes. Genes Dev. 1997; 11:1207–1225. - PubMed
    1. Andersen B., Rosenfeld M.G.. POU domain factors in the neuroendocrine system: lessons from developmental biology provide insights into human disease. Endocr. Rev. 2001; 22:2–35. - PubMed
    1. Komiyama T., Johnson W.A., Luo L., Jefferis G.S.. From lineage to wiring specificity POU domain transcription factors control precise connections of Drosophila olfactory projection neurons. Cell. 2003; 112:157–167. - PubMed

Publication types

LinkOut - more resources