In vivo characterization of brain ultrashort-T2 components
- PMID: 29194734
- PMCID: PMC5910201
- DOI: 10.1002/mrm.27037
In vivo characterization of brain ultrashort-T2 components
Abstract
Purpose: Recent nuclear magnetic resonance and MRI studies have measured a fast-relaxing signal component with T2∗<1 ms in white matter and myelin extracts. In ex vivo studies, evidence suggests that a large fraction of this component directly arises from bound protons in the myelin phospholipid membranes. Based on these results, this ultrashort-T2 component in nervous tissue is a new potential imaging biomarker of myelination, which plays a critical role in neuronal signal conduction across the brain and loss or degradation of myelin is a key feature of many neurological disorders. The goal of this work was to characterize the relaxation times and frequency shifts of ultrashort-T2 components in the human brain.
Methods: This required development of an ultrashort echo time relaxometry acquisition strategy and fitting procedure for robust measurements in the presence of ultrashort T2∗ relaxation times and large frequency shifts.
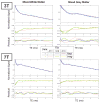
Results: We measured an ultrashort-T2 component in healthy volunteers with a median T2∗ between 0.5-0.7 ms at 3T and 0.2-0.3 ms at 7T as well as an approximately -3 ppm frequency shift from water.
Conclusion: To our knowledge, this is the first time a chemical shift of the ultrashort-T2 brain component has been measured in vivo. This chemical shift, at around 1.7 ppm, is similar to the primary resonance of most lipids, indicating that much of the ultrashort-T2 component observed in vivo arises from bound protons in the myelin phospholipid membranes. Magn Reson Med 80:726-735, 2018. © 2017 International Society for Magnetic Resonance in Medicine.
Keywords: myelin imaging; myelin membranes; relaxometry; ultrashort echo time MRI; ultrashort-T2.
© 2017 International Society for Magnetic Resonance in Medicine.
Figures


Similar articles
-
Whole-Brain Myelin Imaging Using 3D Double-Echo Sliding Inversion Recovery Ultrashort Echo Time (DESIRE UTE) MRI.Radiology. 2020 Feb;294(2):362-374. doi: 10.1148/radiol.2019190911. Epub 2019 Nov 19. Radiology. 2020. PMID: 31746689 Free PMC article.
-
Inversion recovery ultrashort echo time magnetic resonance imaging: A method for simultaneous direct detection of myelin and high signal demonstration of iron deposition in the brain - A feasibility study.Magn Reson Imaging. 2017 May;38:87-94. doi: 10.1016/j.mri.2016.12.025. Epub 2016 Dec 28. Magn Reson Imaging. 2017. PMID: 28038965 Free PMC article.
-
Direct imaging of white matter ultrashort T2∗ components at 7 Tesla.Magn Reson Imaging. 2022 Feb;86:107-117. doi: 10.1016/j.mri.2021.11.016. Epub 2021 Dec 11. Magn Reson Imaging. 2022. PMID: 34906631
-
Mechanisms of T2 * anisotropy and gradient echo myelin water imaging.NMR Biomed. 2017 Apr;30(4). doi: 10.1002/nbm.3513. Epub 2016 Apr 7. NMR Biomed. 2017. PMID: 27060968 Review.
-
MRI-based myelin water imaging: A technical review.Magn Reson Med. 2015 Jan;73(1):70-81. doi: 10.1002/mrm.25198. Epub 2014 Mar 6. Magn Reson Med. 2015. PMID: 24604728 Review.
Cited by
-
Volumetric imaging of myelin in vivo using 3D inversion recovery-prepared ultrashort echo time cones magnetic resonance imaging.NMR Biomed. 2020 Oct;33(10):e4326. doi: 10.1002/nbm.4326. Epub 2020 Jul 20. NMR Biomed. 2020. PMID: 32691472 Free PMC article.
-
UTE MRI for assessing demyelination in an mTBI mouse model: An open-field low-intensity blast study.Neuroimage. 2025 Apr 15;310:121103. doi: 10.1016/j.neuroimage.2025.121103. Epub 2025 Feb 28. Neuroimage. 2025. PMID: 40024556 Free PMC article.
-
Quantification of the in vivo brain ultrashort-T2* component in healthy volunteers.Magn Reson Med. 2024 Jun;91(6):2417-2430. doi: 10.1002/mrm.30013. Epub 2024 Jan 30. Magn Reson Med. 2024. PMID: 38291598 Free PMC article.
-
Water phase transition and signal nulling in 3D dual-echo adiabatic inversion-recovery UTE (IR-UTE) imaging of myelin.Magn Reson Med. 2024 Dec;92(6):2464-2472. doi: 10.1002/mrm.30243. Epub 2024 Aug 9. Magn Reson Med. 2024. PMID: 39119819
-
Quantitative analysis of repaired rabbit supraspinatus tendons (± channeling) using magnetic resonance imaging at 7 Tesla.Quant Imaging Med Surg. 2021 Aug;11(8):3460-3471. doi: 10.21037/qims-20-1343. Quant Imaging Med Surg. 2021. PMID: 34341723 Free PMC article.
References
-
- Courchesne E, Chisum HJ, Townsend J, Cowles A, Covington J, Egaas B, Harwood M, Hinds S, Press GA. Normal brain development and aging: Quantitative analysis at in vivo mr imaging in healthy volunteers1. Radiology. 2000;216:672–682. - PubMed
-
- Englund E. Neuropathology of white matter changes in alzheimer’s disease and vascular dementia. Dementia and Geriatric Cognitive Disorders. 1998;9:6–12. - PubMed
-
- Bartzokis G. Age-related myelin breakdown: a developmental model of cognitive decline and alzheimer’s disease. Neurobiology of Aging. 2004;25:5–18. - PubMed
Publication types
MeSH terms
Substances
Grants and funding
LinkOut - more resources
Full Text Sources
Other Literature Sources
Medical

