. 2017 Nov 30;171(6):1284-1300.e21.
doi: 10.1016/j.cell.2017.10.022.

Epigenetic Therapy Ties MYC Depletion to Reversing Immune Evasion and Treating Lung Cancer

Affiliations

Epigenetic Therapy Ties MYC Depletion to Reversing Immune Evasion and Treating Lung Cancer

Michael J Topper et al. Cell. .

Abstract

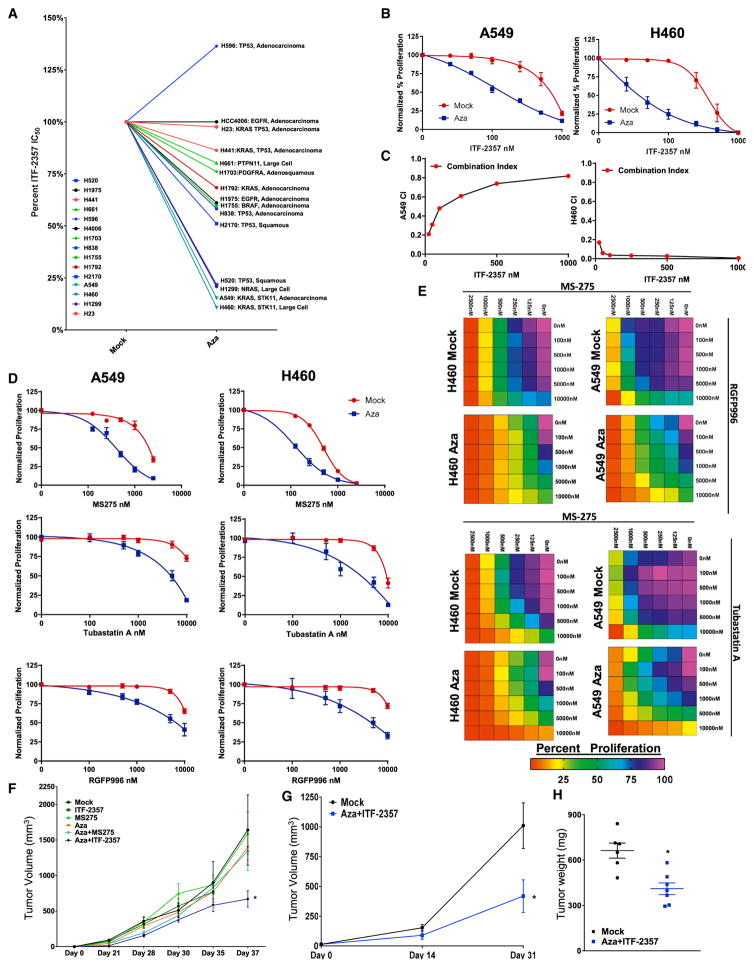
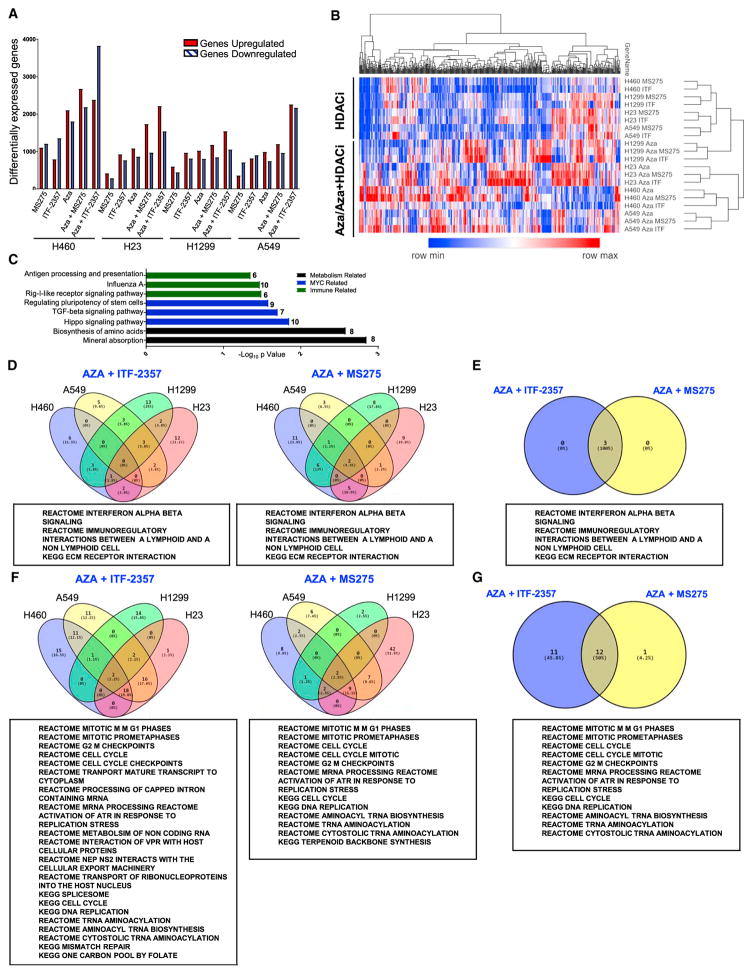
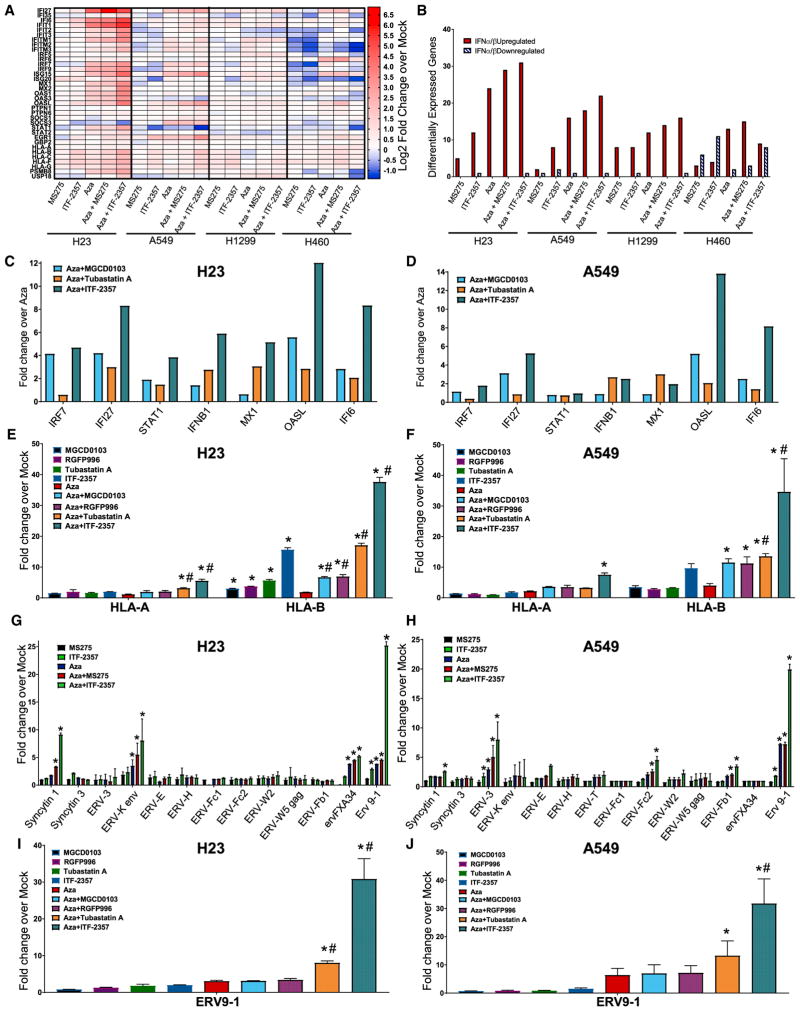
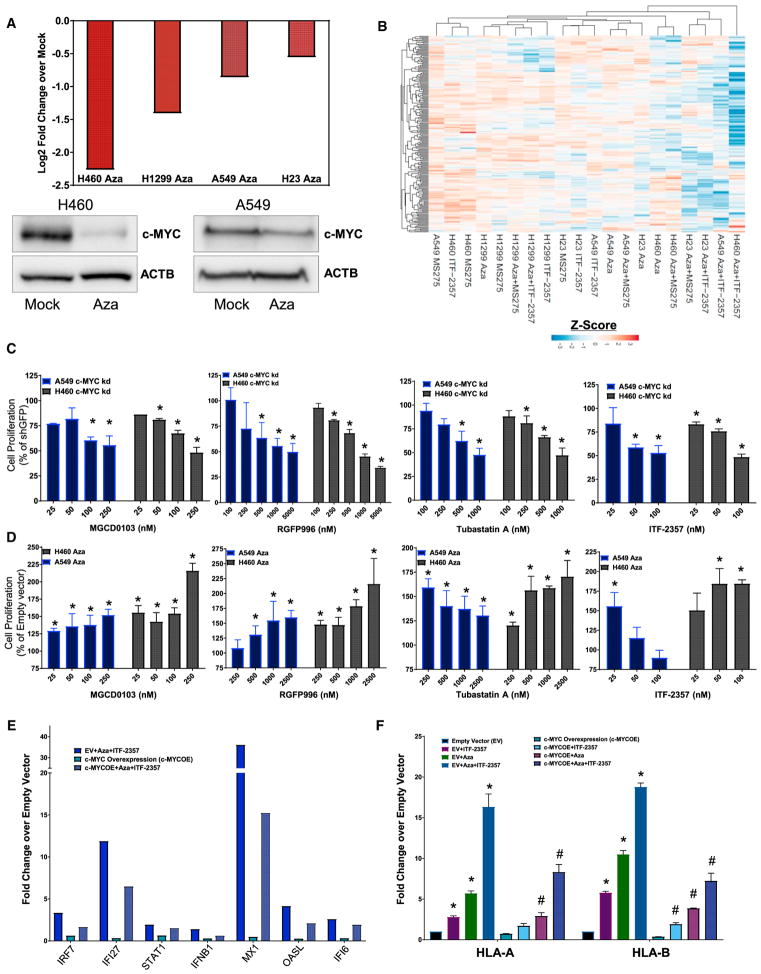
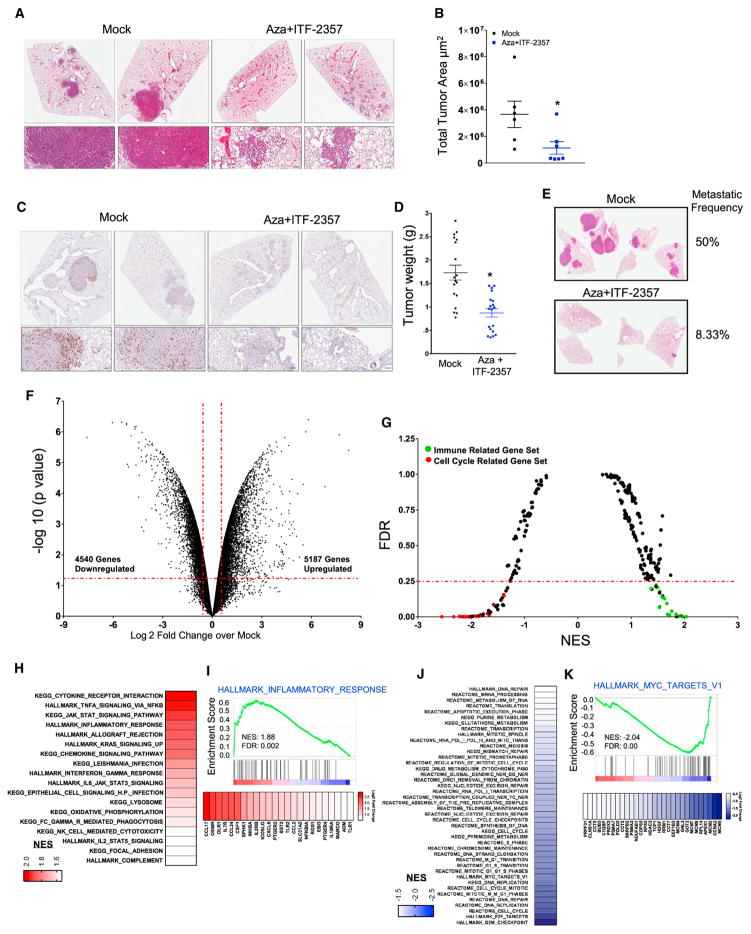
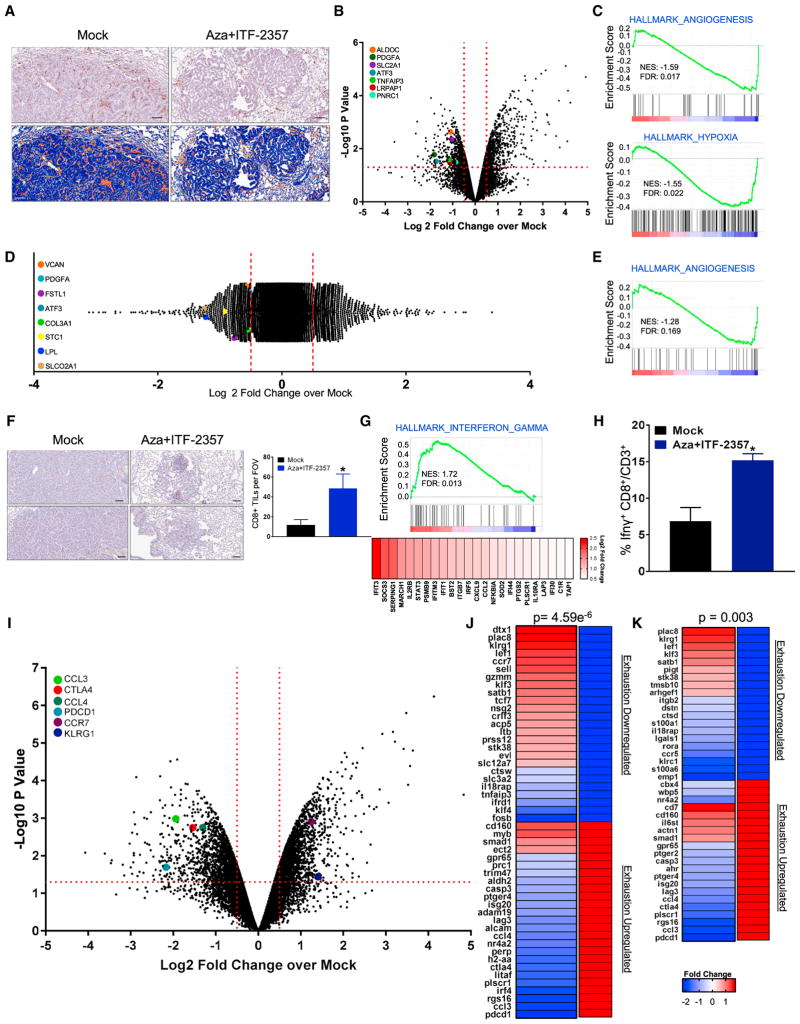
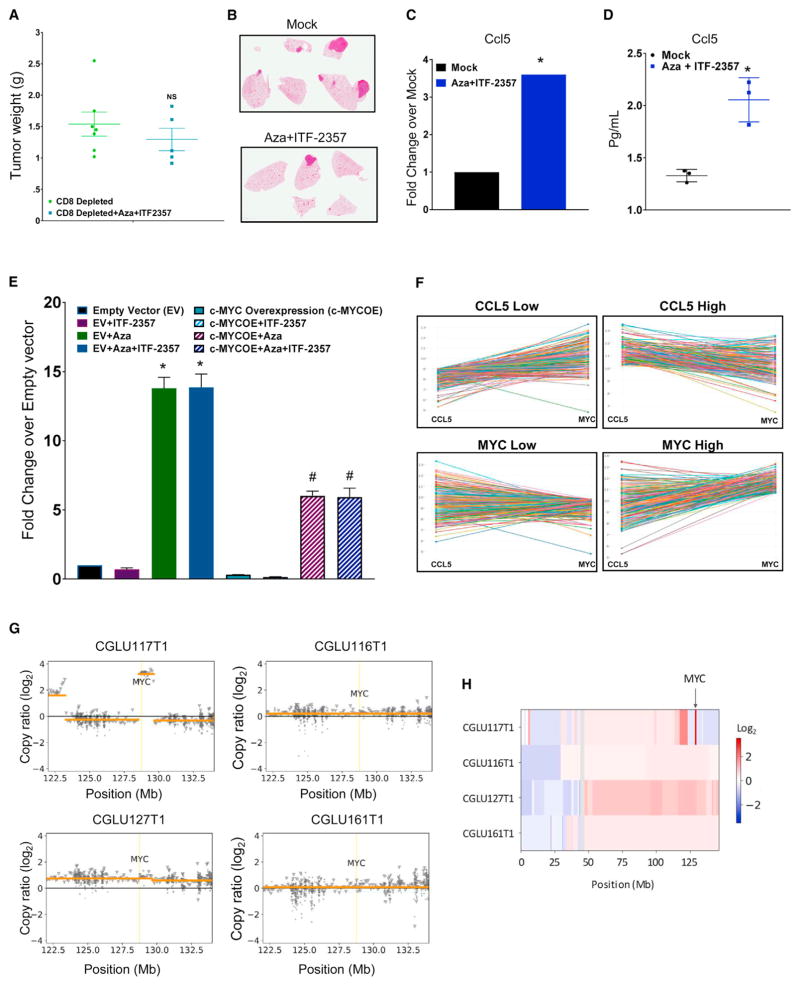
Combining DNA-demethylating agents (DNA methyltransferase inhibitors [DNMTis]) with histone deacetylase inhibitors (HDACis) holds promise for enhancing cancer immune therapy. Herein, pharmacologic and isoform specificity of HDACis are investigated to guide their addition to a DNMTi, thus devising a new, low-dose, sequential regimen that imparts a robust anti-tumor effect for non-small-cell lung cancer (NSCLC). Using in-vitro-treated NSCLC cell lines, we elucidate an interferon α/β-based transcriptional program with accompanying upregulation of antigen presentation machinery, mediated in part through double-stranded RNA (dsRNA) induction. This is accompanied by suppression of MYC signaling and an increase in the T cell chemoattractant CCL5. Use of this combination treatment schema in mouse models of NSCLC reverses tumor immune evasion and modulates T cell exhaustion state towards memory and effector T cell phenotypes. Key correlative science metrics emerge for an upcoming clinical trial, testing enhancement of immune checkpoint therapy for NSCLC.

Keywords: HDAC; ITF-2357; MYC; NSCLC; azacitidine; immune response; lung cancer; memory T cells.


Figures

Figure 1
Figure 1. Azacitidine Synergizes with Sequential HDACi for Reducing Cell Proliferation
(A) Composite representation of ITF-2357 IC50 as determined by four parameter dose-response analysis in the presence of mock or 500 nM Aza pre-treatment. Individual dose-response curves are in Figures 1B, S1B, and S1E. H1650 not depicted due to lack of sensitivity to epigenetic agents deployed in study. (B) Sequential treatment with (mock or 500 nM Aza) + ITF-2357 log dose-response curves for growth inhibition of A549 and H460 cells (day 11, n = 5, data represented as mean ± SEM). (C) Combination index (CI) plots for sequential application of Aza + ITF-2357 in A549 and H460 cells (n = 5). (D) Sequential treatment with (mock or 500 nM Aza) + MS-275, RGFP996 (HDAC3i), or Tubastatin A (HDAC6i) log dose-response curves for growth inhibition of A549 and H460 cells (day 11, n = 3, data represented as mean ± SEM). (E) Sequential treatment (mock or 500 nM Aza) with MS-275 plus either RGFP996 or Tubastatin A drug dose-response matrix for growth inhibition of A549 and H460 cells (day 11, n = 3, color gradation indicates percentage viability at the indicated dose combination). (F and G) Mean volumes of tumor xenografts obtained from NOD-SCID mice subcutaneously injected with H460 cells (F) or H1299 cells (G) and treated with the agents as indicated in the figure. Data are presented as mean ± SEM (n = 5). *p < 0.05 calculated using two tailed t test. (H) Tumor weights for patient-derived xenografts treated with the agents as outlined in the figure (28 days of treatment duration; data are presented as mean ± SEM; n = 6 mock and n = 7 Aza + ITF-2357). *p value < 0.05 calculated using two-tailed t test. See also Figure S1.
Figure 2
Figure 2. Epigenetic Treatment of NSCLC Cell Lines Induces Robust Alteration of Cell Transcriptome
(A) Quantitation of differentially expressed genes (cutoff Log2 fold change over mock >0.5) for each treatment condition. (B) Unsupervised hierarchical clustering of relative RNA expression by median absolute deviation (MAD). RNA expression Log2 fold change over mock; blue to red color gradation is based on the ranking of each condition from minimum (blue) to maximum (red). The top 500 genes are depicted. (C) DAVID analysis of the top 500 MAD genes using Kyoto Encyclopedia of Genes and Genomes (KEGG) gene ontology. (D) Venn diagrams depicting GSEA-derived overlapping and unique pathways induced by combination treatment in at least 3 cell lines with the respective HDACi (normalized enrichment score [NES] > 2.0, false discovery rate [FDR] < 0.25). (E) Venn diagram of pathways commonly upregulated by combination treatment with Aza and the respective HDACi. (F) Venn diagrams depicting GSEA-derived overlapping and unique pathways downregulated by combination treatment in at least 3 cell lines with the respective HDACi (NES < 2.0, FDR < 0.25). (G) Venn diagram of pathways commonly downregulated by combination treatment with Aza and the respective HDACi. The above data are derived from microarray analysis of RNA from cells treated with 500 nM Aza, 100 nM ITF-2357, and 100 nM MS-275. See also Figure S2.
Figure 3
Figure 3. Combination Epigenetic Treatment Augments IFNα/β Pathway-Associated Immune Genes and ERV Transcription
(A) Heatmap of relative RNA expression for IFNα/β-signaling pathway core-enriched genes for the indicated cell lines (microarray, day 8; 500 nM Aza, 100 nM MS-275, and 100 nM ITF-2357). (B) Quantification of IFNα/β pathway core-enriched genes differentially expressed by the indicated conditions (microarray, day 8; 500 nM Aza, 100 nM MS-275, and 100 nM ITF-2357; differential gene expression cutoff Log2 fold change over mock >0.5). (C and D) Expression of viral defense gene subset of IFNα/β pathway (PCR genecard, day 8; 500 nM Aza, 100 nM ITF-2357, 200 nM MGCD0103, and 1,000 nM Tubastatin A) in H23 (C) and A549 (D) cells. (E and F) Quantitation of selected major histocompatibility complex (MHC) class I genes of the IFNα/β pathway in response to Aza and/or HDACi in H23 (E) and A549 (F) cells (qRT-PCR, day 8; 500 nM Aza, 100 nM ITF-2357, 200 nM MGCD0103, 2,000 nM RGFP996, and 1,000 nM Tubastatin A; n = 3). (G and H) Quantitation of ERV transcripts in response to Aza and/or HDACi in H23 (G) and A549 (H) cells (qRT-PCR, day 8; 500 nM Aza, 100 nM ITF-2357, and 100 nM MS-275; n = 4). (I and J) Quantitation of ERV9-1 in response to Aza and/or HDACi in H23 (I) and A549 (J) cells (500 nM Aza, 100 nM ITF-2357, 200 nM MGCD0103, 2,000 nM RGFP996, and 1,000 nM Tubastatin A; n = 3). Data are presented as mean ± SEM (*p < 0.05 relative to mock and #p value < 0.05 relative to Aza; p value determined by two-tailed t test). See also Figures S3 and S4.
Figure 4
Figure 4. MYC Perturbation Drives Aza Sensitization to HDACi and IFNα/β Pathway Gene Augmentation
(A) Top panel: quantitation of relative MYC RNA expression in NSCLC cell lines following 500 nM Aza treatment (microarray, day 8). Bottom panel: immunoblot shows expression of MYC protein on day 9 of treatment. β-actin was used as a loading control (500 nM Aza, n = 3). (B) Unsupervised hierarchical clustering of relative RNA expression for GSEA HALLMARK MYC TARGETS. Color gradation is based on Z score ranking of log2 fold change over mock (microarray, day 8; 500 nM Aza, 100 nM MS-275, and 100 nM ITF-2357). (C and D) A549 and H460 cell line quantitation of colorimetric absorbance as an indicator of proliferating cell number, normalized to untreated control. (C) Percentage proliferation for GFP and shMYC vector-infected cells treated with the indicated HDACi for 5 days (n = 3). (D) Percentage proliferation for empty vector (EV) or MYC overexpression vector containing cells treated with the indicated HDACi for 5 days (n = 3 overexpression clones). (E and F) Relative RNA expression of IFNα/β pathway-responsive genes in A549 cells infected with EV or MYC overexpression construct and treated with mock or 500 nM Aza + 100 nM ITF-2357. (E) Quantitation of relative RNA expression for IFNα/β pathway-viral defense gene subset (genecard, day 8). (F) Quantitation of relative RNA expression for IFNα/β pathway-MHC class I genes (qRT-PCR, day 8, n = 3). Data are presented as mean ± SEM (*p < 0.05 relative to mock and #p < 0.05 relative to EV + Epigenetic treatment; p value determined by two-tailed t test). See also Figure S5.
Figure 5
Figure 5. Combination Epigenetic Treatment Reduces Lung Tumor Burden and Progression in Mouse Models of NSCLC
(A) Representative H&E-stained images of lung sections from mice treated with mock or Aza + ITF-2357. Scale bar, 100 μm. (B) Quantitation of total tumor area occupied by lesions in lungs of LSL-KrasG12D mice treated with mock or Aza + ITF-2357. Data are presented as mean ± SEM (p value determined by two-tailed t test; n = 6 mock and n = 7 Aza + ITF-2357 mice per group/2 sections analyzed per mouse). (C) Representative Ki67-stained IHC images of lung sections from mice treated with mock or Aza + ITF-2357 (n = 5 per group). Scale bar, 100 μm. (D) Lewis Lung Carcinoma (LLC) tumor weights of subcutaneous explants from 1-month mock- and Aza + ITF-2357-treated mice (n = 19 mice per group; error bars, SEM). (E) Representative H&E-stained images of lung metastasis from LLC mice obtained from 1-month mock- and Aza + ITF-2357-treated mice (n = 12 mice per group), with the indicated percentage frequency of metastasis. (F) Volcano plot of relative RNA expression from LSL-KrasG12D mouse lung tumors treated for 3 months with Aza + ITF-2357 as compared to mock mice. Genes in upper left and right quadrants are significantly differentially expressed (microarray, n = 2 per group). (G) GSEA (KEGG, REACTOME, and HALLMARK) pathway distribution for Aza + ITF-2357 versus mock tumors from LSL-KrasG12D mice. Horizontal line denotes FDR significance cutoff of 0.25. Immune- and cell cycle-related gene sets are demarcated by green and red dots, respectively (microarray, n = 2 per group). (H) Gene sets upregulated in LSL-KrasG12D mice (FDR < 0.25 and NES > 1.5) by Aza + ITF-2357. Color gradation is based on GSEA NES. (I) Representative upregulated GSEA plots with corresponding core-enriched genes. Color gradation is representative of Log2 fold change over mock. (J) Gene sets downregulated in LSL-KrasG12D mice (FDR < 0.25 and NES < 1.5) by Aza + ITF-2357. Color gradation is based on GSEA NES. (K) Representative downregulated GSEA plot with core-enriched genes. Color gradation is representative of Log2 fold change over mock-treated RNA expression. *p < 0.05 calculated using two tailed t test. See also Figure S6.
Figure 6
Figure 6. Effect of Combination Epigenetic Treatment on Tumor-Associated Immune Populations and Their Functional Status
(A) Representative IHC staining of F4/80+ macrophages in LSL-KrasG12D lung tumor sections treated with mock or Aza + ITF-2357 for 3 months. Upper panel: representative F4/80+ IHC. Lower panel: positive pixel transformation of IHC images in upper panel using Aperio Imagescope software. Scale bar, 100 μm. (B) Volcano plot of relative RNA expression of CD45+CD11b+F4/80hi macrophages sorted via FACS and isolated from tumor-bearing lungs from 3-month mock- or Aza + ITF-2357-treated LSL-KrasG12D mice. Genes in the upper left and right quadrants are significantly differentially expressed (microarray, n = 2 per group). Hypoxia- and angiogenic pathway-associated genes are highlighted. (C) Key affected pathways obtained from GSEA of CD45+CD11b+F4/80hi macrophage RNA isolated from tumor-bearing lungs from 3-month Aza + ITF-2357-treated LSL-KrasG12D mice as compared to mock-treated mice. (D) Log2 fold relative RNA probe distribution showing differential gene expression from bone marrow-derived macrophages (BMDMs) treated in vitro with mock or Aza + ITF-2357. Angiogenic pathway-associated genes are highlighted (microarray, BMDM data representative of n = 3 mice). (E) GSEA enrichment plot for angiogenesis pathway from BMDM RNA expression. (F) CD8+ IHC in lung tumors of mock- and Aza + ITF-2357-treated LSL-KrasG12D mice following 3 months of treatment (scale bar, 100 μm). The graph on the right indicates the average number of CD8+ T cells counted per field of view (FOV) intra-tumor for mock and treated mice (n = 6 mock and n = 7 Aza + ITF-2357 mice). (G) Relative RNA expression-based enrichment plot for hallmark interferon gamma response gene set in tumors from LSL-KrasG12D mice treated with mock and Aza + ITF-2357. Color gradation is representative of Log2 fold change over mock RNA expression (microarray, n = 2 per group). (H) Percentage IFNγ+ CD8+/CD3+ TILs by FACS in LLC subcutaneous tumors from 1-month mock- and Aza + ITF-2357-treated mice. (I) Volcano plot of relative RNA expression for CD45+CD3+CD8+ FACS-obtained lymphocytes isolated from tumor-bearing lungs of 3-month Aza + ITF-2357-treated LSL-KrasG12D mice as compared to mock mice. Genes in the upper left and right quadrants are significantly differentially expressed (microarray, n = 2 per group). Highlighted genes are involved in T cell fate determination. (J and K) Fold change in expression of selected differentially expressed genes in FACS-obtained T cells from 3-month Aza + ITF-2357-treated mice. Genes shown are those that overlapped with exhaustion versus memory signatures (J) or exhaustion versus effector signatures (K) queried from Wherry et al. (2007) as defined in the Results. Genes on the left of each panel were differentially expressed by Aza + ITF-2357 and directionality in the gene set queried is on the right (red, upregulated; and blue, downregulated. The associated p value for the probability of overlap as derived by hypergeometric probability calculation is depicted above each panel. See also Figure S6.
Figure 7
Figure 7. The Functional Role of Immune Parameters for Anti-tumor Effects of Combination Epigenetic Treatment
(A) Weights of subcutaneous LLC tumors from 1-month mock and Aza + ITF-2357 treated mice in the presence of CD8a-depleting antibody (n = 7 mock and n = 5 treated mice). NS, non-significant p value calculated by two tail t test. (B) Representative H&E-stained images of lung metastases from the above 1-month mock and Aza + ITF-2357 treated mice in the presence of CD8a-depleting antibody (n = 7 mock and n = 5 treated mice). (C) Expression of ccl5 RNA in lung tumors from LSL-KrasG12D mice in response to 3 months of treatment with mock or Aza + ITF-2357 (microarray, n = 2, p value < 0.05 calculated by two-tailed t test). (D) Quantitation of ccl5 protein levels in bronchoalveolar lavage from LSL-KrasG12D mice treated with mock or Aza + ITF-2357 (n = 3; error bars, SD; *p value < 0.05 calculated by two-tailed t test). (E) Relative fold change for CCL5 RNA expression in empty vector (EV) or MYC-overexpressing A549 human NSCLC cells treated with 500 nM Aza and/or 100 nM ITF-2357 (qRT-PCR, day 8, n = 3). Data are presented as mean ± SEM (*p value < 0.05 relative to EV and #p value < 0.05 relative to EV + Aza + ITF-2357, p values calculated by two-tailed t test). (F) Profile interaction plots of TCGA RNA sequencing data for CCL5 and MYC expression across primary LUAD samples. (G) Somatic copy number status of the MYC locus in NSCLC tumors. A 1.13-Mb segment overlapping MYC harbored a 12-fold amplification in CGLU117T1, the tumor that did not derive durable clinical benefit from immune checkpoint blockade. Orange lines represent segments of constant copy number. Circle and triangle markers indicate genomic bins in coding (target) and non-coding (off-target) regions, respectively. (H) Copy number status of chromosome 8. The heatmap depicts segmental copy ratios after tumor purity correction, highlighting the amplification of the MYC locus for CGLU117T1 (arrow), but not for the other tumors analyzed. See also Figure S6.

Comment in

References

    1. Anagnostou V, Smith KN, Forde PM, Niknafs N, Bhattacharya R, White J, Zhang T, Adleff V, Phallen J, Wali N, et al. Evolution of Neoantigen Landscape during Immune Checkpoint Blockade in Non-Small Cell Lung Cancer. Cancer Discov. 2017;7:264–276. - PMC - PubMed
    1. Asthana J, Kapoor S, Mohan R, Panda D. Inhibition of HDAC6 deacetylase activity increases its binding with microtubules and suppresses microtubule dynamic instability in MCF-7 cells. J Biol Chem. 2013;288:22516–22526. - PMC - PubMed
    1. Borghaei H, Paz-Ares L, Horn L, Spigel DR, Steins M, Ready NE, Chow LQ, Vokes EE, Felip E, Holgado E, et al. Nivolumab versus Docetaxel in Advanced Nonsquamous Non-Small-Cell Lung Cancer. N Engl J Med. 2015;373:1627–1639. - PMC - PubMed
    1. Bradner JE, West N, Grachan ML, Greenberg EF, Haggarty SJ, Warnow T, Mazitschek R. Chemical phylogenetics of histone deace-tylases. Nat Chem Biol. 2010;6:238–243. - PMC - PubMed
    1. Cai Y, Geutjes EJ, de Lint K, Roepman P, Bruurs L, Yu LR, Wang W, van Blijswijk J, Mohammad H, de Rink I, et al. The NuRD complex cooperates with DNMTs to maintain silencing of key colorectal tumor suppressor genes. Oncogene. 2014;33:2157–2168. - PMC - PubMed

MeSH terms