. 2017 Nov 30;171(6):1301-1315.e14.
doi: 10.1016/j.cell.2017.11.013.

Myc Cooperates with Ras by Programming Inflammation and Immune Suppression

Affiliations

Myc Cooperates with Ras by Programming Inflammation and Immune Suppression

Roderik M Kortlever et al. Cell. .

Abstract

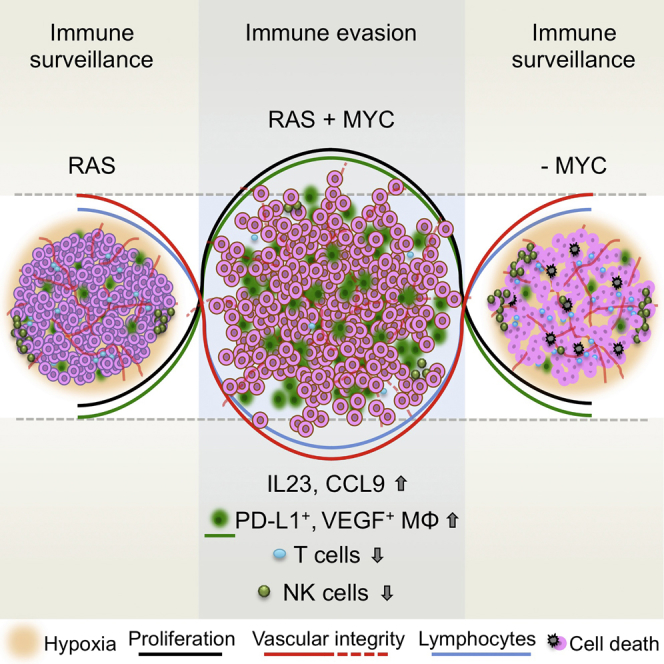
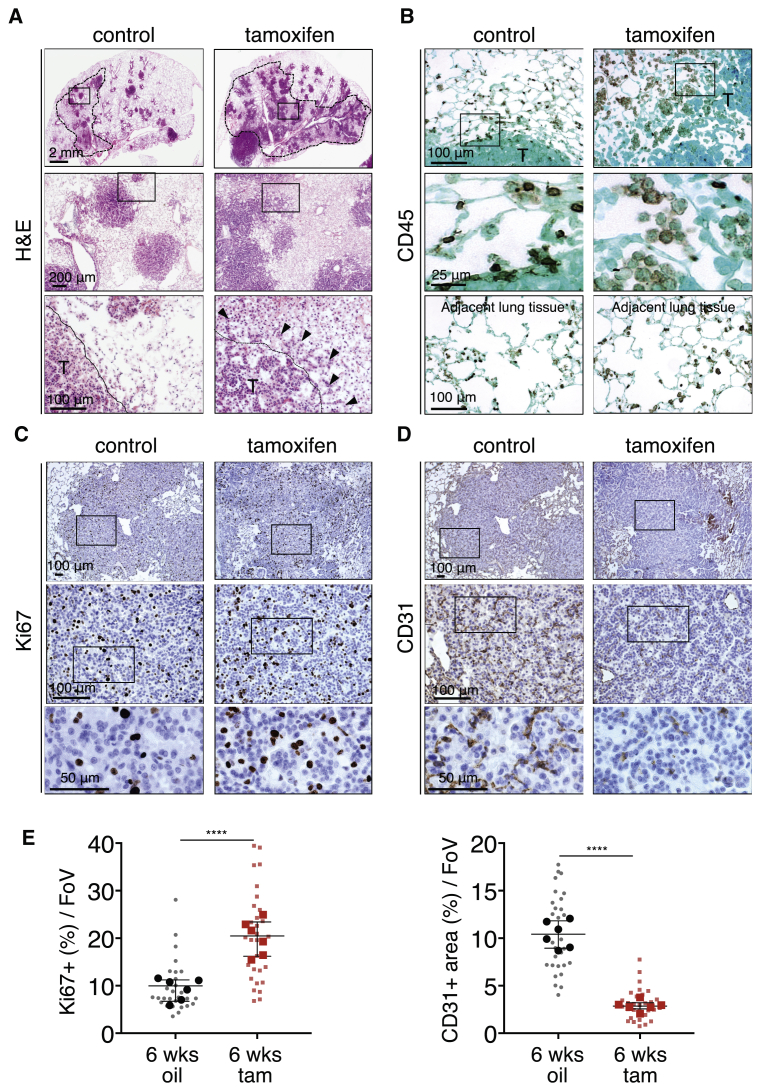
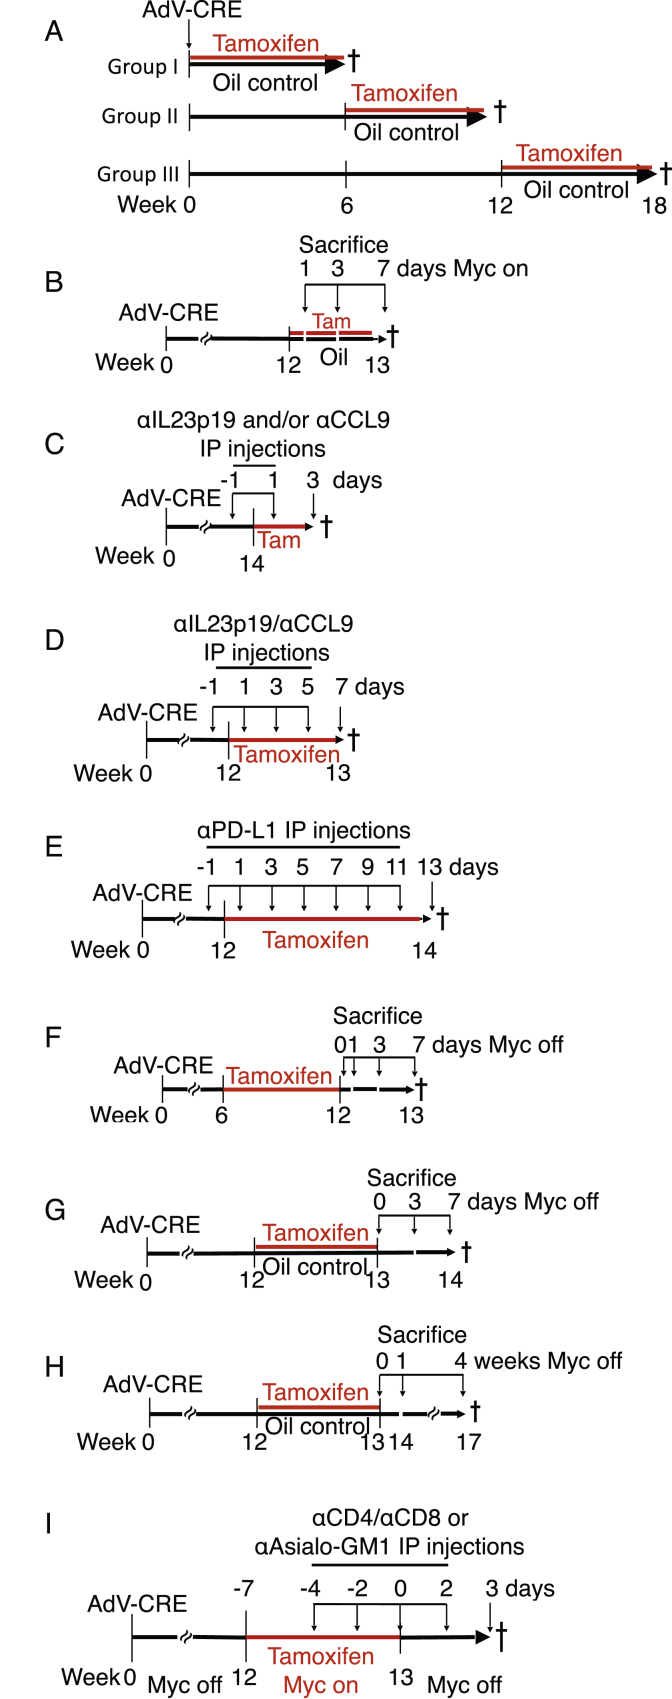
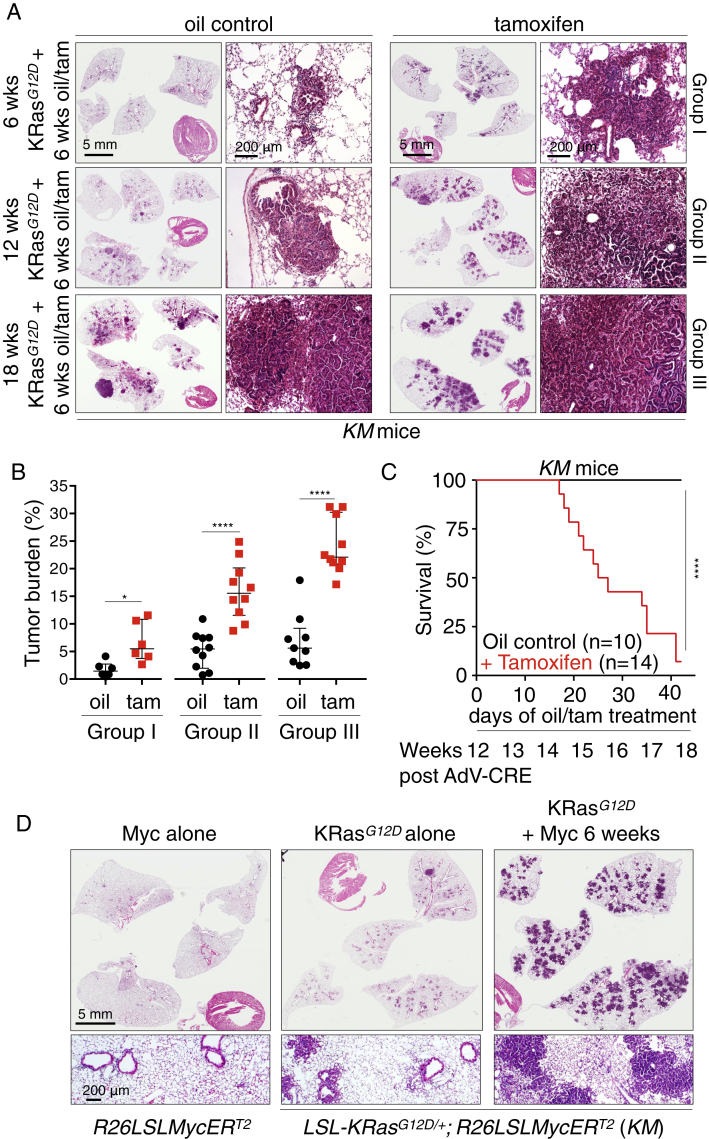
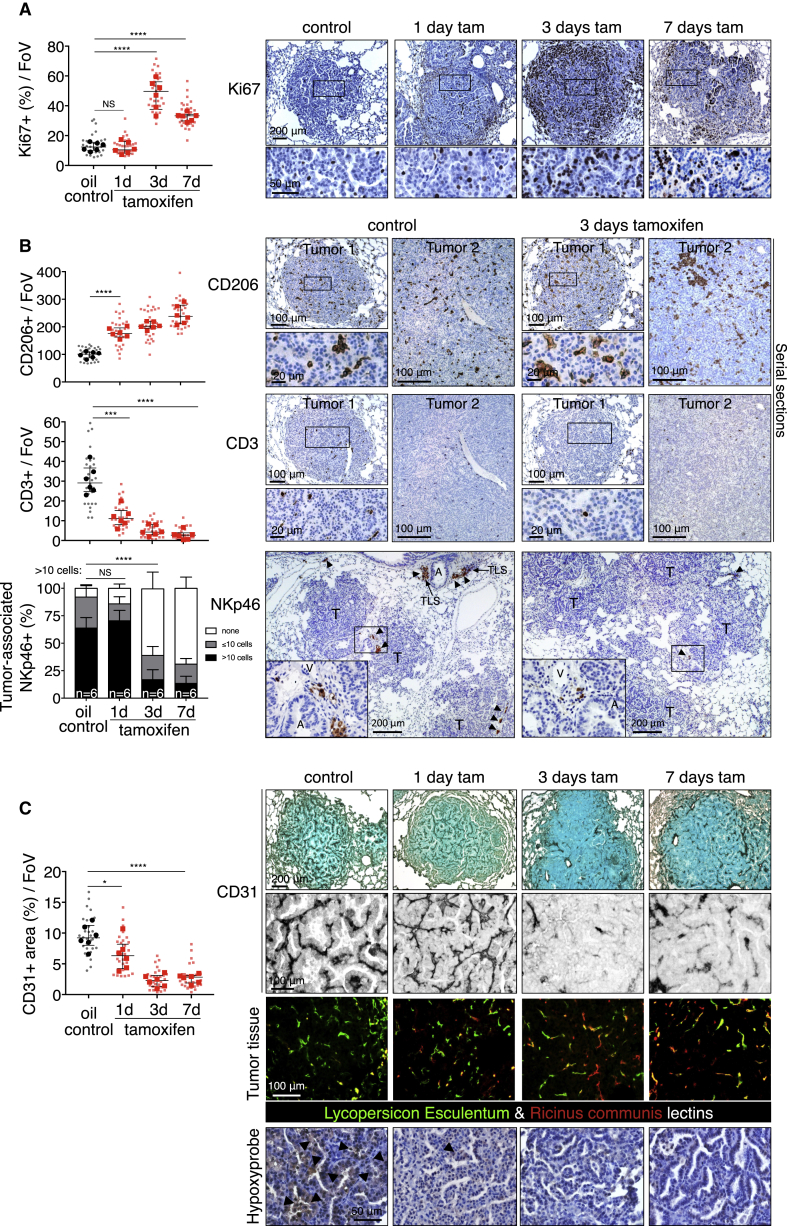
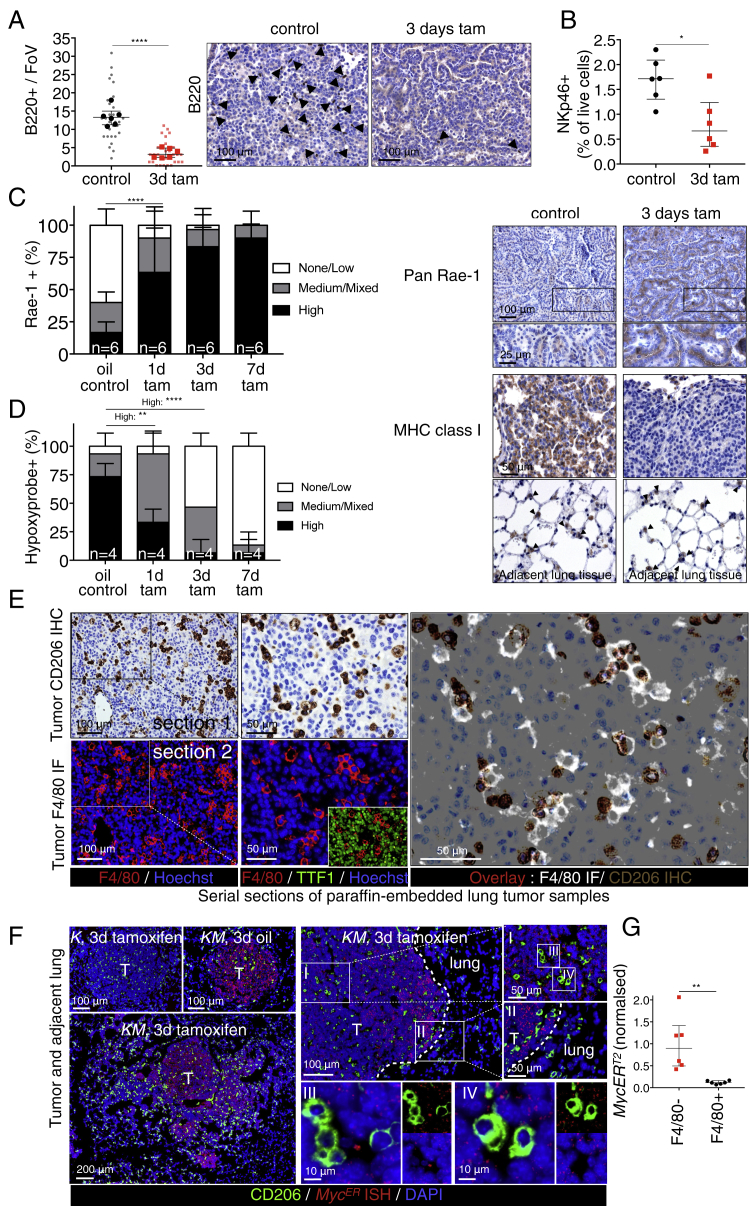
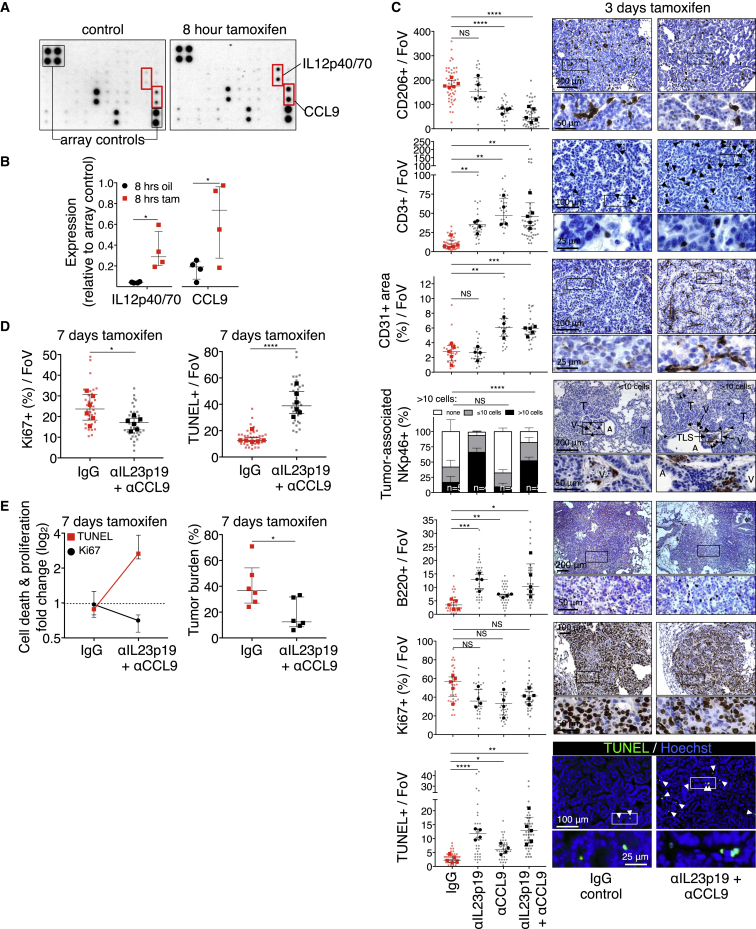
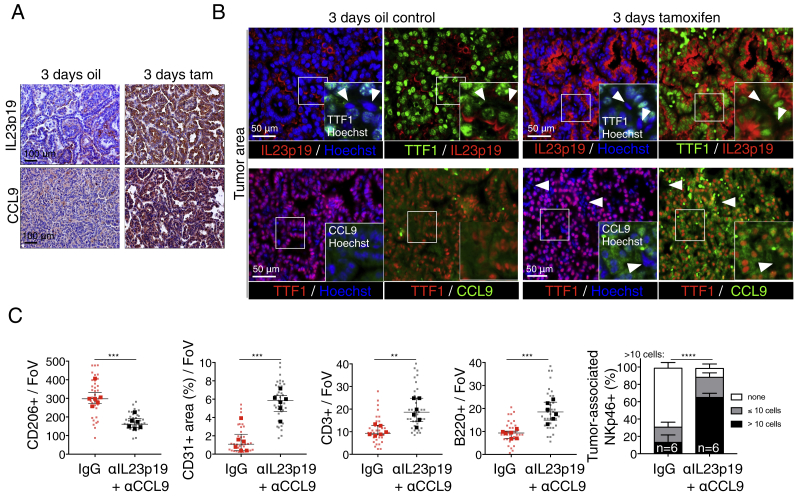
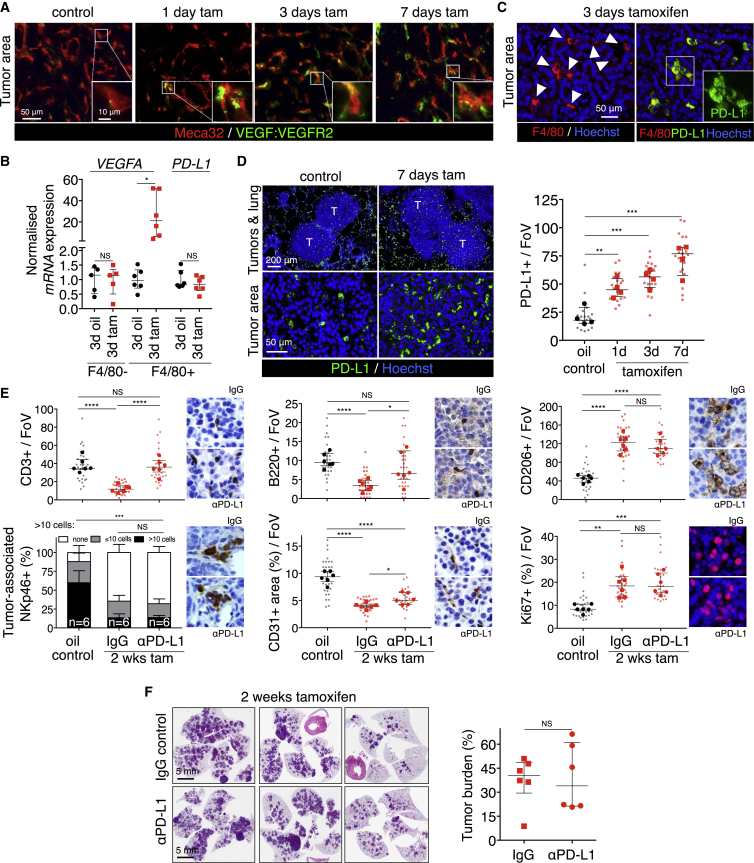
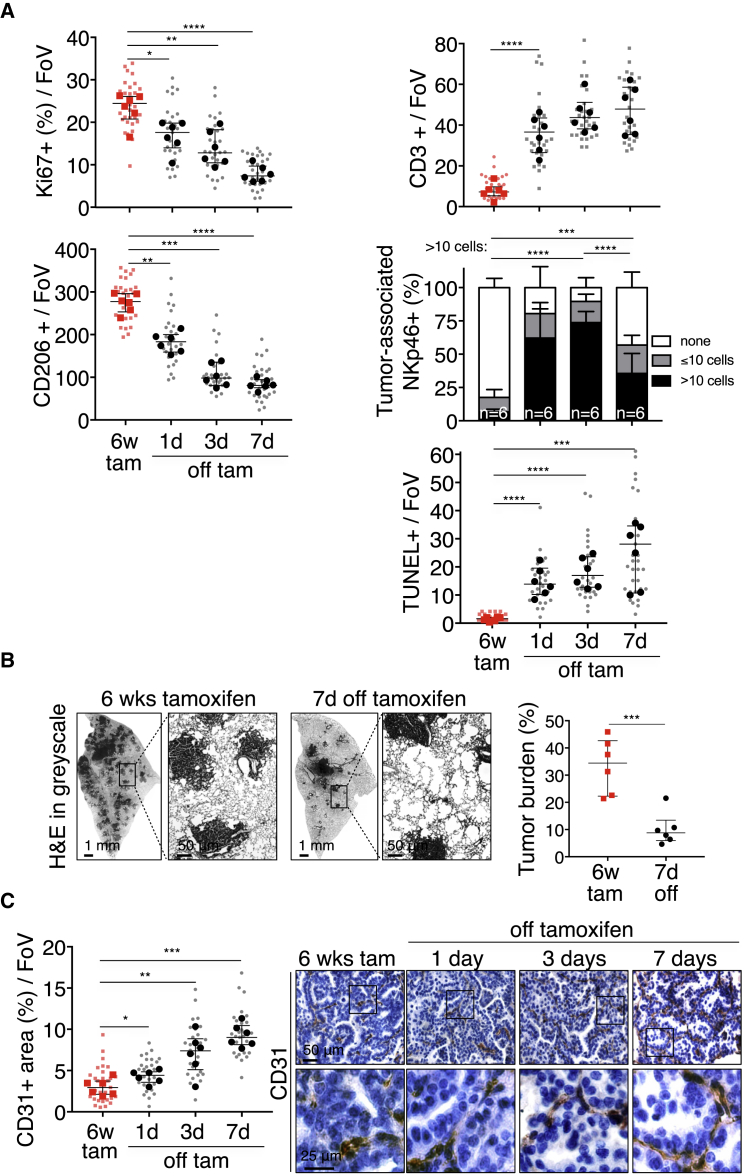
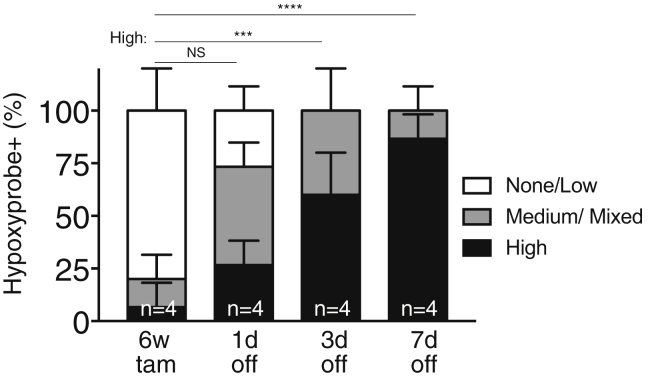
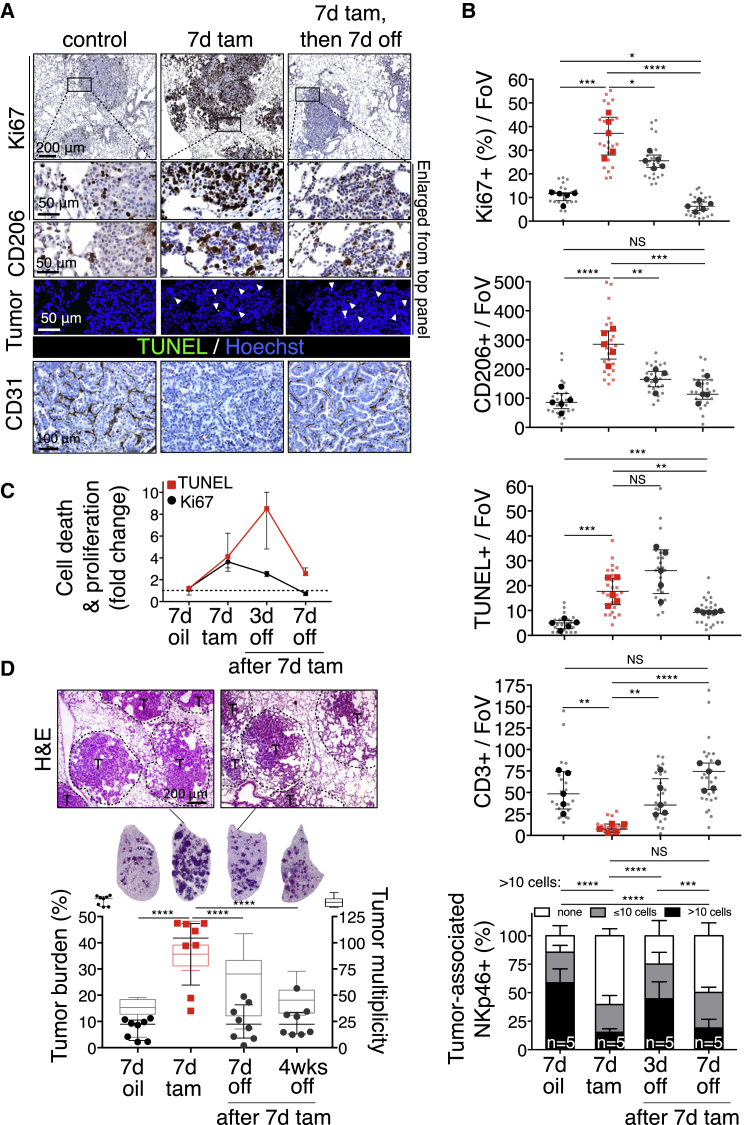
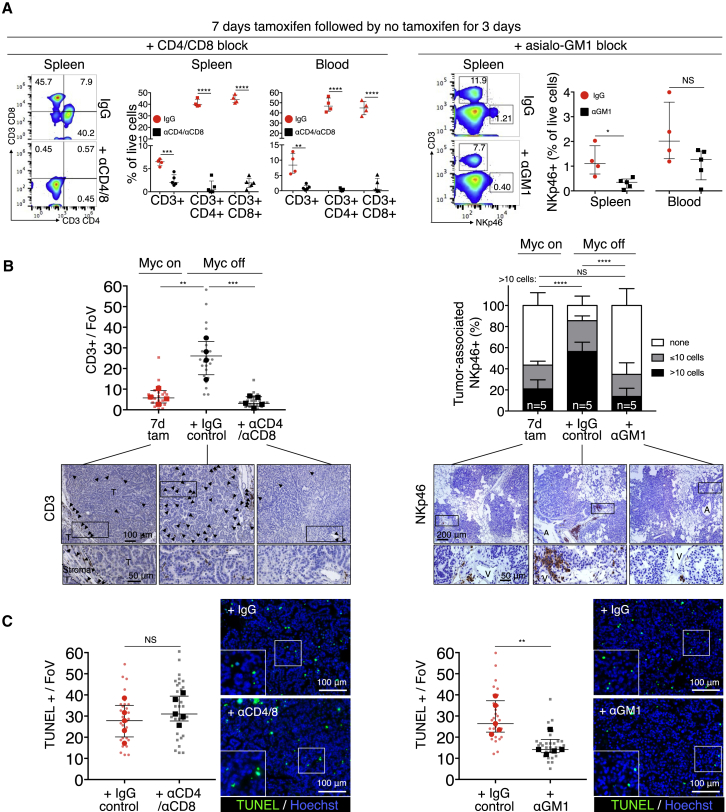
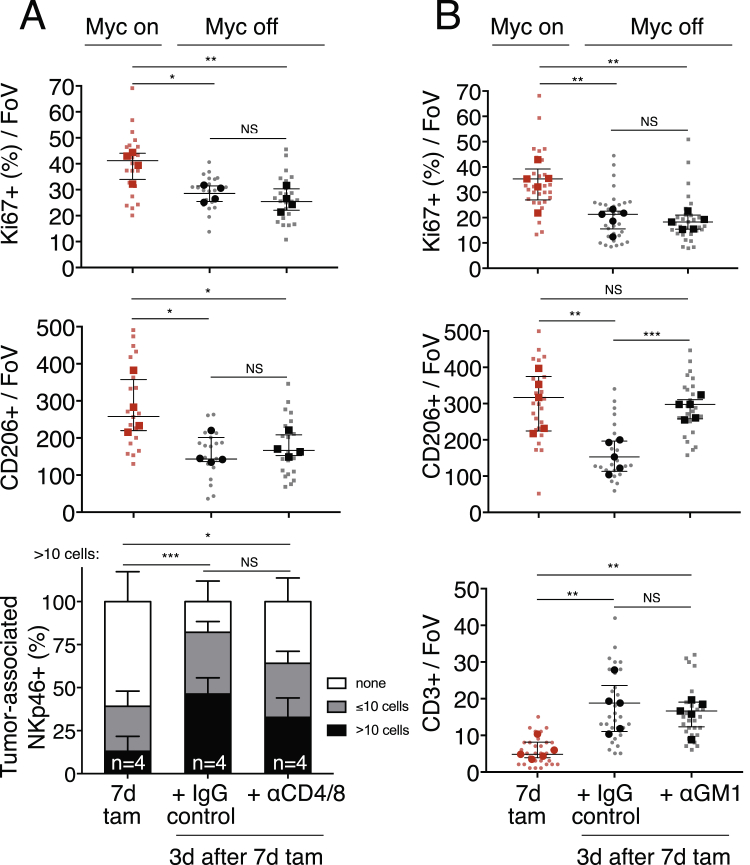
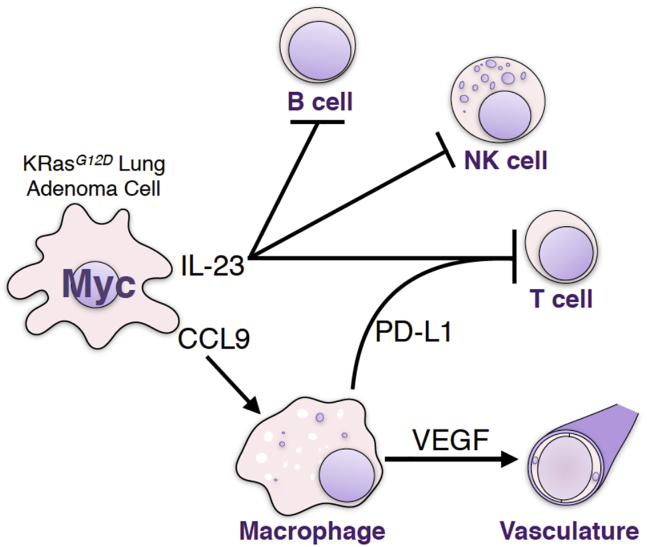
The two oncogenes KRas and Myc cooperate to drive tumorigenesis, but the mechanism underlying this remains unclear. In a mouse lung model of KRasG12D-driven adenomas, we find that co-activation of Myc drives the immediate transition to highly proliferative and invasive adenocarcinomas marked by highly inflammatory, angiogenic, and immune-suppressed stroma. We identify epithelial-derived signaling molecules CCL9 and IL-23 as the principal instructing signals for stromal reprogramming. CCL9 mediates recruitment of macrophages, angiogenesis, and PD-L1-dependent expulsion of T and B cells. IL-23 orchestrates exclusion of adaptive T and B cells and innate immune NK cells. Co-blockade of both CCL9 and IL-23 abrogates Myc-induced tumor progression. Subsequent deactivation of Myc in established adenocarcinomas triggers immediate reversal of all stromal changes and tumor regression, which are independent of CD4+CD8+ T cells but substantially dependent on returning NK cells. We show that Myc extensively programs an immune suppressive stroma that is obligatory for tumor progression.

Keywords: CCL9; IL-23; Myc; NK cells; Ras; immune suppression; inflammation; lung cancer; oncogene cooperation; tumor microenvironment.


Figures

None
Graphical abstract
Figure 1
Figure 1
Deregulated Myc Cooperates Oncogenically with KRasG12D in Lung (A) Representative H&E staining of lung sections 18 weeks after activation of KRasG12D either without (control) or with (tamoxifen) Myc deregulation for the final 6 weeks. Dotted lines in top panels highlight “inflamed” regions. Boxed regions in the top row images are enlarged in the second row of panels, and boxed regions in the middle panels are further enlarged in the bottom row. T = tumor. Black arrows indicate palisades of migratory tumor cells. Scale bars are representative for rows of panels. (B–D) Representative immunostaining for the pan-leukocyte marker CD45 (B), the proliferation marker Ki67 (C) and the endothelial cell marker CD31 (D) of lung sections 12 weeks after activation of KRasG12D either with (tamoxifen) or without (control) Myc deregulation for the final 6 weeks. Higher magnifications of the boxed areas are shown in the panels immediately below. T = tumor. Results shown in (C) and (D) are from serial sections. Scale bars are representative for rows of panels. (E) Quantification analysis of Ki67 and CD31 immunostaining of lung sections 12 weeks after activation of KRasG12D without (6 wks oil) or with (6 wks tam) Myc activated for the last 6 weeks. FoV = field of view. n = 30 individual tumors (small symbols) from 6 total mice (large symbols) per time point. Error bars represent the median with interquartile range. p values are based on Student’s t test. ∗∗∗∗p < 0.0001. See also Figures S1 and S2.
Figure S1
Figure S1
Schematic Representations of Animal Experiments, Related to Figures 1, 2, 3, 4, 5, 6, and 7 (A) Related to Figures 1 and S2. Analysis of long-term co-operation between KRasG12D and MycERT2. I, II and III denote three different regimens, each with a different time points of activation of MycERT2 (0, 6 and 12 weeks) post-AdV-Cre activation of KRasG12D. (B) Related to Figures 2, 4, and S3. Analysis of short-term MycERT2 activation in KRasG12D-driven KM mouse lungs. 12 weeks after AdV-Cre activation of KRasG12D in KM mice, MycERT2 was co-activated for 1, 3 or 7 days. (C) Related to Figures 3 and S4. Analysis of the impact of individual or co-blocking CCL9 and/or IL23p19 on MycERT2-driven KM lung tumor progression. 14 weeks after AdV-Cre treatment, and commencing one day prior to tamoxifen injection, mice were injected every other day for 4 days with neutralizing antibodies against either IL23p19 or CCL9 or both IL23p19 and CCL9, then euthanized. (D) Related to Figures 3 and S4. Analysis of the impact of long-term co-blocking CCL9 and/or IL23p19 on MycERT2-driven KM lung tumor progression. 12 weeks after AdV-Cre treatment, and commencing one day prior to tamoxifen injection, mice were injected every other day for 7 days with neutralizing antibodies against both IL23p19 and CCL9, then euthanized. (E) Related to Figure 4. Analysis of the impact of PD-L1 antibody blockade on MycERT2-driven KM lung tumor progression. 12 weeks after AdV-Cre administration, and commencing one day prior to tamoxifen injection to activate MycERT2, mice were injected every two days for two weeks with either PD-L1 neutralizing antibodies or IgG control. (F) Related to Figures 5 and S5. Analysis of short-term MycERT2 de-activation in KM lung tumors. 6 weeks after AdV-Cre activation of KRasG12D in KM mice, MycERT2 was co-activated for 6 weeks and then de-activated for 0, 1, 3 and 7 days. (G) Related to Figure 6. Analysis of the impact of short-term activation and short-term de-activation of MycERT2 in KRasG12D+Myc-driven KM lung tumors. 12 weeks after AdV-Cre activation of KRasG12D in KM mice, MycERT2 was co-activated for 1 week and then de-activated for 3 or 7 days. (H) Related to Figure 6. Analysis of the impact of short-term activation followed by long-term de-activation of MycERT2 in KRasG12D+Myc-driven KM lung tumors. 12 weeks after AdV-Cre activation of KRasG12D in KM mice, MycERT2 was co-activated for 1 week and then de-activated for up to 4 weeks. (I) Related to Figures 7 and S6. Analysis of the absence of T or NK cells during short-term de-activation of MycERT2 in KRasG12D+Myc-driven KM lung tumors. 12 weeks after AdV-Cre treatment, and starting four days prior to tamoxifen injection, KM mice were injected every other day for four cycles with neutralizing antibodies against CD8 (or IgG control) and every four days for two cycles (at −4 and 0 day time points) with neutralizing antibodies against CD4 (or IgG control), or every other day for four cycles with neutralizing antibodies against NKp46 (anti-asialo-GM1) then sacrificed one day after the last antibody injection coincident with day 3 post MycERT2.
Figure S2
Figure S2
Deregulated Myc Cooperates Oncogenically with KRasG12D at All Stages of Lung Adenoma Evolution, Related to Figure 1 (A) Representative H&E staining of lung sections harvested at 6, 12 and 18 weeks after AdV-Cre inhalation, without (oil control) or with (+ tamoxifen) Myc co-activation for the final 6 weeks, as indicated. Groups I, II and III refer to the three different experimental protocols depicted in Figure S1A. Scale bars apply to each column of panels. (B) Quantification of tumor burden in lungs of mice from Groups I, II and III, as described above. Each individual data point represents a single mouse. Group I: n = 6 mice. Group II: n = 10 mice. Group III: n = 9 (oil) and 10 (Tam) mice. (C) Kaplan-Meier survival plot of KRasG12D-driven tumor-bearing mice (12 weeks post KRasG12D activation) then treated for 6 weeks with either oil (control) or Tamoxifen to activate Myc. n = 10 (oil) and 14 (Tam) mice. (D) Representative H&E staining of lung sections comparing the tumorigenic impact of Myc alone (left), KRasG12D alone (middle) and Myc and KRasG12D together (right). AdV-Cre was administered by inhalation to each of the depicted genotypes (mentioned below the panels) and lungs harvested 12 weeks later. Left - Myc alone, activated for final 6 weeks; middle - KRasG12D alone (oil control), right – KRasG12D plus Myc co-activated for final 6 weeks (tamoxifen treatment). Scale bars apply to each row of panels. Error bars represent the median with interquartile range. P values are based on Student’s t test (B) or Log-rank test (C). p < 0.05, ∗∗∗∗p < 0.0001.
Figure 2
Figure 2
Deregulation of Myc in Epithelial Adenoma Cells Immediately Re-programs the Tumor Stroma (A) Quantitative and representative immunohistochemical analysis of Ki67 expression at indicated time points (0, 1, 3, and 7 days) after activation of Myc (tam) compared to KRasG12D-only (oil-treated control). Boxed regions are magnified below. Scale bars apply across each row. (B) Quantification and representative immunostaining for the activated macrophage marker CD206, the T cell marker CD3, and the NK cell marker NKp46 on sections of KRasG12D-driven adenomas at indicated time points after Myc activation (tamoxifen). Two representative individual tumors from serial sections are shown for CD206 and CD3, and quantitation is restricted to the areas within tumor boundaries. Boxed regions are shown at higher magnification directly below. NK cells cluster principally in juxta-tumoral tertiary lymphoid structures (TLSs), and/or adjacent to large tumor-associated blood vessels (V) and airways (A). Hence, quantitation of NK cells includes both tumor area and tumor-associated vasculature and TLSs. For NK cell staining (NKp46), lung regions with multiple tumors are shown and higher magnifications of boxed regions are displayed as insets. Arrows indicate NK cells occupying tertiary lymphoid structure (or part thereof) or residing next to tumor-associated blood vessel and/or airway. T = tumor. (C) Quantification and representative immunostaining using the endothelial cell marker CD31 (top two rows) in lung tumor tissue isolated from mice described in (A). Grayscale insets are magnified from the panels immediately above. (Third row) Visualization of vascular integrity and permeability in tumors—using fluorescein isothiocyanate (FITC)-conjugated Lycopersicon esculentum lectin (green), which binds to the luminal surface of all blood vessels, and rhodamine-conjugated Ricinus communis agglutinin I (red), which binds to the endothelial basement membrane only of leaky nascent vessels—at indicated time points after Myc activation (tamoxifen). (Bottom row) Tumor hypoxia assessed by hypoxyprobe immunostaining. Black arrows indicate hypoxic regions. Scale bars apply across each row. Quantification graphs: FoV = field of view. n = 30 individual tumors (small symbols) from 6 mice (large symbols) per time point. Error bars represent the median with interquartile range (Ki67, CD206, CD3, CD31) or mean ± SD (NKp46). p values are based on Student’s t test (Ki67, CD206, CD3, CD31) or two-way ANOVA (NKp46). NS = non-significant; p < 0.05, ∗∗∗p < 0.001, ∗∗∗∗p < 0.0001. See also Figures S1, S3, and S7.
Figure S3
Figure S3
Deregulated Myc Rapidly Re-programs Tumor Immunity, Related to Figure 2 (A) Quantification and representative immunostained images for B lymphocytes (anti-B220 aka CD45R) in mice treated with tamoxifen for 3 days. (B) Quantification (by flow cytometry) of NKp46 positive cells as percentage of total live cells isolated from tumor-laden whole lungs of mice treated with oil (KRasG12D-only) or 3 days tamoxifen (+ Myc). n = 6 mice per time point. (C) Quantitative analysis (left) and representative immunostaining (right) of NK cell-activating signals showing rapid upregulation of the NKG2D-ligand Rae-1 (PAN Rae-1 antibody) and downregulation of MHC Class I on lung tumor cells following Myc activation. Bottom panels show MHC Cass I expression on adjacent normal lung epithelium (closed arrows). Scale bars apply across each row. (D) Quantification of hypoxyprobe staining shown in Figure 2C (bottom row), confirming rapid transition from hypoxia to normoxia in adenomas following Myc activation. (E) Immunohistochemistry and immunofluorescence analysis of serial sections of paraffin-embedded lung tumors of KM mice showing concordance of CD206 and F4/80 immunostaining. KM mice were treated for three days with Tamoxifen, lung tissue harvested and serial sections taken for immunostaining. Top row: representative Immunostaining for macrophage marker CD206 with boxed region enlarged immediately to the right. Bottom row: Immunofluorescence staining for macrophage marker F4/80 with boxed region enlarged immediately to the right. Inset in bottom right panel shows non-overlap of staining for F4/80 and for the epithelial cell marker TTF1. Right large panel: overlay of Immunofluorescence F4/80 and immunohistochemistry of CD206 showing overlap. (F) Epithelial fluorescence in situ hybridization of MycERT2 (red) combined with immunofluorescence for lung macrophage CD206 (green). Representative pictures are shown. Left panels: KRasG12D-only mice (K) mice express no detectable MycERT2 whereas KM mice show clear MycERT2 nuclear staining confined to tumor masses that is independent of MycERT2 activation (tamoxifen treatment). Right Panels: I and II and their progressive enlargements show MycERT2 expression is specific to tumor cells and absent from normal lung epithelial cells. Dotted line indicates tumor boundary. III and IV confirm absence of any detectable MycERT2 in CD206+ macrophages. (G) MycERT2 RNA expression in F4/80-affinity isolated lung macrophages in KM mice 16 weeks post AdV-CRE. Results are normalized to the average of the F4/80- fraction. n = 6 mice per fraction (F4/80- versus F4/80+). Quantification graphs: FoV = Field of View. (A): n = 30 individual tumors (small symbols) from 6 mice (large symbols) per time point. (C): n = 4 mice per time point, n = 20 tumors analyzed; 5 per mouse. (D): n = 6 mice per time point, n = 30 tumors analyzed; 5 per mouse. Error bars represent the median with interquartile range (B220, NKp46) or mean ± SD (Rae-1, Hypoxyprobe). P values are based on Student’s t test (B220, NKp46) or two-way ANOVA (Rae-1, Hypoxyprobe). p < 0.05, ∗∗p < 0.01, ∗∗∗∗p < 0.0001.
Figure 3
Figure 3
IL-23 and CCL9 Mediate Myc-Induced Remodeling of Lung Tumor Stroma (A) Representative inflammation antibody arrays probed with whole-lung protein lysates from mice treated for 8 hr with oil (control) or tamoxifen to activate Myc. (B) Quantification of IL12p40/70 and CCL9 signals derived from arrays shown in (A). Each individual data point represents a single mouse. (C) Quantification and representative examples of immunostaining for CD206, CD3, CD31, NKp46, B220, Ki67, and TUNEL after Myc activation for 3 days in mice sham treated (IgG control), treated with either IL23p19- or CCL9-blocking antibodies, or co-treated with both IL23p19- and CCL9-blocking antibodies. Boxed areas in each image are shown enlarged in the panels directly below. Scale bars apply across each row. (D) Quantification of tumor cell proliferation (Ki67, left) and cell death (TUNEL, right) after Myc activation for 7 days (with tamoxifen) in mice co-treated with either IgG control or co-treated with IL23p19- and CCL9-blocking antibodies. (E) Quantification of fold change in tumor cell death (TUNEL) and proliferation (Ki67) (left) and tumor burden (right) after Myc activation for 7 days (with tamoxifen) in mice co-treated with either IgG control or co-treated with IL23p19- and CCL9-blocking antibodies. Quantification graphs: FoV = field of view. Small symbols = individual tumors, large symbols = average per mouse. (C) n = 4 mice and n = 25–35 tumors (individual anti-IL23p19 or anti-CCL9 treatment) or n = 5 mice and n = 30–50 tumors (IgG control or anti-IL23p19 and anti-CCL9 co-treated). (D) n = 30 tumors from 6 mice treatment point. (E) n = 6 mice per treatment group. Error bars represent the median with interquartile range. p values are based on Student’s t test (CD206, CD3, CD31, B220, Ki67, TUNEL) or two-way ANOVA (NKp46). NS = non-significant; p < 0.05, ∗∗p < 0.01, ∗∗∗p < 0.001, ∗∗∗∗p < 0.0001. See also Figures S1, S4, and S7.
Figure S4
Figure S4
Myc Induces IL-23 and CCL9 in the Epithelial Compartment of Lung Adenomas and Their Continued Expression Is Required to Maintain an Immune-Suppressed Phenotype, Related to Figure 3 (A) Representative immunostaining showing induction of IL23p19 and CCL9 following activation of Myc (3d tam), compared to KRasG12D-only control (3d oil). Scale bars apply to panels in each column. (B) Immunofluorescence analysis showing coincident staining of Myc-induced cell-surface IL23p19 and cytoplasmic CCL9 with the bronchoalveolar nuclear marker TTF1 in tumors following activation of MycERT2 (3d tamoxifen), compared to KRasG12D-only control (3d oil control). Insets show magnified images of each boxed region. White arrows indicate cells negative for both TTF1 and IL23p19 (top row) or both TTF1 and CCL9 (bottom row). (C) Quantification of immunostaining for lung tumor macrophages (CD206), vascular endothelial cells (CD31+), T cells (CD3+), B cells (B220+) and NK (NKp46+) cells after Myc activation for 7 days in mice coincidentally treated either with control (IgG) or co-treated with IL23p19- and CCL9-blocking antibodies. FoV = Field of View. n = 30 individual tumors (small symbols) from 6 mice (large symbols) per treatment group. Error bars represent the median with interquartile range. P values are based on Student’s t test (CD206, CD31, CD3, B220) or two-way ANOVA (NKp46). ∗∗p < 0.01, ∗∗∗p < 0.001, ∗∗∗∗p < 0.0001.
Figure 4
Figure 4
Macrophages Mediate Myc-Induced Angiogenesis and T Cell Exclusion (A) Coincident immunostaining of Meca32 and receptor-bound VEGF (VEGF:VEGFR2) in tumors at indicated time points (1, 3, and 7 days) after activation of Myc by tamoxifen treatment compared to KRasG12D-only (control). Inset shows enlargement of regions boxed in white. Scale bars apply across each row. (B) Quantitative RT-PCR for VEGFA and PD-L1 mRNA in F4/80+ macrophages and F4/80 lung cells derived from whole tumor-laden lungs following 3 days Myc activation (tam) versus to KRasG12D-only control (3d oil). (C) Immunofluorescence analysis of F4/80 and PD-L1 in lung tumors following Myc activation. Scale bar applies to both large panels. White arrows indicate F4/80+ cells. (D) Immunostaining and respective quantification of PD-L1-positive macrophages in tumors after Myc activation for indicated time points (tamoxifen). T = tumor. Scale bars apply across each row. (E) Quantification of immunohistochemical analysis for CD3, B220, CD206, NKp46, CD31, and Ki67 of lung tumors after Myc activation for 2 weeks concurrently with systemic treatment of PD-L1 blocking antibody compared to KRasG12D-only tumors (oil control). (F) H&E staining (left) and quantification (right) of lung tumor burden in mice treated concurrently with tamoxifen (to activate Myc) and either control IgG or PD-L1-blocking antibody. Each individual data point represents a single mouse (n = 6 mice per group). Quantification graphs: FoV = field of view. Small symbols = individual tumors, large symbols = average per mouse. (B) Each individual data point represents a single mouse. n = 5 (F4/80; VEGFA), or 6 (F4/80+; VEGFA, PD-L1), and shows the expression data normalized to the average of the respective oil control. (D) n = 20 individual tumors from 4 mice per treatment group. Error bars represent the median with interquartile range. (E) n = 30 individual tumors from 6 mice per treatment group. Error bars represent the median with interquartile range (CD3, CD206, B220, CD31, Ki67) or mean ± SD (NKp46). p values are based on Student’s t test (CD3, B220, CD206, CD31, Ki67) or two-way ANOVA (NKp46). NS = non-significant; p < 0.05, ∗∗p < 0.01, ∗∗∗p < 0.001, ∗∗∗∗p < 0.0001. See also Figures S1 and S7.
Figure 5
Figure 5
Myc De-activation Triggers Immediate Collapse of Myc-Induced Stroma Together with Tumor Regression (A) Quantification of immunostaining for Ki67, CD206, CD3, NKp46, and TUNEL in adenocarcinomas at indicated times after Myc de-activation (off tam) compared to Myc activation for 6 weeks (6w tam). (B) (Left) Representative lung lobes of tumor load 7 days after Myc de-activation (6w tamoxifen treatment versus 7d off tamoxifen). Higher magnification of boxed regions in panel to their right. (Right) Quantification of lung tumor burden in mice treated with tamoxifen for 6 weeks (6w tam) followed by withdrawal of treatment for 7 days (7d off). (C) Quantification and representative CD31 immunostaining at indicated times following Myc de-activation (off tam) compared to Myc activation for 6 weeks (6w tam). Boxed areas in each image are shown enlarged in the panels directly below. Scale bars apply across each row. Quantification graphs: FoV = field of view. (A and C) n = 30 individual tumors (small symbols) from 6 mice (large symbols) per time point. (B) 6 mice per time point. Error bars represent the median with interquartile range (Ki67, CD206, CD3, TUNEL) or mean ± SD (NKp46). p values are based on Student’s t test (Ki67, CD206, CD3, TUNEL) or two-way ANOVA (NKp46). p < 0.05, ∗∗p < 0.01, ∗∗∗p < 0.001, ∗∗∗∗p < 0.0001. See also Figures S1 and S5
Figure S5
Figure S5
Myc De-activation Immediately Reverses Normoxia in KM Lung Tumors, Related to Figure 5 Quantification of immunostaining for Hypoxyprobe in adenocarcinomas at indicated times after Myc de-activation (6w tam versus 1, 3, 7 days off). FoV = Field of View. n = 4 mice and n = 20 tumors per time point; 5 tumors were analyzed per mouse. Error bars represent mean ± SD. P values are based on two-way ANOVA. NS = non-significant, ∗∗∗p < 0.001, ∗∗∗∗p < 0.0001.
Figure 6
Figure 6
Dependency on Myc is Rapidly Acquired by Lung Adenocarcinomas (A) Representative immunostaining for Ki67, CD206, TUNEL (white arrows), and CD31 in adenocarcinomas at indicated time points following Myc activation for 7 days (7d tam) and subsequent de-activation (7d tam, then 7d off) compared to KRasG12D-only (control). The tumor edges boxed in the top panels are shown enlarged below. Scale bars apply across each row. (B) Quantification of histological changes in Ki67, CD206, TUNEL, CD3, and NKp46 in lung tumors after short term (7d tam) Myc-activation and subsequent Myc de-activation for 3 and 7 days (3d, 7d off) compared to KRasG12D-only control (7d oil). (C) Fold change in tumor cell proliferation (Ki67) and death (TUNEL) in mice treated with oil (control) or with tamoxifen for 7 days followed by tamoxifen withdrawal for 3 or 7 days. Individual and average values of tumor cell death and proliferation are displayed in (B). (D) Representative H&E staining of part of and whole lung lobes together with corresponding quantification of total tumor burden (left y axis) and tumor multiplicity (right y axis) in lungs of mice treated with tamoxifen for 7 days followed by Myc de-activation for either 7 days or 4 weeks (7d, 4w off) and compared to KRasG12D-only control (7d oil). T = tumor. Quantification graphs: FoV = field of view. (B): n = 25 individual tumors (small symbols) from 5 mice (large symbols) per time point. (D) Each individual data point represents a single mouse (n = 8 mice per group). Box and whisker graphs represent tumor multiplicity of 8 mice per group. Error bars represent the median with interquartile range (Ki67, CD206, TUNEL, CD3) or mean ± SD (NKp46). p values are based on Student’s t test (Ki67, CD206, TUNEL, CD3) or two-way ANOVA (NKp46). NS = non-significant; p < 0.05, ∗∗p < 0.01, ∗∗∗p < 0.001, ∗∗∗∗p < 0.0001. See also Figure S1.
Figure 7
Figure 7
Depletion of NKp46+ Cells, but Not of CD4+ and CD8+ T Cells, Retards Tumor Regression following Myc De-activation (A) Flow cytometric quantification of CD3+, CD4+, and CD8+ T cells and NKp46+ NK cells in spleen and blood after systemic administration of, respectively, CD4/CD8 (left)- or asialo-GM1 (right)-blocking antibodies in mice up to 3 days after 7 days of tamoxifen (Myc on) treatment. Representative flow profiles of spleen CD3+/CD4+, CD3+/CD8+, NKp46+, and CD3+ cells are shown. (B) (Left) Quantitation of immunostaining for CD3+ T cells in tumors after 7 days Myc activation (7d tam, red squares) then following 3 days Myc de-activation in IgG control-treated mice (black circles) versus mice treated with αCD4/αCD8 antibody (black squares). Bottom panel shows representative immunohistology. Arrows depict CD3+ T cells. T = tumor. Right: Quantification of immunostaining for NKp46+ NK cells in tumors after 7 days Myc activation (7d tam), then following 3 days Myc de-activation in IgG control-treated mice versus mice treated with α-asialo-GM1. Bottom panel shows representative examples of the immunohistology. A = airway. T = tumor. (C) (Left) Quantification and representative immunostaining for tumor cell death (TUNEL) following Myc de-activation for 3 days in tumors in CD4+/8+ T cell competent (IgG-control) versus CD4+/8+ T cell-deficient mice (αCD4/αCD8). Right: Quantification and representative immunostaining for cell death (TUNEL) following Myc de-activation for 3 days in NKp46+ NK cell-competent (IgG-control) versus NKp46+ NK cell-deficient mice (α-asialo-GM1 treated). Quantification graphs: FoV = field of view. Small symbols = individual tumors, large symbols = average per mouse. (A) n = 4 (IgG) or 5 (αCD4/αCD8 or α-asialo-GM1). (B) n = 20 or 25 individual tumors from 4 (7d Tam, IgG) or 5 (αCD4/αCD8) mice per time point, respectively. (C) n = 5 mice per treatment group. n = 30 individual tumors from 5 mice per treatment group. Error bars represent the median with interquartile range (CD3, TUNEL) or mean ± SD (NKp46). p values are based on Student’s t test (CD3, TUNEL) or two-way ANOVA (NKp46). NS = non-significant. p < 0.05, ∗∗p < 0.01, ∗∗∗p < 0.001, ∗∗∗∗p < 0.0001. See also Figures S1, S6, and S7.
Figure S6
Figure S6
Depletion of NKp46+ Cells, but Not of CD4+ and CD8+ T Cells, Retards Reversion of Myc-Driven Tumor Stromal Changes following Myc De-activation, Related to Figure 7 (A) Quantification of immunostaining for proliferation (Ki67), CD206+ macrophages and NK cells (NKp46) following Myc de-activation for 3 days in KM tumors of either CD4+/CD8+ T cell competent animals (IgG-control) or CD4+/8+ T cell-deficient (αCD4/αCD8-treated) mice compared to 7 days of Myc activation (7d tam). No significant differences in IgG control versus T cell depleted animals are evident. (B) Quantification of immunostaining for proliferation (Ki67), CD206+ macrophages and T cells (CD3) following Myc de-activation for 3 days in KM tumors of either NKp46+ NK cell competent animals (IgG-control) or NKp46+ NK cell-deficient (α-asialoGM1-treated) mice. No significant differences in IgG control versus NK-cell depleted animals are evident for proliferation (Ki67) or T cells (CD3). In contrast, NK-cell depleted animals show reduced CD206 efflux following Myc de-activation. Quantification graphs: FoV = Field of View. (A): n = 20-25 individual tumors (small symbols) from 4 (7d Tam, IgG, large symbols) or 5 (αCD4/αCD8) mice per treatment group. (B): n = 25-30 individual tumors (small symbols) from 5 mice (large symbols) per treatment group. Error bars represent the median with interquartile range (Ki67, CD206, CD3) or mean ± SD (NKp46). P values are based on Student’s t test (Ki67, CD206, CD3) or two-way ANOVA (NKp46). NS = non-significant, p < 0.05, ∗∗p < 0.01, ∗∗∗p < 0.001.
Figure S7
Figure S7
Myc Instructs Stromal Changes in Lung Adenomas, Related to Figures 2, 3, 4, and 7 Schematic representation of Myc-induced stromal changes in lung adenocarcinoma. Activation of deregulated Myc in epithelial KRasG12D-driven lung adenoma cells rapidly leads to efflux of B, T and NK lymphocytes and recruitment of macrophages. Myc-induced IL-23 promotes efflux of B, T and NK cells whereas Myc-dependent CCL9 recruits macrophages. The macrophages stimulate angiogenesis via overt VEGF production and repel T cells via surface expression of PD-L1. Myc-dependent tumor progression requires IL-23 and CCL9 signaling to NK cells and macrophages, respectively. De-activation of deregulated Myc in established KRasG12D-Myc adenocarcinomas leads to the rapid reversal of these stromal changes, tumor cell death and regression.

References

    1. Aggarwal N.R., King L.S., D’Alessio F.R. Diverse macrophage populations mediate acute lung inflammation and resolution. Am. J. Physiol. Lung Cell. Mol. Physiol. 2014;306:L709–L725. - PMC - PubMed
    1. Alexander W.S., Adams J.M., Cory S. Oncogene cooperation in lymphocyte transformation: malignant conversion of E mu-myc transgenic pre-B cells in vitro is enhanced by v-H-ras or v-raf but not v-abl. Mol. Cell. Biol. 1989;9:67–73. - PMC - PubMed
    1. Ancrile B.B., O’Hayer K.M., Counter C.M. Oncogenic ras-induced expression of cytokines: a new target of anti-cancer therapeutics. Mol. Interv. 2008;8:22–27. - PMC - PubMed
    1. Andres A.C., van der Valk M.A., Schönenberger C.A., Flückiger F., LeMeur M., Gerlinger P., Groner B. Ha-ras and c-myc oncogene expression interferes with morphological and functional differentiation of mammary epithelial cells in single and double transgenic mice. Genes Dev. 1988;2:1486–1495. - PubMed
    1. Bailey S.R., Nelson M.H., Himes R.A., Li Z., Mehrotra S., Paulos C.M. Th17 cells in cancer: the ultimate identity crisis. Front. Immunol. 2014;5:276. - PMC - PubMed

MeSH terms