. 2017 Nov 30;171(6):1340-1353.e14.
doi: 10.1016/j.cell.2017.11.015.

An Unexpectedly Complex Architecture for Skin Pigmentation in Africans

Affiliations

An Unexpectedly Complex Architecture for Skin Pigmentation in Africans

Alicia R Martin et al. Cell. .

Abstract

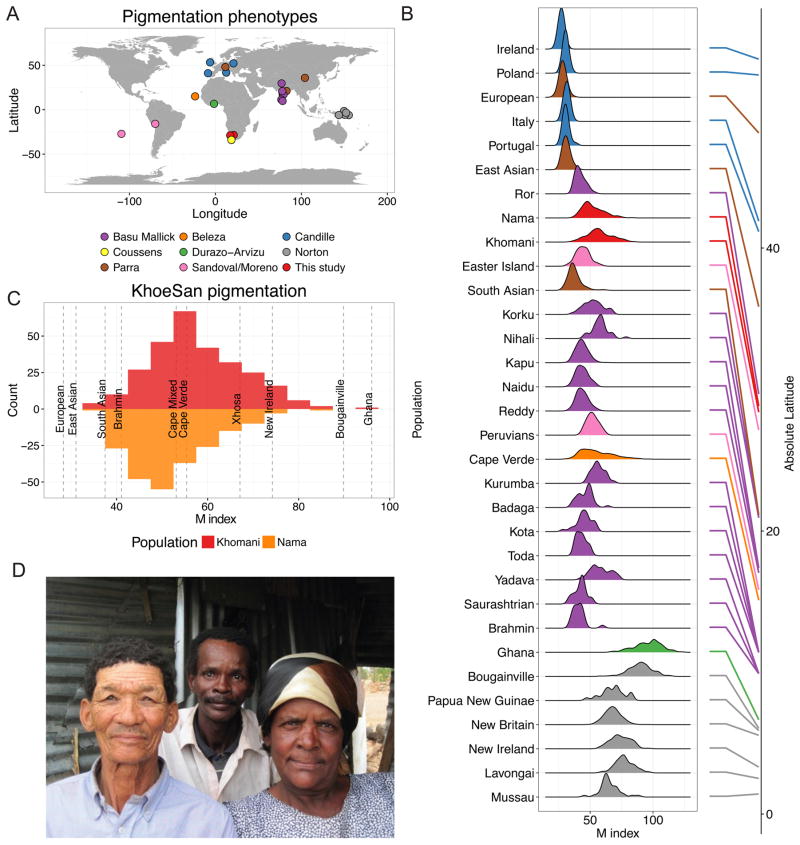
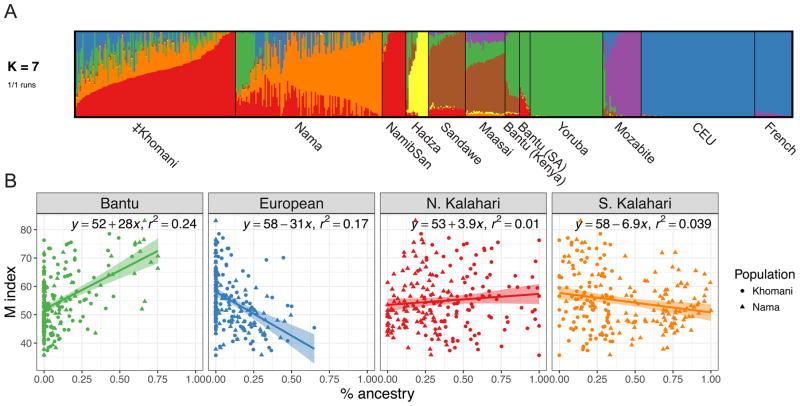
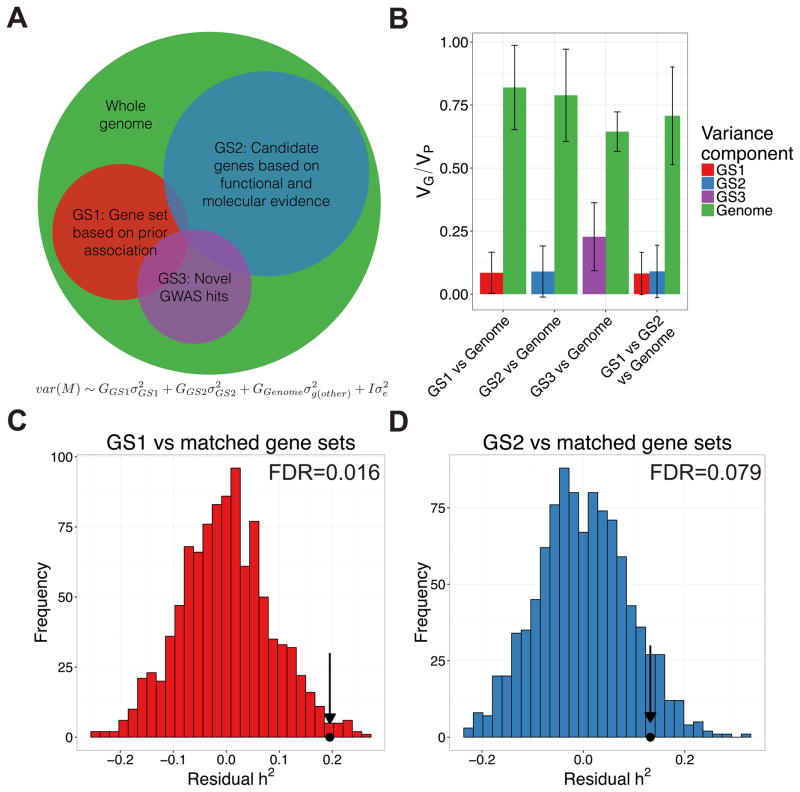
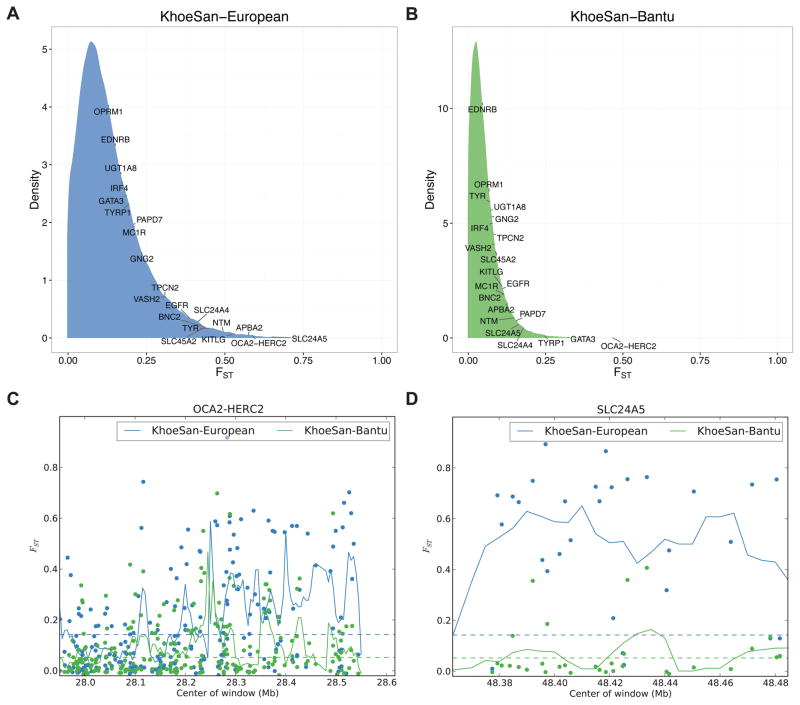
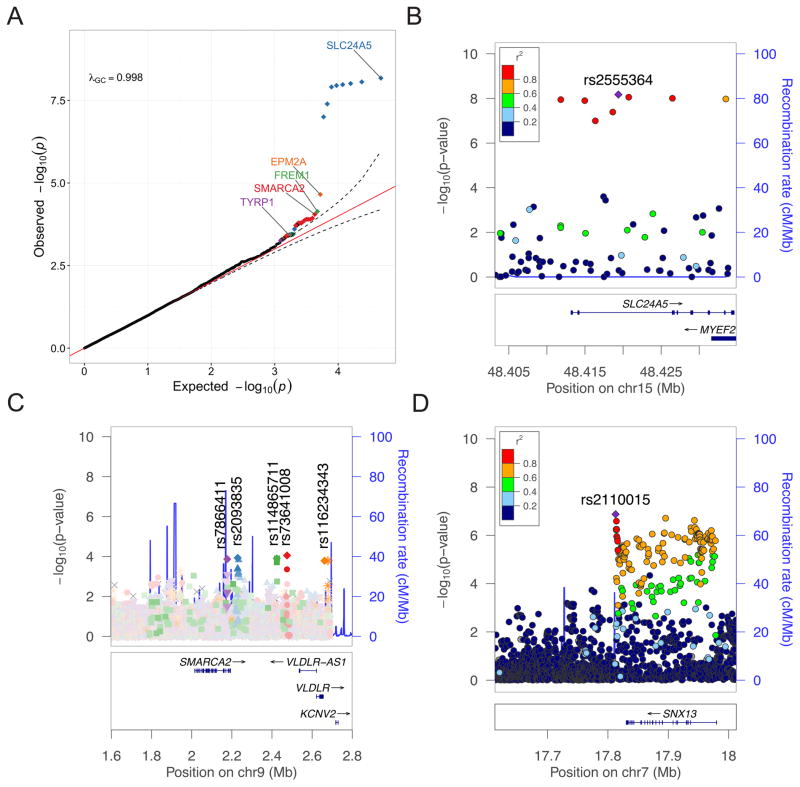
Approximately 15 genes have been directly associated with skin pigmentation variation in humans, leading to its characterization as a relatively simple trait. However, by assembling a global survey of quantitative skin pigmentation phenotypes, we demonstrate that pigmentation is more complex than previously assumed, with genetic architecture varying by latitude. We investigate polygenicity in the KhoeSan populations indigenous to southern Africa who have considerably lighter skin than equatorial Africans. We demonstrate that skin pigmentation is highly heritable, but known pigmentation loci explain only a small fraction of the variance. Rather, baseline skin pigmentation is a complex, polygenic trait in the KhoeSan. Despite this, we identify canonical and non-canonical skin pigmentation loci, including near SLC24A5, TYRP1, SMARCA2/VLDLR, and SNX13, using a genome-wide association approach complemented by targeted resequencing. By considering diverse, under-studied African populations, we show how the architecture of skin pigmentation can vary across humans subject to different local evolutionary pressures.

Keywords: Africa; heritability; human evolution; pigmentation; population genetics.


Figures

Figure 1
Figure 1. Distributions of baseline pigmentation in globally diverse populations
A) Sample locations of skin pigmentation datasets where phenotypes were measured with a DSM I or DSM II. B) Violin plots of pigmentation distributions for 32 populations from 8 studies ordered by latitude; absolute latitudes provided on the right. Corresponding datasets are colored as in A). Table S1 provides summary statistics for each population. M indices are reflectance measures that approximate melanin content. C) A comparison of skin pigmentation distributions in ‡Khomani (top) and Nama populations (bottom). Dashed grey lines and labels indicate mean M index for the indicated other global populations. D) South African individuals in a household that exemplify the substantial skin pigmentation variability in the ‡Khomani and Nama populations. Picture taken with consent for publication. See also Table S1.
Figure 2
Figure 2. Ancestry components in the KhoeSan and association with pigmentation
A) ADMIXTURE proportions at k=7 for the ‡Khomani and Nama populations, using Namibian San, Hadza, Sandawe, Maasai, Kenyan Bantu, South African (SA) Bantu, Yoruba, Mozabite, Central Europeans (CEU), and French populations as a reference panel B) Associations between substantial k ancestry clusters and average melanin (M index) baseline pigmentation value in the combined ‡Khomani and Nama populations. The Bantu and European components each constitute ≥ 5% of the total KhoeSan ancestry on average and have significant associations in the best multivariate model (p <0.05). See also Figure S2 and Table S2.
Figure 3
Figure 3. Partitioned heritability across known and novel gene sets
Heritable variation in KhoeSan pigmentation is partially explained by previously associated loci, newly associated loci, and candidate genes discovered in divergence studies of other populations, and in animal models. A) Schema illustrating how heritability analyses were used to partition the phenotypic variance explained by candidate gene sets (GS1, GS2) and novel associations (GS3) compared to the rest of the genome. B) Variance components analysis in GCTA comparing pigmentation variability explained by GS1, GS2, and the rest of the genome. Error bars span ± 1 standard error. C) Heritability explained by estimated value observed in our data (dot and arrow) versus matched null distribution in the ‡Khomani and Nama after accounting for number of SNPs in GS1 gene sets containing 14 genes previously associated with skin pigmentation in other populations. D) As in C), where GS2 = gene set from Table S4 of (Beleza et al., 2013) compiled based on pigmentation function. See also Figure S3.
Figure 4
Figure 4. Genetic divergence in genes previously associated with pigmentation
A–B) Distribution of weighted FST in 20 kb moving windows of SNPs across the genome with a step size of 5 kb. Labels indicate where the maximal FST window from each canonical pigmentation gene lies in the distribution. Divergence depicted is between A) the KhoeSan and Europeans, and B) the KhoeSan and West African populations. C–D) FST in canonical pigmentation genes. Dots indicate SNPs, lines indicate moving averages over 20 kb windows with a step size of 5 kb. Canonical pigmentation loci/genes are shown as: C) the OCA2-HERC2 locus, and D) the SLC24A5 gene.
Figure 5
Figure 5. Associations between genetic data and baseline pigmentation
A) Targeted resequencing QQ plot. 95% confidence interval on the QQ plot is drawn assuming the jth order statistic from a uniform sample follows a Beta(j, nj + 1) distribution. Colors differentiate loci containing more than one variant associated more significantly than the 95% confidence interval in a region. B–C) LocusZoom plots of targeted resequencing genetic associations incorporating KhoeSan-specific LD. Recombination rates are from HapMap b37. Regions include: B) SLC24A5, and C) 5 independent signals associated with p < 1e-3 in/near SMARCA2 and VLDLR. D) LocusZoom plot of suggestive association in/near SNX13 from meta-analysis of phase 1 and phase2 imputed associations with KhoeSan-specific LD. See also Figure S6, Table S5, Table S7, and Table S6B.

Comment in

References

    1. Almasy L, Blangero J. Multipoint Quantitative-Trait Linkage Analysis in General Pedigrees. The American Journal of Human Genetics. 1998;62:1198–1211. - PMC - PubMed
    1. Altshuler DM, Gibbs RA, Dermitzakis E, Peltonen L, Dermitzakis E, Bonnen PE, de Bakker PIW, Deloukas P, Gabriel SB, Gwilliam R, et al. Integrating common and rare genetic variation in diverse human populations. Nature. 2010;467:52–58. - PMC - PubMed
    1. Barton NH. Clines in polygenic traits. Genet Res. 1999;74:223–236. - PubMed
    1. Basu Mallick C, Iliescu FM, Möls M, Hill S, Tamang R, Chaubey G, Goto R, Ho SYW, Gallego Romero I, Crivellaro F, et al. The Light Skin Allele of SLC24A5 in South Asians and Europeans Shares Identity by Descent. PLoS Genet. 2013;9:e1003912. - PMC - PubMed
    1. Beleza S, Johnson NA, Candille SI, Absher DM, Coram MA, Lopes J, Campos J, Araújo II, Anderson TM, Vilhjálmsson BJ, et al. Genetic Architecture of Skin and Eye Color in an African-European Admixed Population. PLoS Genet. 2013;9:e1003372–15. - PMC - PubMed