. 2017 Nov;88(11):113307.
doi: 10.1063/1.4986043.

The nanopore mass spectrometer

Affiliations

The nanopore mass spectrometer

Joseph Bush et al. Rev Sci Instrum. 2017 Nov.

Abstract

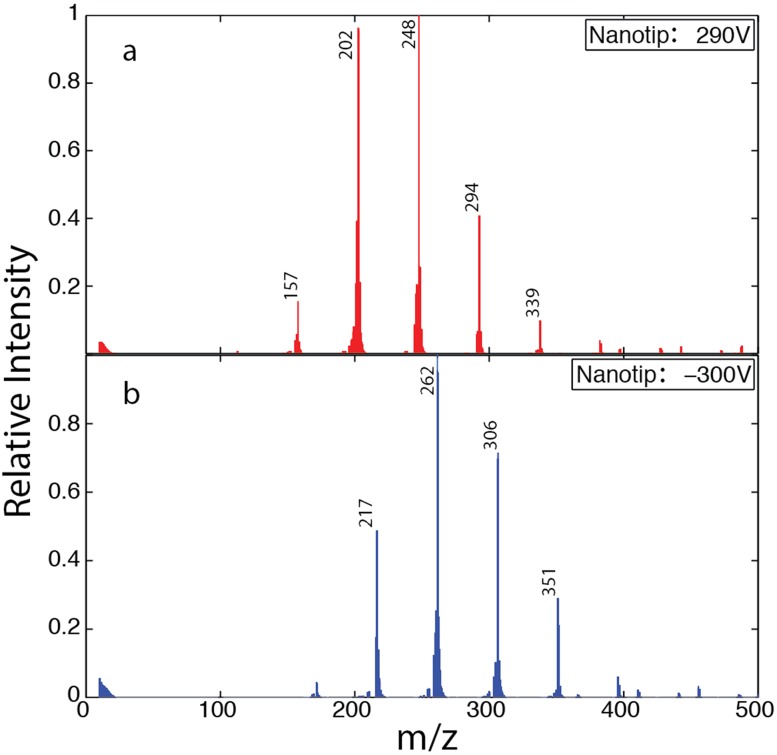
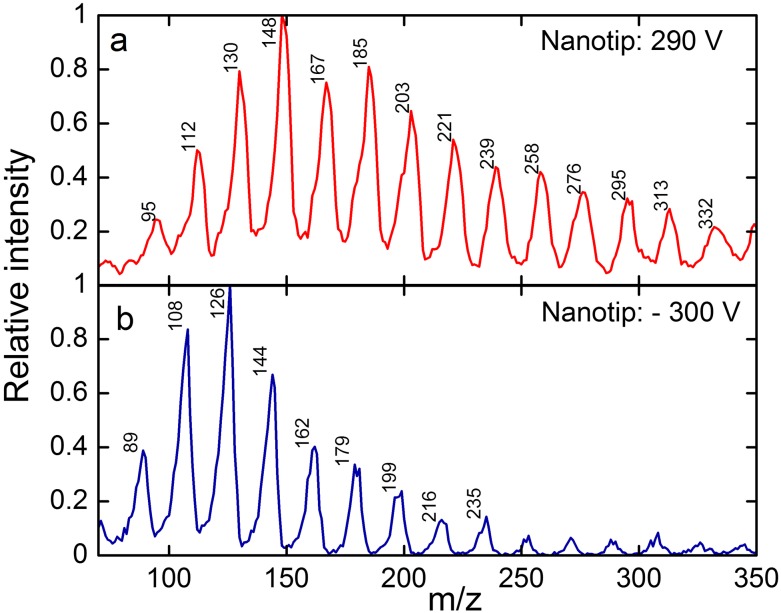
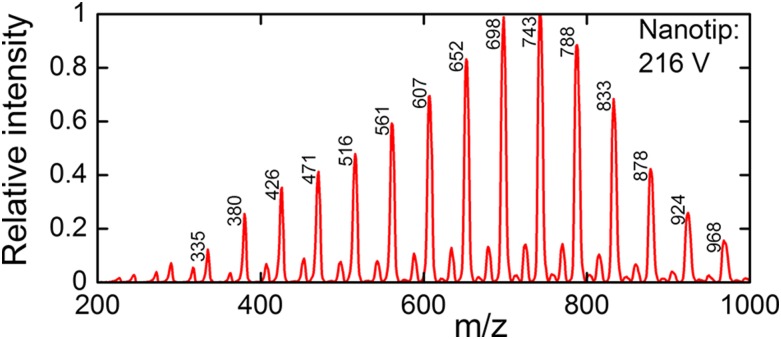
We report the design of a mass spectrometer featuring an ion source that delivers ions directly into high vacuum from liquid inside a capillary with a sub-micrometer-diameter tip. The surface tension of water and formamide is sufficient to maintain a stable interface with high vacuum at the tip, and the gas load from the interface is negligible, even during electrospray. These conditions lifted the usual requirement of a differentially pumped system. The absence of a background gas also opened up the possibility of designing ion optics to collect and focus ions in order to achieve high overall transmission and detection efficiencies. We describe the operation and performance of the instrument and present mass spectra from solutions of salt ions and DNA bases in formamide and salt ions in water. The spectra show singly charged solute ions clustered with a small number of solvent molecules.


Figures

FIG. 1.
FIG. 1.
The nanopore mass spectrometer.
FIG. 2.
FIG. 2.
Schematic of the nanopore mass spectrometer. Electric fields draw ions from liquid into vacuum at a nano-scale aperture in the ion source. The ion-optic system, which includes two einzel lenses, a quadrupole mass filter, an exit lens, and an electrostatic bender, gathers ions and transmits them selectively on the basis of their m/z. A single-ion detector registers the transmitted ions. The sketch illustrates the hypothetical trajectories of ions transmitted (solid blue) and rejected (dashed red) by the mass filter.
FIG. 3.
FIG. 3.
The nanopore ion source. The configuration shown here features a pulled capillary with a nanoscale tip. The image also shows the register holding the nanopore mount in position, the extractor, the einzel lens, and the gate valve of the vacuum load lock.
FIG. 4.
FIG. 4.
Laser access to the nanopore ion source. (a) The blue arrows indicate the path of a laser beam to and from a chip-based nanopore. The locations of the mirrors and the chip are indicated. (b) A part of the chip can be seen in the mirror.
FIG. 5.
FIG. 5.
A capillary nanotip ion source. (a) Mounting a nanotip. The picture shows the O-ring between the threaded HPLC fitting and the mounting block. (b) The nanotip assembly, also showing the three legs that engage the register. (c) Scanning electron micrograph of a pulled capillary nanotip. (d) Detail showing the 61 nm inside and 170 nm outside diameters of the orifice. The nanotip was coated with 25 nm of carbon for imaging.
FIG. 6.
FIG. 6.
A chip-based nanopore ion source. (a) A Viton gasket sits in the square recess of the mounting block. (b) A 5×5 mm silicon chip with a nanopore in a silicon nitride membrane sits on the gasket. (c) A keyed cover-piece rests on top of the chip. (d) A threaded cap compresses the gasket, the chip, and the cover-piece. (e) Side view of the chip mount, assembled with a stainless steel cap. The wire that is visible controls the voltage of the cap. That wire enters through the hollow sample introduction rod.
FIG. 7.
FIG. 7.
Schematic diagram of the “tube-in-tube” fluid inlet and outlet system. A thin inlet tube delivers liquid into the capillary near the tip. A wider outer tube through which the inlet tube passes provides a path for waste liquid to flow out.
FIG. 8.
FIG. 8.
Influence of the ion source nozzle size on the vacuum chamber pressure during electrospray. (a) Scanning electron micrographs of capillary tips with (a) 4.3 μm outer diameter and 2.9 μm inner diameter and (b) 350 nm outer diameter and 190 nm inner diameter. (c) and (d) show traces of the chamber pressure (black, left axis) and the electrospray current from the tip (gray, right axis) as functions of time for the tips in panels (a) and (b), respectively. Both tips contained 1M NaI in formamide. The total applied extraction voltages were 1.15 kV in (c) and 0.248 kV in (d). The shaded regions indicate times when the safe operating pressure was exceeded and the mass filter and detector turned off.
FIG. 9.
FIG. 9.
Mass spectra acquired during successive experiments in (a) positive mode and then (b) in negative ion mode using the same tip filled with a 1M NaI solution in formamide. The total extraction voltage applied to the nanotip relative to the extractor L1 and the m/z values of the major peaks are indicated.
FIG. 10.
FIG. 10.
Mass spectra acquired during successive experiments in (a) positive and then (b) negative ion modes using a single tip filled with a 1M solution of NaCl in water. The total extraction voltage applied to the nanotip relative to the extractor L1 and the m/z values of the major peaks are indicated.
FIG. 11.
FIG. 11.
A mass spectrum acquired from 100 mM cytosine in formamide with 50 mM acetic acid. The total extraction voltage applied to the nanotip relative to the extractor L1 and the m/z values of the major peaks are indicated.

References

    1. Dekker C., Nat. Nanotechnol. 2, 209 (2007).10.1038/nnano.2007.27 - DOI - PubMed
    1. Cole R. B., J. Mass Spectrom. 35, 763 (2000).10.1002/1096-9888(200007)35:7<763::aid-jms16>3.3.co;2-r - DOI - PubMed
    1. Iribarne J. V. and Thomson B. A., J. Chem. Phys. 64, 2287 (1976).10.1063/1.432536 - DOI
    1. Gamero-Castaño M. and Fernandez de la Mora J., J. Chem. Phys. 113, 815 (2000).10.1063/1.481857 - DOI - PubMed
    1. Dole M., J. Chem. Phys. 49, 2240 (1968).10.1063/1.1670391 - DOI