. 2017 Nov;88(11):111101.
doi: 10.1063/1.4994619.

Invited Review Article: Measurements of the Newtonian constant of gravitation, G

Affiliations

Invited Review Article: Measurements of the Newtonian constant of gravitation, G

C Rothleitner et al. Rev Sci Instrum. 2017 Nov.

Abstract

By many accounts, the Newtonian constant of gravitation G is the fundamental constant that is most difficult to measure accurately. Over the past three decades, more than a dozen precision measurements of this constant have been performed. However, the scatter of the data points is much larger than the uncertainties assigned to each individual measurement, yielding a Birge ratio of about five. Today, G is known with a relative standard uncertainty of 4.7 × 10⁻⁵, which is several orders of magnitudes greater than the relative uncertainties of other fundamental constants. In this article, various methods to measure G are discussed. A large array of different instruments ranging from the simple torsion balance to the sophisticated atom interferometer can be used to determine G. Some instruments, such as the torsion balance can be used in several different ways. In this article, the advantages and disadvantages of different instruments as well as different methods are discussed. A narrative arc from the historical beginnings of the different methods to their modern implementation is given. Finally, the article ends with a brief overview of the current state of the art and an outlook.


Figures

FIG. 1.
FIG. 1.
The values of G recommended by the Task Group on Fundamental Constants of the Committee on Data for Science and Technology over the past several decades. The lower graph shows the relative standard uncertainty assigned to each recommendation. The values and uncertainties are obtained from Refs. and –.
FIG. 2.
FIG. 2.
The relative standard uncertainties of the recommended values of selected fundamental constants. The uncertainties are obtained from the latest adjustment of the fundamental constants by the Task Group on Fundamental Constants under the auspices of the Committee on Data for Science and Technology (CODATA). A list of all recommended values can be found in Ref. . The uncertainty of G is the largest of the known fundamental constants of nature. Note that the constants that are known with the smallest uncertainties are all determined by means of measurements of frequencies or ratios of frequencies.
FIG. 3.
FIG. 3.
The torsion balance used by Cavendish in the first laboratory measurement of G. Adapted from Ref. .
FIG. 4.
FIG. 4.
Example of how to measure G by means of a spring balance. First, the elongation of the spring due to the Earth’s mass, M, is measured. Then, an additional field mass m1 is added, and the change in elongation is measured. If an elongation of, for example, 10 cm results due to the Earth’s mass, then the field mass results in a variation of only 0.67 pm.
FIG. 5.
FIG. 5.
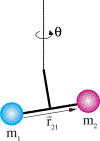
Schematic drawing of a simplified torsion balance. The torsion fiber hangs vertically like a plumb line. The pendulum bob shown here is called the dumbbell. If the torsion balance is not balanced (i.e., m1m2), the bob is angled with respect to the horizontal plane such that the center of mass (COM) is below the suspension point. The fiber is only sensitive to torques around its axis, which is vertical.
FIG. 6.
FIG. 6.
Measured noise and thermal noise of a torsional oscillator with κ = 774 pN m rad−1. The top plot shows the amplitude spectral density of the torsional angle θ. The bottom plot shows the amplitude spectral density of the torque. Ideally, the signal that is to be measured is placed at the minimum value of the torque noise, here about 3 mHz.
FIG. 7.
FIG. 7.
A simple model of a real spring.
FIG. 8.
FIG. 8.
The real and imaginary parts of a simple model of a real spring consisting of an ideal spring in parallel to a Maxwell unit (see Fig. 7).
FIG. 9.
FIG. 9.
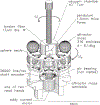
Cut-away drawing of the torsion balance used by Gundlach and Merkowitz to determine G. This instrument has measured G with the smallest relative standard deviation to date, 13.6 × 10⁻⁶. Reprinted with permission from J. H. Gundlach and S. M. Merkowitz, Phys. Rev. Lett. 85, 2869–2872 (2000). Copyright 2000 American Physical Society.
FIG. 10.
FIG. 10.
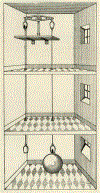
Principle of the pendulum measurement performed by Bouguer. He measured the attraction of Mount Chimborazo to the pendulum bob: first close to the mountain (left) and then far from the mountain (right). The plumb line is measured with respect to the fixed stars.
FIG. 11.
FIG. 11.
A laboratory version of Bouguer’s pendulum experiment. Two field masses attract the bobs of two pendulums, which form a microwave cavity. Reprinted with permission from U. Kleinevoß, “Bestimmung der Newtonschen Gravitationskonstanten G,” WUB-DISS 2002–2, Ph.D. thesis (University of Wuppertal, 2002).
FIG. 12.
FIG. 12.
Double-balance of the German physicist von Jolly. From Graetz, Die Physik. Copyright 1917 Max Planck Institute for the History of Science. Reprinted with permission from Max Planck Institute for the History of Science.
FIG. 13.
FIG. 13.
The principle of the experiment conducted at the University of Zurich. The two gray cylinders (field masses) can be either together (T) or apart (A). Either one of the two test masses is connected to the mass comparator to measure its weight given by m(g + gz ), where g is the local acceleration of gravity at the test mass position and gz is the additional vertical field produced by the source masses. On either side of the drawing, gz is shown. Reprinted with permission from S. Schlamminger et al., Philos. Trans. R. Soc., A 372(2026), 20140027 (2014). Copyright 2014 The Author(s) Published by the Royal Society.
FIG. 14.
FIG. 14.
(a) In a free-fall absolute gravimeter, a test mass contains a retroreflector Mobj, which is part of a Mach-Zehnder laser interferometer. The test mass is released in vacuum and its free-fall path is traced with respect to an inertially isolated reference retroreflector (Mref ). BS denotes beam splitters; M denotes mirrors. The interference signal registered with the detector Det contains the information about the acceleration due to gravity. For repeated measurements, the test mass is lifted up with an elevator. The alternating positions of a field mass are sketched by the two rings. (b) The graph shows the qualitative field strength of the ring-shaped field mass. Two extrema appear. The trajectory of the test mass is adjusted to precisely cover the range of the extrema in order to minimize positioning errors. When the field mass is in the lower (L/Pos 2) position, the measured gravity is higher than the local gravity. When the field mass is positioned above (U/Pos 1) the test mass, the measured gravity is lower than the local Earth’s gravity. The theoretical effective gravity from the source mass is obtained by integrating over the field strength covered by the trajectory. Reprinted with permission from J. P. Schwarz et al., Science 282, 2230–2234 (1998). Copyright 1998 AAAS.
FIG. 15.
FIG. 15.
The differential signal of the G experiment with a gravimeter. The gravity was measured for two different field mass positions. The time variation in the gravity signal arises mainly from the Earth tides (solid middle line). Reprinted with permission from J. P. Schwarz, Science 282, 2230–2234 (1998). Copyright 2015 AAAS.
FIG. 16.
FIG. 16.
Differential gradiometer principle. Test masses TM1, TM2, and TM3 are in simultaneous free fall. The ring-shaped field masses perturb the local gravity field. Due to the differential character of the setup, only the gravity of the field masses is measured, not the Earth’s gravity or its gradient (to first order) (M—mirror, BS—beam splitter, d—distance between upper and lower test mass).
FIG. 17.
FIG. 17.
(a) This diagram shows the gravitational field strength aa of the hollow cylinder pictured in (b). (b) The gravitational field of the cylinder in (a): It has a saddle point on the axis of symmetry and near the end of the cylinder. From Y. T. Chen and A. Cook, Gravitational Experiments in the Laboratory. Copyright 2005 Cambridge University Press. Reprinted with permission from Cambridge University Press.
FIG. 18.
FIG. 18.
Recent measurements of G and their measurement uncertainties. The names on the left denote the principal authors and the numbers on the right denote the years when the results were published. The open symbols represent torsion balance experiments and the closed symbols represent measurements that were performed by other means. The vertical black line gives the CODATA-2014 recommended value, GCODATA2014, with its calculated uncertainty in gray.
FIG. 19.
FIG. 19.
Current limits on the deviation of the gravitational law from an inverse square law. The deviations are parameterized as a Yukawa potential with an interaction range λ and a strength of α relative to Newtonian gravity, see text. Reprinted with permission from J. Murata, private communication (2017).

Similar articles

Cited by

References

    1. Newton I, Philosophiae Naturalis Principia Mathematica (Sumptibus Societatis, 1687).
    1. Einstein A, Die Feldgleichungen der Gravitation, Sitzungsberichte der Königlich Preußischen Akademie der Wissenschaften (Berlin, 1915), pp. 844–847.
    1. Will CM, “The confrontation between general relativity and experiment,” Living Rev. Relativ 9(1), 3 (2006). - PMC - PubMed
    1. Gillies GT, “The Newtonian gravitational constant: An index of measurements,” Metrologia 24(S), 1 (1987).
    1. Thompson M and Ellison SLR, “Dark uncertainty,” Accredit. Qual. Assur 16(10), 483 (2011).