

Whole chromosome loss and associated breakage-fusion-bridge cycles transform mouse tetraploid cells
- PMID: 29196303
- PMCID: PMC5770879
- DOI: 10.15252/embj.201797630
Whole chromosome loss and associated breakage-fusion-bridge cycles transform mouse tetraploid cells
Abstract
Whole chromosome gains or losses (aneuploidy) are a hallmark of ~70% of human tumors. Modeling the consequences of aneuploidy has relied on perturbing spindle assembly checkpoint (SAC) components, but interpretations of these experiments are clouded by the multiple functions of these proteins. Here, we used a Cre recombinase-mediated chromosome loss strategy to individually delete mouse chromosomes 9, 10, 12, or 14 in tetraploid immortalized murine embryonic fibroblasts. This methodology also involves the generation of a dicentric chromosome intermediate, which subsequently undergoes a series of breakage-fusion-bridge (BFB) cycles. While the aneuploid cells generally display a growth disadvantage in vitro, they grow significantly better in low adherence sphere-forming conditions and three of the four lines are transformed in vivo, forming large and invasive tumors in immunocompromised mice. The aneuploid cells display increased chromosomal instability and DNA damage, a mutator phenotype associated with tumorigenesis in vivo Thus, these studies demonstrate a causative role for whole chromosome loss and the associated BFB-mediated instability in tumorigenesis and may shed light on the early consequences of aneuploidy in mammalian cells.
Keywords: aneuploidy; chromosomal instability; chromosome losses; tetraploidy; tumorigenesis.
© 2017 The Authors.
Figures
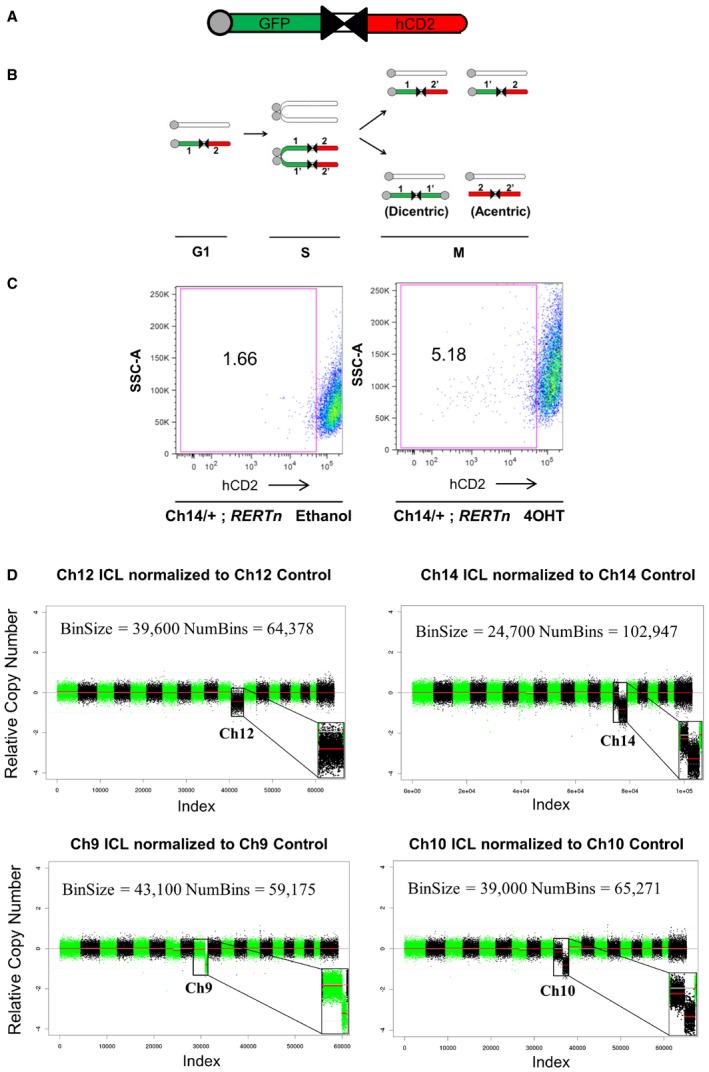
Schematic of the inverted lox P (iLoxP) site, flanked by sortable GFP and hCD2 markers.
Model of reciprocal recombination yielding parental configurations 1/2′ and 1′/2 and dicentric/acentric configurations as a result of inverted recombination yielding configurations 1/1′ and 2/2′.
Representative FACS plot showing loss of hCD2 marker expression of Ch14 ICL MEFs after treatment with 4‐hydroxy tamoxifen (4OHT) for 14 days to induce Cre, compared to ethanol‐treated control cells (See also Appendix Fig S1A).
Shallow whole‐genome sequencing (copy number profiles) of large T antigen immortalized MEFs after exposure to Cre recombinase and sorted for control (hCD2 Plus) and ICL (hCD2 Minus) cells for chromosomes 12, 14 and 9 and 10, without any in vitro culturing, post‐FACS sort.
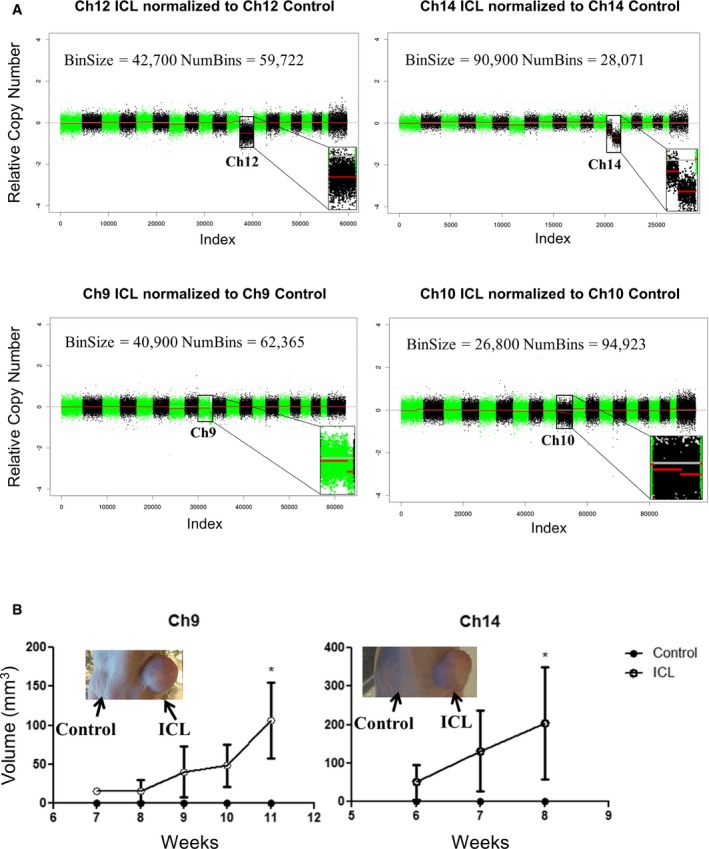
Shallow whole‐genome sequencing (copy number profiles) of large T antigen immortalized, early passage MEFs after exposure to Cre recombinase and sorted for control (hCD2 Plus) and ICL (hCD2 Minus) cells for chromosomes 12, 14 and 9 and 10.
Tumor growth curve after early passage ICL cells were injected into flanks of athymic nude mice (n = 5 per group and error bars denote SEM, *P < 0.05 for Ch9 and Ch14). Two‐tailed unpaired t‐test was used to determine statistical significance.
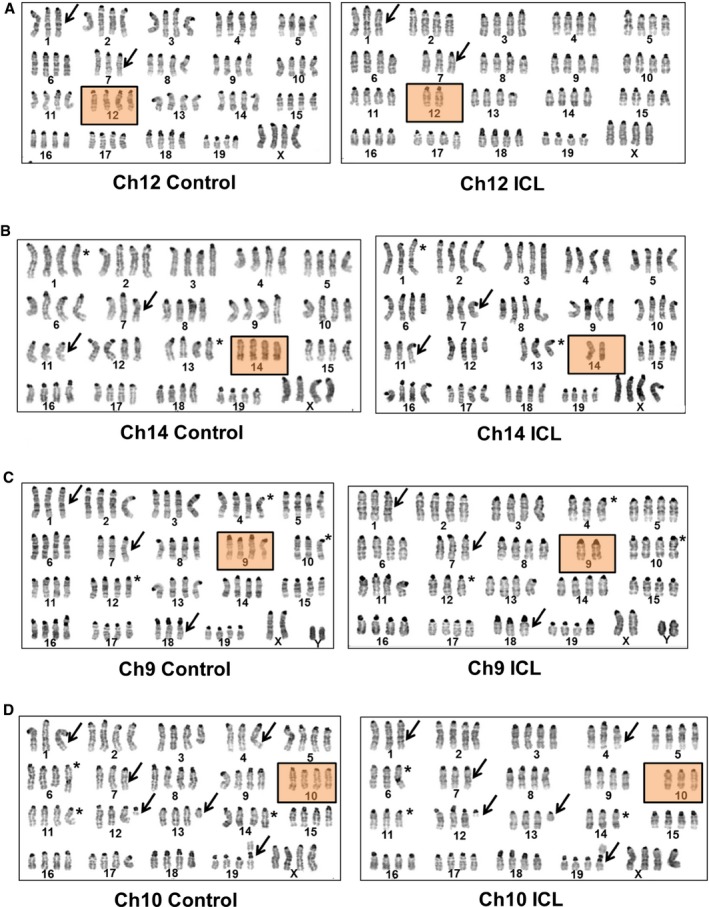
- A–D
Representative karyotypes of late passage, large T antigen immortalized MEFs after exposure to Cre recombinase and serially sorted for control (hCD2 Plus) and ICL (hCD2 Minus) cells for chromosome lines (A) Ch12, (B) Ch14, (C) Ch9, and (D) Ch10. Boxed panels denote targeted chromosome loss; arrows and asterisks denote shared and unshared, non‐targeted chromosomal copy number variations, respectively.
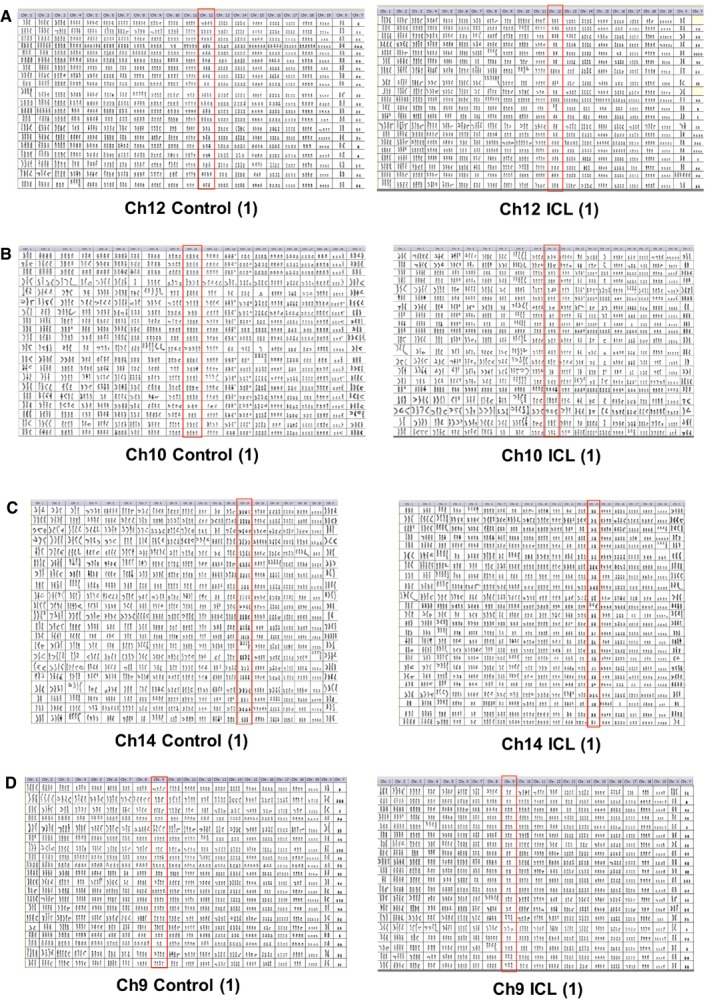
- A–D
Karyotypic analysis of later passage, control, and ICL of a replicate (#1) of Ch12 (A), Ch10 (B), Ch14 (C), and Ch9 (D) lines. All chromosomes are shown for 20 metaphases. Target chromosomes are boxed in red.
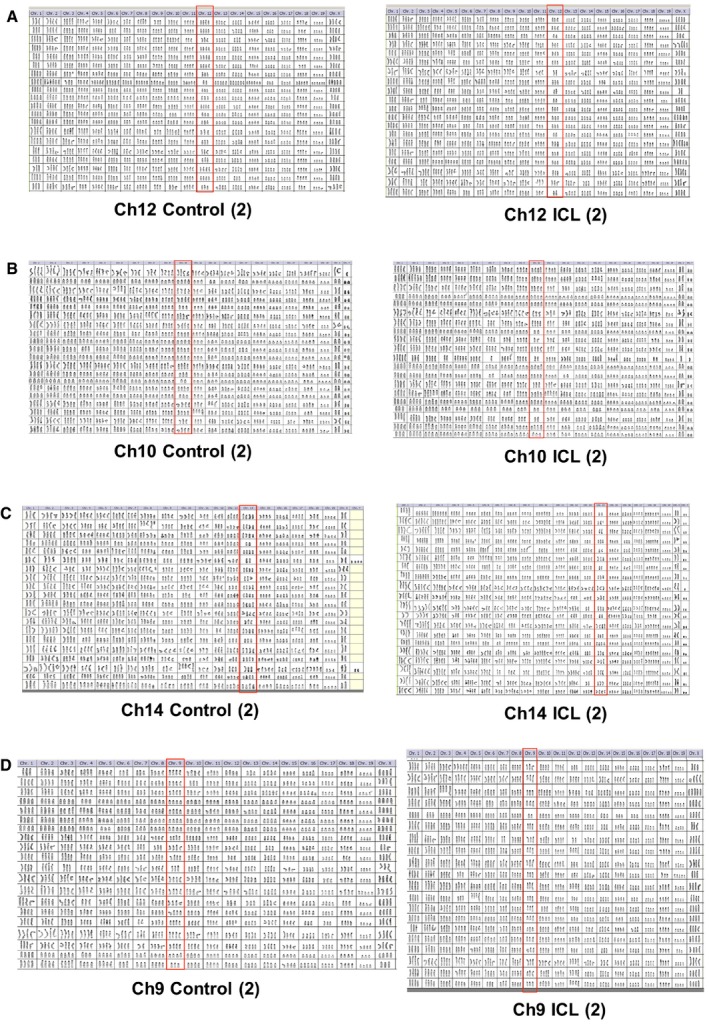
- A–D
Karyotypic analysis of later passage, control and ICL of a replicate (#2) of Ch12 (A), Ch10 (B), Ch14 (C) and Ch9 (D) lines. All chromosomes are shown for 20 metaphases. Target chromosomes are boxed in red.
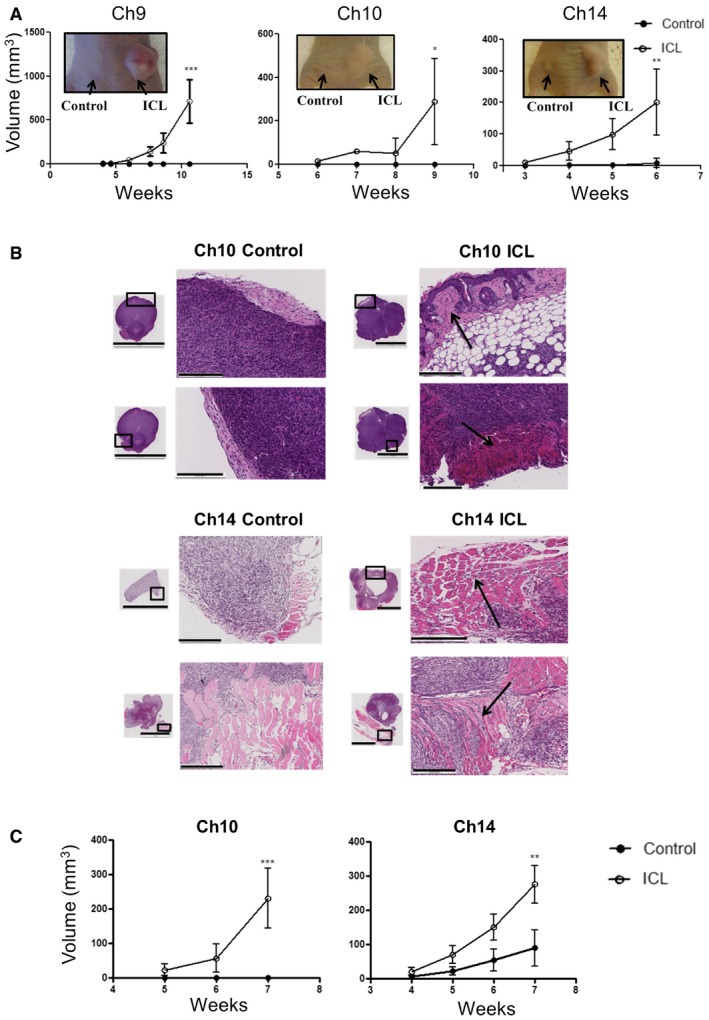
Tumor growth curve after later passage ICL cells were injected into flanks of athymic nude mice (n = 5 per group and error bars denote SD, ***P < 0.0005 for Ch9, *P < 0.05 for Ch10 and **P < 0.005 for Ch14). Two‐tailed unpaired t‐test was used to determine statistical significance.
Tumor sections were stained with H&E to assess tumor histology (scale bars denote 5 mm for the inset and 200 μm for the zoomed image). Arrows in the ICL tumors sections indicate regions where tumors have invaded into the adjacent tissue.
Tumor growth curve after later passage ICL cells were injected into flanks of NOD/SCID mice (n = 5 per group and error bars denote SD, ***P < 0.0005 for Ch10 and **P < 0.005 for Ch14). Two‐tailed unpaired t‐test was used to determine statistical significance.
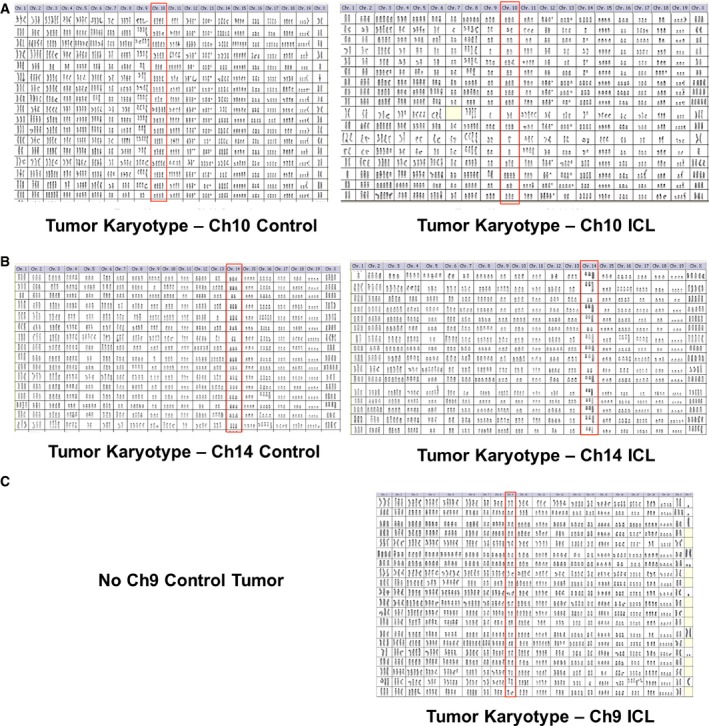
- A–C
Karyotypic analysis of later passage, control, and ICL tumor explants derived from the injecting the late passage control and ICL cells of Ch10 (A), Ch14 (B), and Ch9 (C). All chromosomes are shown for 20 metaphases. Target chromosomes are boxed in red. No karyotypes are shown for the Ch9 controls, as they did not form tumors in nude mice.
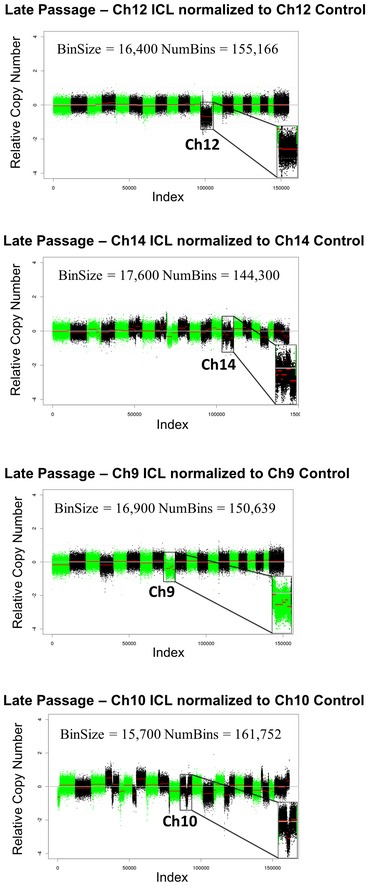
- A–C
Shallow whole‐genome sequencing (copy number profiles) of large T antigen immortalized, late passage MEFs after exposure to Cre recombinase and serially sorted for control (hCD2 Plus) and ICL (hCD2 Minus) cells for chromosomes 12, 14 and 9 and 10.
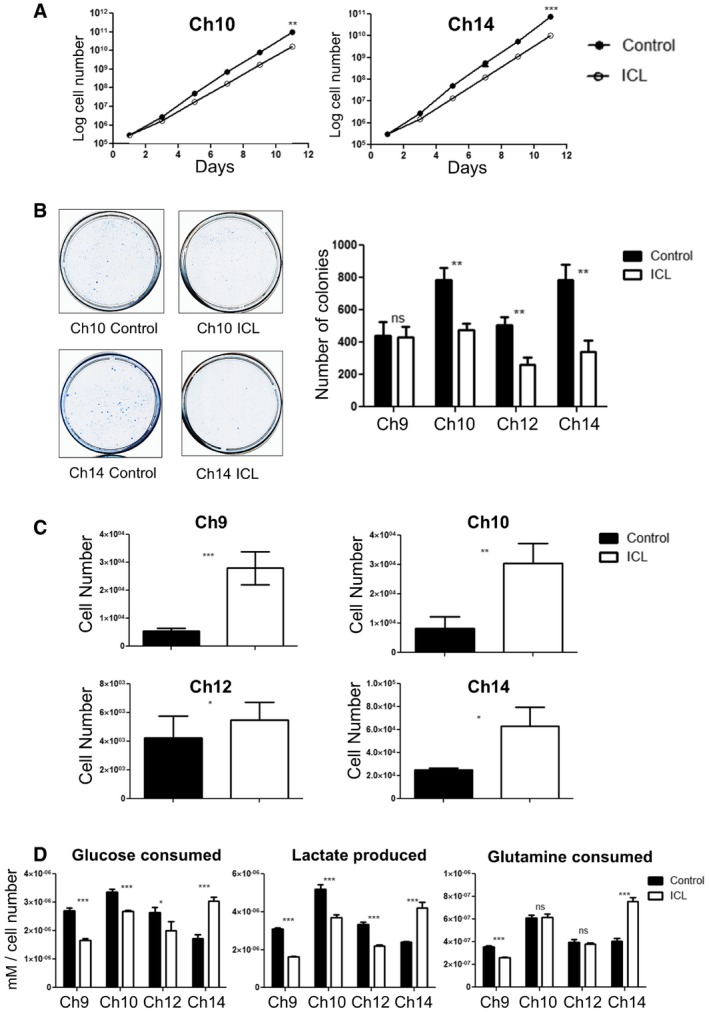
Growth curve of the later passage ICL lines Ch10 and Ch14 under adherent in vitro culture conditions (n = 3 for each data set and error bars denote SD, **P < 0.005 for Ch10 and ***P < 0.0001 for Ch14). See also Appendix Fig S3A. Two‐tailed unpaired t‐test was used to determine statistical significance.
Colony formation in ICL and control MEFs. 5,000 cells were seeded in 10‐cm plates and stained with methylene blue after 3 days. Representative colony formation images in Ch10 and Ch14 are shown (left) and quantification of colonies formed (right) in the 4 ICL lines (n = 3 for each data set and error bars denote SD, **P < 0.005 for Ch10, Ch12, and Ch14 and ns for Ch9). Two‐tailed unpaired t‐test was used to determine statistical significance.
Quantification of growth in ultra‐low adherent, sphere‐forming conditions for the four ICL lines (n = 3 for Ch10 and Ch14, n = 6 for Ch9 and Ch12 and error bars denote SD, ***P < 0.0001 for Ch9, **P < 0.001 for Ch10 and *P < 0.05 for Ch12 and Ch14). Two‐tailed unpaired t‐test was used to determine statistical significance.
Analysis of metabolites (glucose consumed, lactate produced and glutamine consumed) for the ICL lines. Spent media was analyzed after each ICL, and control line was grown in culture for 3 days. Media in identical culture conditions, but with no plated cells, was used as a baseline for all samples (n = 3 for each data set and error bars denote SD; Glucose consumed: ***P < 0.0005 for Ch9 and Ch14, ***P = 0.0005 for Ch10 and *P < 0.05 for Ch12; Lactate produced: ***P < 0.0005 for Ch9 and Ch12, ***P = 0.0008 for Ch10, and ***P = 0.0005 for Ch14; Glutamine consumed: ***P < 0.0005 for Ch9 and Ch14). Two‐tailed unpaired t‐test was used to determine statistical significance.
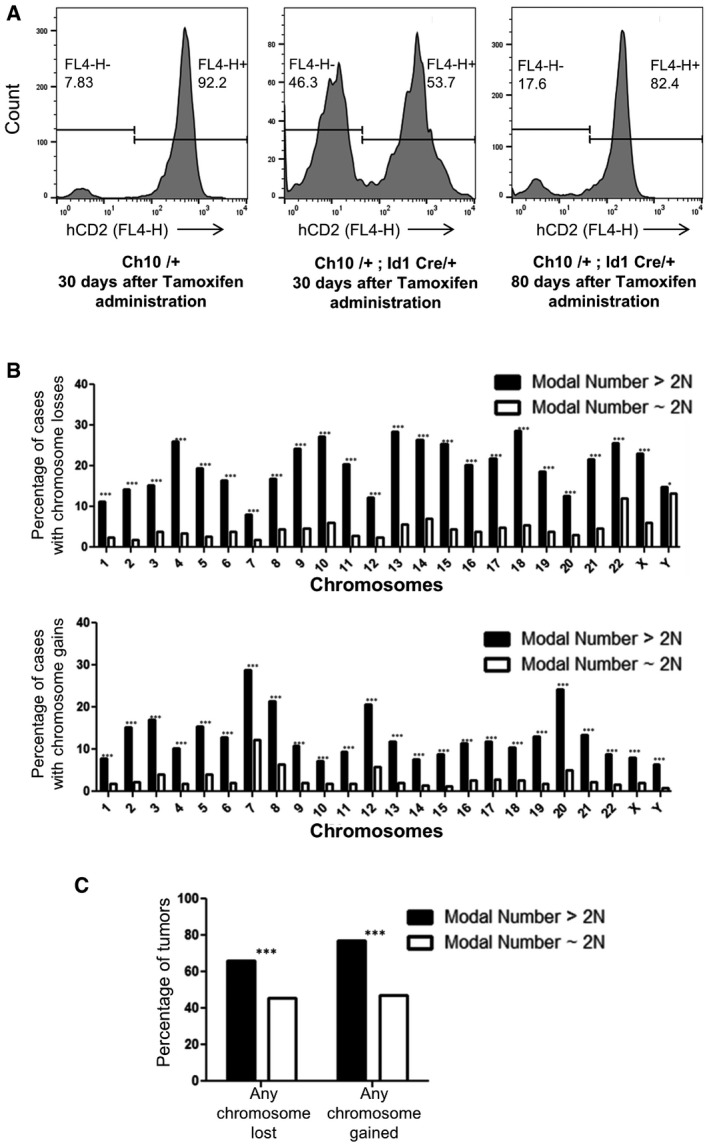
Flow cytometry analysis of tail blood from Ch10/+ (control) at 30 days post‐tamoxifen administration, Ch10/+; Id1 Cre/+ at 30 days post‐tamoxifen administration, and Ch10/+; Id1Cre/+ at 80 days post‐tamoxifen administration.
Analysis from the Mitelman database for the fraction of human solid tumors that have lost (top) or gained (bottom) individual chromosomes that have modal chromosome number > 2N or ˜2N (n = 3,459 cases for modal number > 2N and n = 12,464 cases for modal number ˜2N, top: ***P < 0.0001 for chromosomes 1–22, X and *P < 0.05 for chromosome Y; bottom: ***P < 0.0001 for all chromosomes). Two‐tailed two‐sample t‐test to compare sample means was used to determine statistical significance.
Analysis from the Mitelman database for the fraction of human solid tumors that have lost or gained any chromosome that have modal chromosome number > 2N or ˜2N (n = 3,459 cases for modal number > 2N and n = 12,464 cases for modal number ˜2N, ***P < 0.0001 for both modal number > 2N and ˜2N). Two‐tailed two‐sample t‐test to compare sample means was used to determine statistical significance.
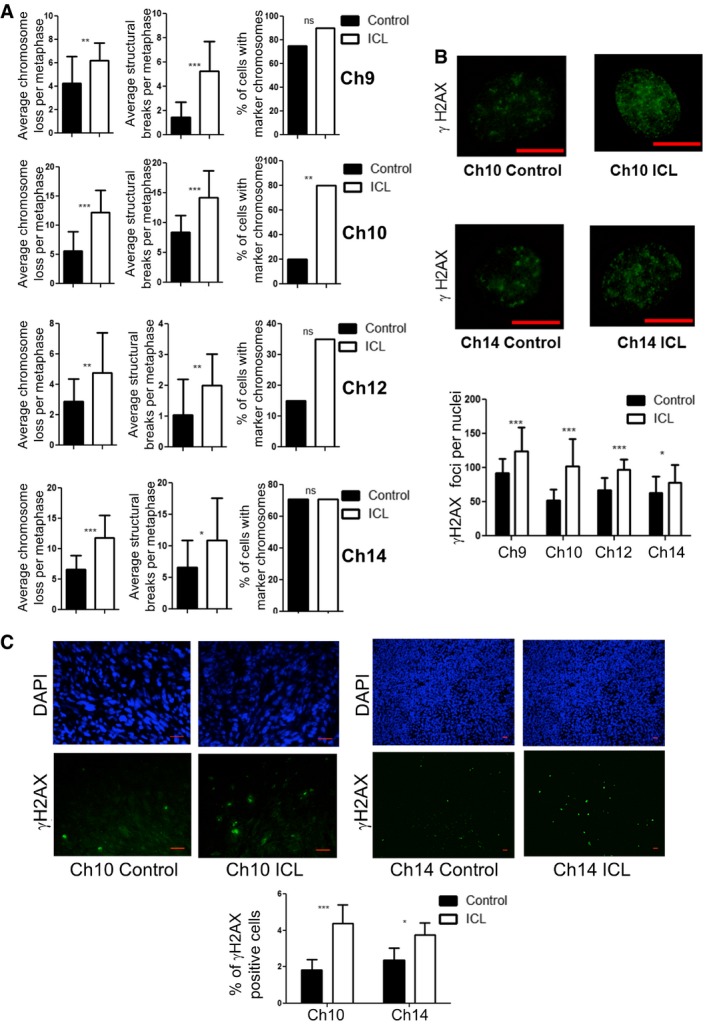
Chromosomal instability readouts, of later passage lines, assessed by average chromosomes loss per metaphase, average number of structural rearrangements per metaphase and percentage of metaphases with marker chromosomes (n = 20 for each data set and error bars denote SD, average chromosome loss: **P < 0.005 for Ch9, ***P < 0.0001 for Ch10 and Ch14, and **P < 0.05 for Ch12; average structural rearrangements: ***P < 0.0001 for Ch9 and Ch10, **P < 0.05 for Ch12, and *P < 0.05 for Ch14; percentage of metaphases with marker chromosomes: **P < 0.0005 for Ch10). Two‐tailed unpaired t‐test was used to determine statistical significance for average chromosome loss and structural breaks. Two‐tailed Z‐test was used to determine statistical significance for the percentage of cells with marker chromosomes.
Determination of number of γH2AX foci in ICL and control nuclei and quantification (scale bars denote 10 μm, ***P < 0.0001 for Ch9, Ch10, and Ch12, *P < 0.05 for Ch14; n = 25 for each data set, and error bars denote SD). See also Appendix Fig S5A and B. Two‐tailed unpaired t‐test was used to determine statistical significance.
Number of γH2AX‐positive cells in formalin fixed ICL and control tumor sections by immunofluorescence staining and quantification (Scale bars denote 20 μm, n = 8 fields for Ch10 and 5 fields for Ch14 with at least 200 cells in each field, ***P < 0.0001 for Ch10 and *P < 0.05 for Ch14). Two‐tailed Z‐test was used to determine statistical significance.

Similar articles
-
Are aneuploidy and chromosome breakage caused by a CINgle mechanism?Cell Cycle. 2010 Jun 15;9(12):2275-80. doi: 10.4161/cc.9.12.11865. Epub 2010 Jun 15. Cell Cycle. 2010. PMID: 20519949
-
Chromosome nondisjunction during bipolar mitoses of binucleated intermediates promote aneuploidy formation along with multipolar mitoses rather than chromosome loss in micronuclei induced by asbestos.Oncotarget. 2017 Feb 14;8(7):11030-11041. doi: 10.18632/oncotarget.14212. Oncotarget. 2017. PMID: 28038458 Free PMC article.
-
Near-tetraploid cancer cells show chromosome instability triggered by replication stress and exhibit enhanced invasiveness.FASEB J. 2018 Jul;32(7):3502-3517. doi: 10.1096/fj.201700247RR. Epub 2018 Feb 8. FASEB J. 2018. PMID: 29452566 Free PMC article.
-
Role of telomere dysfunction in genetic intratumor diversity.Adv Cancer Res. 2011;112:11-41. doi: 10.1016/B978-0-12-387688-1.00002-8. Adv Cancer Res. 2011. PMID: 21925300 Review.
-
Tetraploidy, aneuploidy and cancer.Curr Opin Genet Dev. 2007 Apr;17(2):157-62. doi: 10.1016/j.gde.2007.02.011. Epub 2007 Feb 26. Curr Opin Genet Dev. 2007. PMID: 17324569 Review.
Cited by
-
Site-Specific Recombination with Inverted Target Sites: A Cautionary Tale of Dicentric and Acentric Chromosomes.Genetics. 2020 Aug;215(4):923-930. doi: 10.1534/genetics.120.303394. Epub 2020 Jun 25. Genetics. 2020. PMID: 32586890 Free PMC article.
-
Exploiting aneuploidy-imposed stresses and coping mechanisms to battle cancer.Open Biol. 2020 Sep;10(9):200148. doi: 10.1098/rsob.200148. Epub 2020 Sep 2. Open Biol. 2020. PMID: 32873156 Free PMC article. Review.
-
Case report: Germline CHEK2 mutation is associated with a giant cell glioblastoma.Front Oncol. 2024 Oct 1;14:1361928. doi: 10.3389/fonc.2024.1361928. eCollection 2024. Front Oncol. 2024. PMID: 39411129 Free PMC article.
-
Whole-Genome Duplication Shapes the Aneuploidy Landscape of Human Cancers.Cancer Res. 2022 May 3;82(9):1736-1752. doi: 10.1158/0008-5472.CAN-21-2065. Cancer Res. 2022. PMID: 35502547 Free PMC article.
-
Connections between sister and non-sister telomeres of segregating chromatids maintain euploidy.Curr Biol. 2023 Jan 9;33(1):58-74.e5. doi: 10.1016/j.cub.2022.11.038. Epub 2022 Dec 15. Curr Biol. 2023. PMID: 36525974 Free PMC article.
References
-
- Artandi SE, Chang S, Lee SL, Alson S, Gottlieb GJ, Chin L, DePinho RA (2000) Telomere dysfunction promotes non‐reciprocal translocations and epithelial cancers in mice. Nature 406: 641–645 - PubMed
Publication types
MeSH terms
Grants and funding
LinkOut - more resources
Full Text Sources
Other Literature Sources
Molecular Biology Databases
