. 2018 Jan 2;217(1):315-328.
doi: 10.1083/jcb.201701049. Epub 2017 Dec 1.

p38 MAPK inhibits autophagy and promotes microglial inflammatory responses by phosphorylating ULK1

Affiliations

p38 MAPK inhibits autophagy and promotes microglial inflammatory responses by phosphorylating ULK1

Yingli He et al. J Cell Biol. .

Abstract

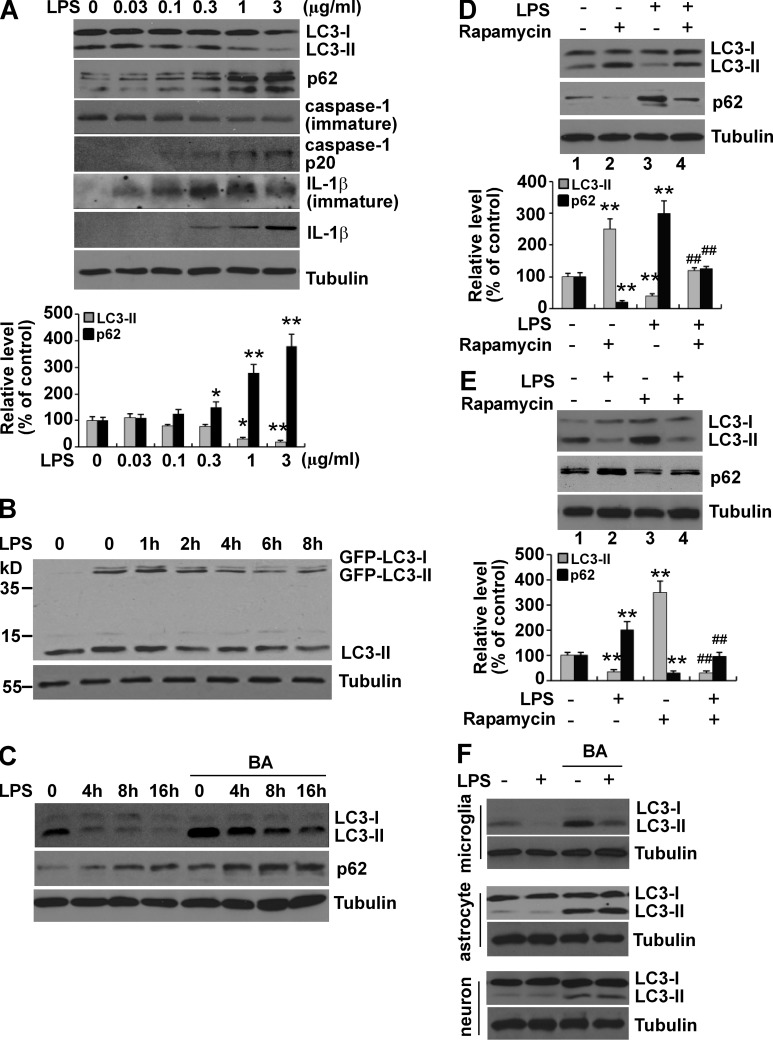
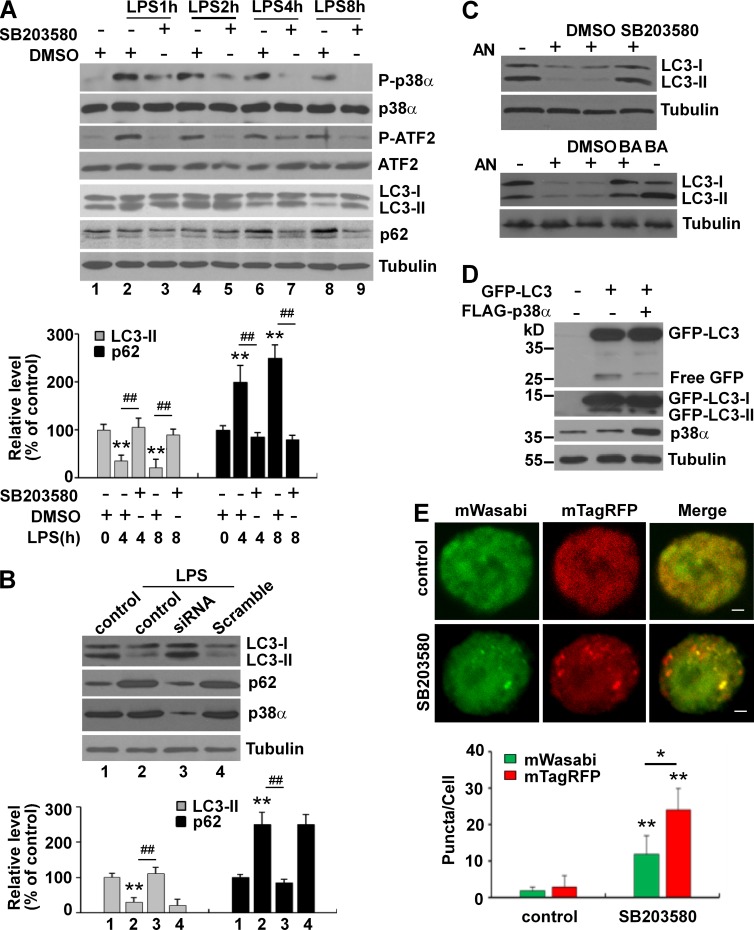
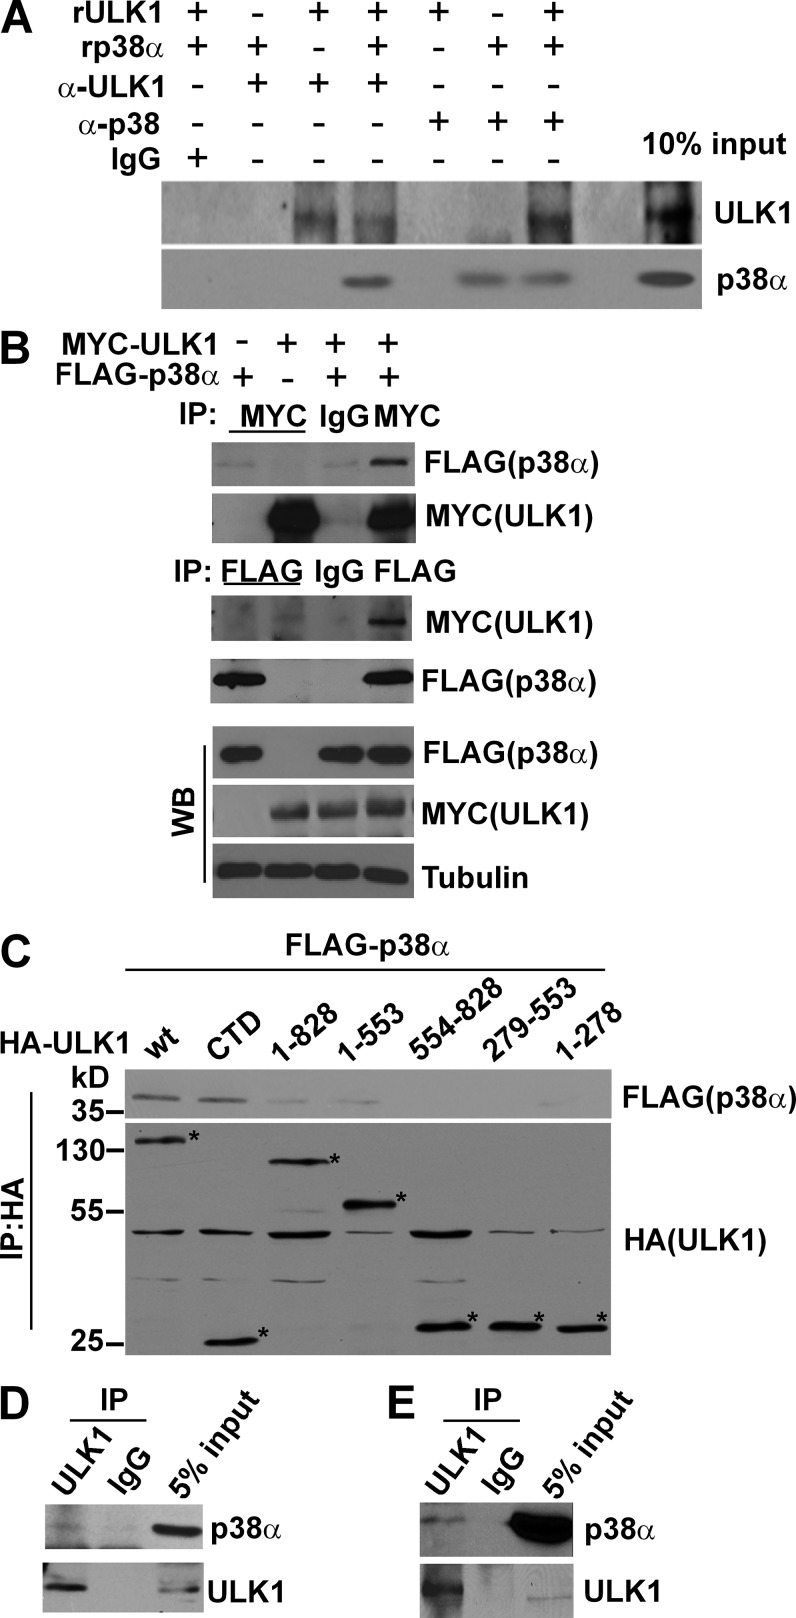
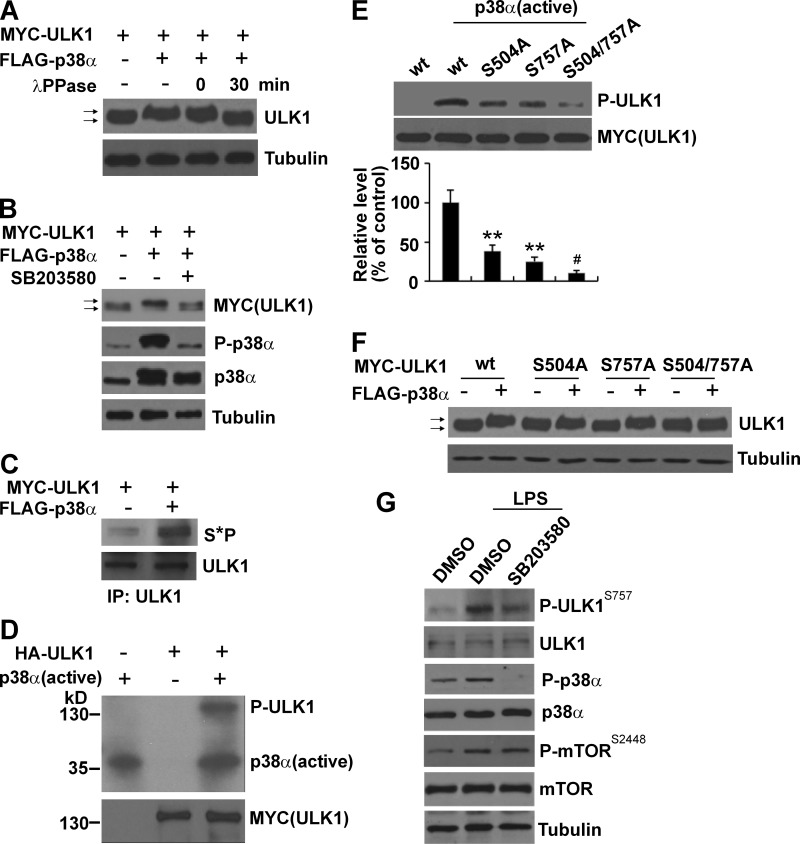
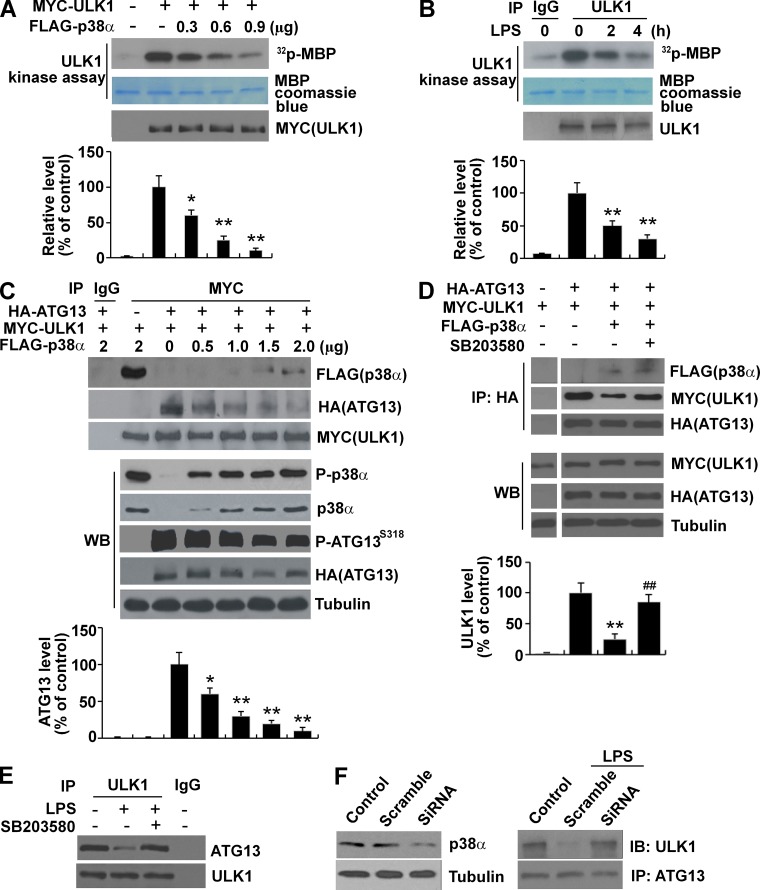
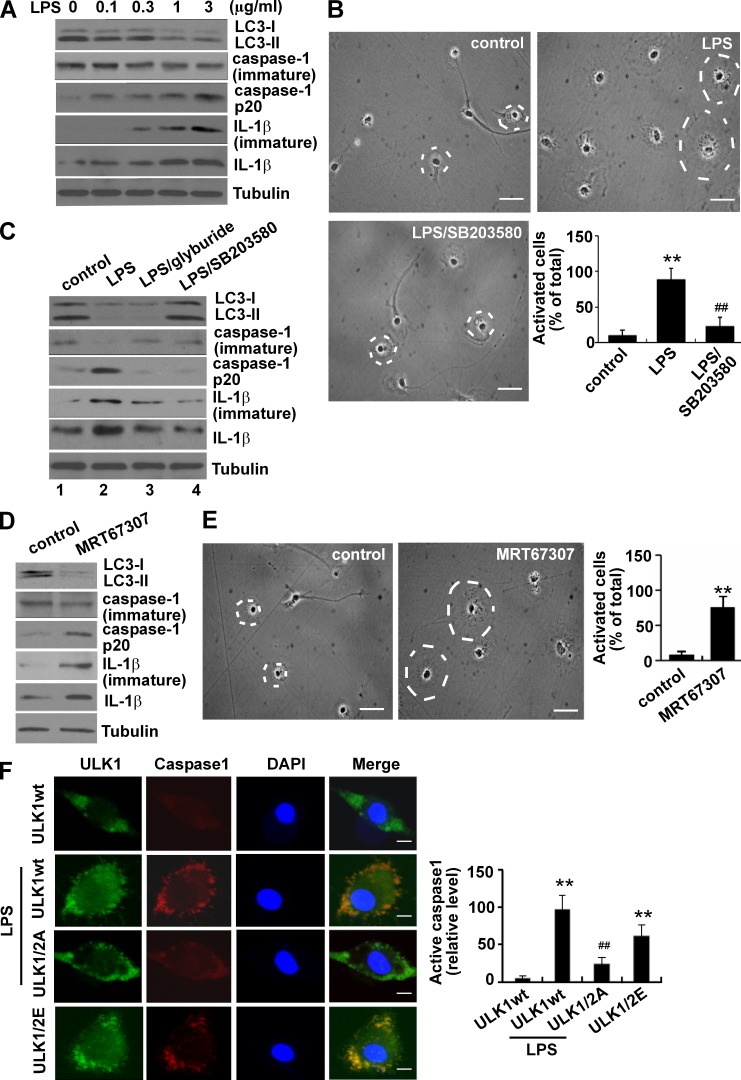
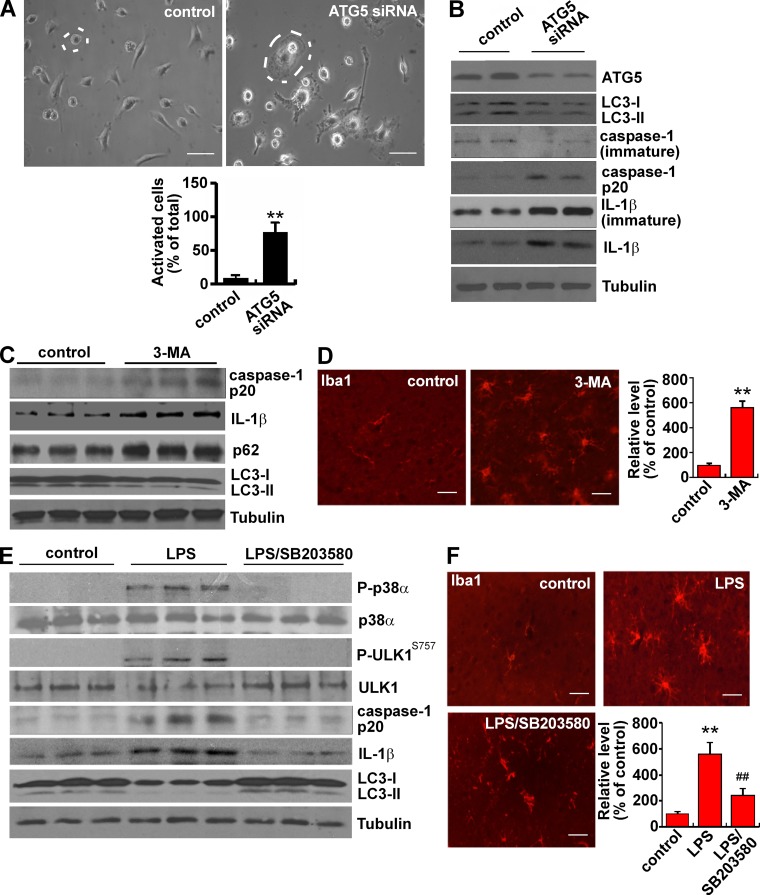
Inflammation and autophagy are two critical cellular processes. The relationship between these two processes is complex and includes the suppression of inflammation by autophagy. However, the signaling mechanisms that relieve this autophagy-mediated inhibition of inflammation to permit a beneficial inflammatory response remain unknown. We find that LPS triggers p38α mitogen-activated protein kinase (MAPK)-dependent phosphorylation of ULK1 in microglial cells. This phosphorylation inhibited ULK1 kinase activity, preventing it from binding to the downstream effector ATG13, and reduced autophagy in microglia. Consistently, p38α MAPK activity is required for LPS-induced morphological changes and the production of IL-1β by primary microglia in vitro and in the brain, which correlates with the p38α MAPK-dependent inhibition of autophagy. Furthermore, inhibition of ULK1 alone was sufficient to promote an inflammatory response in the absence of any overt inflammatory stimulation. Thus, our study reveals a molecular mechanism that enables the initial TLR4-triggered signaling pathway to inhibit autophagy and optimize inflammatory responses, providing new understanding into the mechanistic basis of the neuroinflammatory process.


Figures

Figure 1.
Figure 1.
LPS inhibits autophagy in microglia. (A) LPS inhibits autophagy in microglial cell line BV2 and activates BV2 cells. BV2 cells were treated with different concentrations of LPS for 8 h. The levels of LC3, p62, caspase-1, and IL-1β were assessed by Western blotting. The bottom graph shows the relative changes of LC3-II and p62 over control. (B) LPS inhibits the lipidation of GFP-LC3. BV2 cells transfected with GFP-LC3 were treated with LPS (1 µg/ml) for 0–8 h and blotted with an anti-LC3 antibody. (C) LPS inhibits autophagic flux in BV2 cells. BV2 cells were incubated with LPS (1 µg/ml) for 0–16 h and treated with or without BA (100 nM) for the last 4 h. (D) LPS inhibits rapamycin-induced autophagy in BV2 cells. BV2 cells were treated with LPS (1 µg/ml), rapamycin (50 nM), or both for 8 h. The bottom graph shows relative changes of LC3-II and p62. (E) LPS inhibits rapamycin-induced autophagy in primary microglial cells. Primary microglia were treated as described in D. (F) LPS inhibits autophagy specifically in microglial cells. Primary microglia, primary astrocytes, and primary cortical neurons isolated from rat brains were treated with LPS (1 µg/ml) for 8 h with or without BA (100 nM) for the last 4 h. *, P < 0.05; **, P < 0.01 versus control; ##, P < 0.01 versus rapamycin. n = 4. Error bars show SD.
Figure 2.
Figure 2.
LPS inhibits autophagy in BV2 cells through p38α MAPK. (A) p38 MAPK inhibitor SB203580 blocks LPS-induced inhibition of autophagy in BV2 cells. BV2 cells were treated with LPS (1 µg/ml) with or without SB203580 (10 µM) as indicated. The graph below shows relative changes of LC3-II and p62. (B) Knockdown of p38α MAPK blocks LPS-induced inhibition of autophagy in BV2 cells. BV2 cells were transfected with scramble or p38 MAPK–specific siRNA for 48 h and then treated with LPS (1 µg/ml) for 8 h. Whole-cell lysates were analyzed by immunoblotting. The graph below shows relative changes of LC3-II and p62. (C) The p38 MAPK activator AN inhibits autophagy in BV2 cells. BV2 cells were treated with AN (10 µM) with or without SB203580 (10 µM; top) for 8 h or were treated first with AN for 4 h and then with or without BA (100 nM; bottom) for another 4 h. (D) Expression of p38α MAPK reduces the conversion of GFP-LC3. HEK293 cells were transfected with GFP-LC3 or in combination with p38α MAPK for 24 h. Whole-cell lysates were analyzed by immunoblotting. (E) SB203580 enhances autophagy in BV2 cells under basal conditions. BV2 cells were transfected with tandem-fluorescently tagged LC3 (mTagRFP-mWasabi-LC3) for 24 h. Cells were treated with or without SB203580 (10 µM) for 8 h. *, P < 0.05; **, P < 0.01 versus control; ##, P < 0.01 versus LPS alone. Bars, 10 µm. n = 100. Experiments were repeated three times. Error bars show SD.
Figure 3.
Figure 3.
p38α MAPK interacts with ULK1. (A) Recombinant p38α MAPK and ULK1 interact with each other in vitro. Recombinant p38α MAPK (50 ng) was incubated with recombinant ULK1 (50 ng) in IP buffer at 4°C for 2 h. Pulldown assays were performed by using an anti–p38α MAPK antibody and blotted with an anti-ULK1 antibody. (B) Expressed p38α MAPK and ULK1 interact with each other. FLAG-p38α MAPK and/or MYC-ULK1 were overexpressed in HEK293 cells (bottom). Co-IP was performed by incubating whole-cell lysates (200 µg) with either an anti-MYC or an anti-FLAG antibody (top and middle). WB, Western blot. (C) p38α MAPK interacts with the ULK1 C terminus. HA-tagged WT ULK1 or ULK1 fragments were coexpressed with FLAG–p38α MAPK in HEK293 cells. The level of FLAG–p38α MAPK coimmunoprecipitated with HA-ULK1 from 200 µg cell lysates was analyzed with an anti-FLAG antibody. CTD, C-terminal domain. Asterisks denote HA-ULK1 fragments. (D and E) Endogenous p38α MAPK and ULK1 interact with each other in HEK293 (D) and BV2 cells (E). Co-IP was performed by incubating whole-cell lysates (400 µg) with anti-ULK1 antibody, and the precipitates were blotted with anti-p38 antibody.
Figure 4.
Figure 4.
p38α MAPK phosphorylates ULK1. (A) p38α MAPK induces a shift in ULK1 migration. Coexpression of ULK1 and p38α MAPK in BV2 resulted in an upshift of ULK1 migration. Pretreatment of the lysates with λPPase for 30 min reversed this effect. (B) Coexpression of p38α MAPK and ULK1 in HEK293 cells leads to a shift in ULK1 migration, and SB203580 (10 µM) reverses this effect. (C) Coexpression of p38α MAPK leads to ULK1 phosphorylation at serine residues. HEK293 cells were transfected with ULK1 with or without p38α MAPK. The lysates were precipitated with an anti-ULK1 antibody and analyzed with an antibody that specifically recognizes the phosphorylated serine residues followed by a proline (S*P). (D) p38α MAPK directly phosphorylates ULK1. ULK1 was expressed in HEK293 cells and immunoprecipitated. The precipitates were incubated with or without a purified active p38α MAPK in in vitro kinase assay. (E) p38α MAPK phosphorylates ULK1 at S504 and S757. ULK1 WT and various mutants were expressed and immunoprecipitated. The precipitates were incubated with a purified active p38α MAPK in in vitro kinase assay. Mutation of both serines 504 and 757 to alanine (S504/S757A) reduced the p38α MAPK–induced ULK1 phosphorylation. (F) Mutation of ULK1 at S504/S757 blocks the p38α MAPK–induced shift in ULK1 migration. (G) p38α MAPK is required for mediating LPS-induced phosphorylation of ULK1. BV2 cells were treated with LPS (1 µg/ml) with or without SB203580 (10 µM) for 2 h. Lysates were blotted as shown. Arrows indicate band shifts. **, P < 0.01 versus control; #, P < 0.05 versus S504A or S757A. n = 3. Error bars show SD.
Figure 5.
Figure 5.
Phosphorylation by p38α MAPK reduces ULK1 kinase activity and disrupts the ULK1–ATG13 complex. (A) Expression of p38α MAPK reduces ULK1 kinase activity. MYC-ULK1 with different amounts of FLAG–p38α MAPK was cotransfected into HEK293 cells for 24 h. The activity of immunoprecipitated MYC-ULK1 was measured by in vitro kinase assay using MBP as the substrate. The bottom graph shows relative change of [32P]-MBP signal. (B) LPS treatment reduces ULK1 kinase activity. BV2 cells were treated with LPS (1 µg/ml) for the indicated time. Endogenous ULK1 was immunoprecipitated and analyzed by in vitro kinase assay. (C) p38α MAPK disrupts the ULK1–ATG13 complex and reduces ATG13 phosphorylation. ATG13 and ULK1 were coexpressed with or without coexpression of p38α MAPK in HEK293 for 24 h. The whole-cellular lysates (200 µg) were immunoprecipitated with an anti-MYC antibody, and the precipitates were blotted with an anti-HA or anti-FLAG antibody (top). The levels of phosphorylated ATG13 (S318) were determined using a phospho-S318–specific antibody (bottom). (D) SB203580 blocks p38α MAPK–induced ULK1–ATG13 complex disruption. BV2 cells were treated as described in C with the presence of SB203580 (10 µM). Co-IP was performed by incubating whole-cell lysates (200 µg) with an anti-HA antibody. WB, Western blot. (E) SB203580 blocks LPS (1 µg/ml)-induced disruption of the endogenous ULK1–ATG13 complex. BV2 cells were treated with LPS (1 µg/ml) with or without SB203580 (10 µM) for 2 h. Co-IP was performed by incubating whole-cell lysates (400 µg) with an anti-ULK1 antibody. (F) Knockdown of p38α MAPK blocks LPS (1 µg/ml)-induced disruption of the endogenous ULK1–ATG13 complex. BV2 cells were transfected with scramble or p38α MAPK–specific siRNA for 48 h and treated with LPS (1 µg/ml) for 2 h. Co-IP was performed by incubating whole-cell lysates (400 µg) with an anti-ATG13 antibody. The left panel shows the effect of knockdown. IB, immunoblot. *, P < 0.05; **, P < 0.01 versus control; ##, P < 0.01 versus p38α. n = 3. Error bars show SD.
Figure 6.
Figure 6.
LPS activates microglia through the p38α MAPK–ULK1 pathway. (A) LPS reduces LC3-II level in primary microglia and induces the microglial inflammatory response. Primary microglia were treated with different concentrations of LPS for 8 h. The levels of LC3, caspase-1, and IL-1β were assessed by Western blotting. (B) SB203580 blocks LPS-induced morphological change in cultured primary microglia. Primary microglia were treated with LPS (1 µg/ml) with or without SB203580 (10 µM) for 12 h and scored for process retraction and cell body enlargement. (C) Glyburide or SB203580 blocks LPS-induced caspase-1 activation. Primary microglia were treated with LPS (1 µg/ml) with or without SB203580 (10 µM) or the NLRP3 inflammasome inhibitor glyburide (50 µM) for 8 h and analyzed for LC3 level, caspase-1 activation, and IL-1β production. (D and E) Inhibition of ULK1 activity activates microglia. Primary microglia were treated with the ULK1 inhibitor MRT67307 (10 µM) and assayed for various markers and activated caspase-1 (8 h; D) or for morphological changes as described in B (12 h; E). Dashed lines show cell body outlines. Bars, 40 µm. n = 100. (F) ULK1 mediates LPS-induced caspase-1 activation. ULK1 WT and mutants (504A/757A and ULK1/2A or 504E/757E and ULK1/2E) were transfected into primary microglia. Cells were treated with LPS (1 µg/ml) for 8 h and analyzed for caspase-1 activation. Bars, 20 µm. n = 50. **, P < 0.01 versus control; ##, P < 0.01 versus LPS. n = 3. Error bars show SD.
Figure 7.
Figure 7.
LPS activates microglia through p38α-mediated inhibition of autophagy. (A) Knockdown of ATG5 induces morphological change in cultured primary microglia. Primary microglia were transfected with ATG5 siRNA (10 nM) for 48 h and scored for process retraction and cell body enlargement. Dashed lines show cell body outlines. Bars, 40 µm. n = 100. The below graph shows the percentage of cells with retracted processes and enlarged cell bodies. (B) Knockdown of ATG5 inhibits autophagy and induces caspase-1 activation. Primary microglia were transfected with ATG5 siRNA (10 nM) for 36 h and analyzed for LC3 level, caspase-1 activation, and IL-1β production. (C and D) Inhibition of autophagy activates microglia in the mouse brain. 3-MA was injected via i.p. (10 mg/kg/d) into 1-mo-old CD1 mice. After 2 d, cortical brain tissues were dissected for Western blotting (C), or whole animals were perfused with saline and 4% paraformaldehyde for Iba1 immunostaining (D). (E and F) SB203580 blocks LPS-induced inhibition of autophagy and microglia activation in mouse brains. LPS (5 µg/side; I.C.V.) was injected into 1-mo-old CD1 mice. SB203580 (2 mg/animal; i.p.) was injected 2 h before and 0 h after LPS admission. 24 h later, cortical brain tissues were dissected for Western blotting (E), or whole animals were perfused with saline and 4% paraformaldehyde for Iba1 immunostaining (F). Bars, 50 µm. n = 100. **, P < 0.01 versus control; ##, P < 0.01 versus LPS. n = 8/group. Experiments were repeated three times. Error bars show SD.

Comment in

References

    1. Bachstetter A.D., and Van Eldik L.J.. 2010. The p38 MAP Kinase Family as Regulators of Proinflammatory Cytokine Production in Degenerative Diseases of the CNS. Aging Dis. 1:199–211. - PMC - PubMed
    1. Bachstetter A.D., Xing B., de Almeida L., Dimayuga E.R., Watterson D.M., and Van Eldik L.J.. 2011. Microglial p38α MAPK is a key regulator of proinflammatory cytokine up-regulation induced by toll-like receptor (TLR) ligands or beta-amyloid (Aβ). J. Neuroinflammation. 8:79 10.1186/1742-2094-8-79 - DOI - PMC - PubMed
    1. Blasi E., Barluzzi R., Bocchini V., Mazzolla R., and Bistoni F.. 1990. Immortalization of murine microglial cells by a v-raf/v-myc carrying retrovirus. J. Neuroimmunol. 27:229–237. 10.1016/0165-5728(90)90073-V - DOI - PubMed
    1. Chan E.Y., Longatti A., McKnight N.C., and Tooze S.A.. 2009. Kinase-inactivated ULK proteins inhibit autophagy via their conserved C-terminal domains using an Atg13-independent mechanism. Mol. Cell. Biol. 29:157–171. 10.1128/MCB.01082-08 - DOI - PMC - PubMed
    1. Delgado M.A., Elmaoued R.A., Davis A.S., Kyei G., and Deretic V.. 2008. Toll-like receptors control autophagy. EMBO J. 27:1110–1121. 10.1038/emboj.2008.31 - DOI - PMC - PubMed

Publication types

MeSH terms

LinkOut - more resources