

SelexGLM differentiates androgen and glucocorticoid receptor DNA-binding preference over an extended binding site
- PMID: 29196557
- PMCID: PMC5749176
- DOI: 10.1101/gr.222844.117
SelexGLM differentiates androgen and glucocorticoid receptor DNA-binding preference over an extended binding site
Abstract
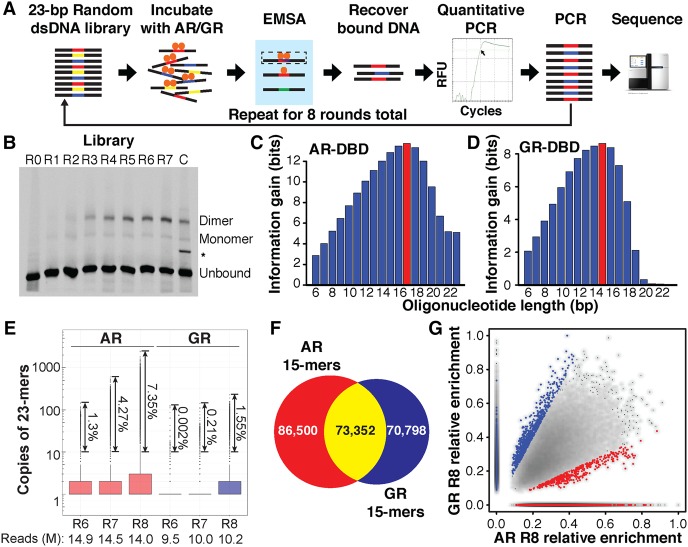
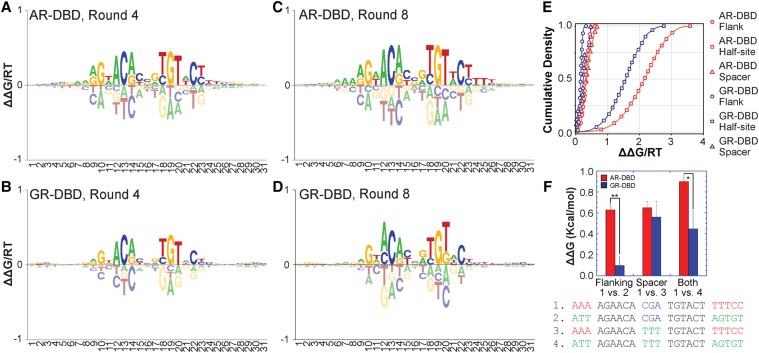
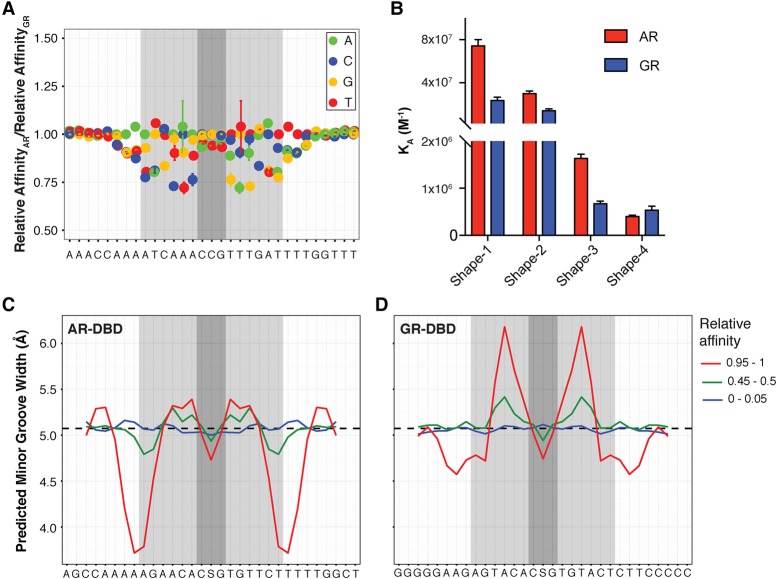
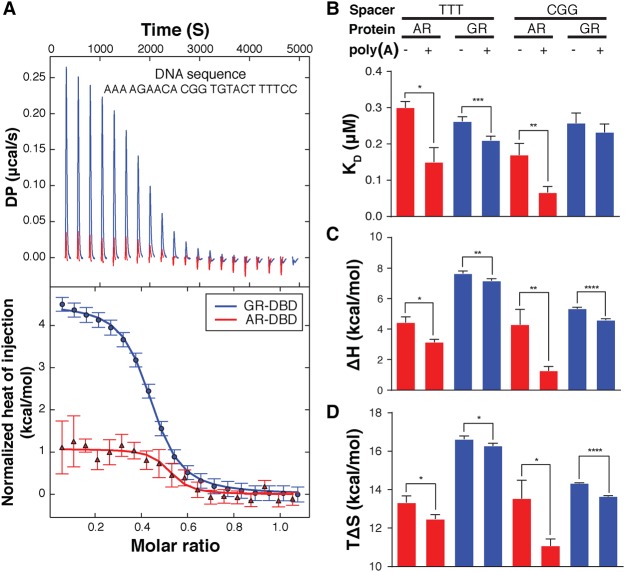
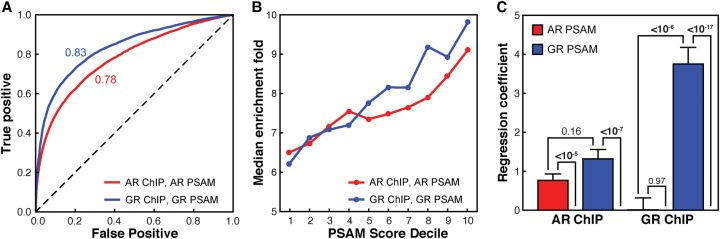
The DNA-binding interfaces of the androgen (AR) and glucocorticoid (GR) receptors are virtually identical, yet these transcription factors share only about a third of their genomic binding sites and regulate similarly distinct sets of target genes. To address this paradox, we determined the intrinsic specificities of the AR and GR DNA-binding domains using a refined version of SELEX-seq. We developed an algorithm, SelexGLM, that quantifies binding specificity over a large (31-bp) binding site by iteratively fitting a feature-based generalized linear model to SELEX probe counts. This analysis revealed that the DNA-binding preferences of AR and GR homodimers differ significantly, both within and outside the 15-bp core binding site. The relative preference between the two factors can be tuned over a wide range by changing the DNA sequence, with AR more sensitive to sequence changes than GR. The specificity of AR extends to the regions flanking the core 15-bp site, where isothermal calorimetry measurements reveal that affinity is augmented by enthalpy-driven readout of poly(A) sequences associated with narrowed minor groove width. We conclude that the increased specificity of AR is correlated with more enthalpy-driven binding than GR. The binding models help explain differences in AR and GR genomic binding and provide a biophysical rationale for how promiscuous binding by GR allows functional substitution for AR in some castration-resistant prostate cancers.
© 2018 Zhang et al.; Published by Cold Spring Harbor Laboratory Press.
Figures
Similar articles
-
The Dual Androgen Receptor and Glucocorticoid Receptor Antagonist CB-03-10 as Potential Treatment for Tumors that have Acquired GR-mediated Resistance to AR Blockade.Mol Cancer Ther. 2020 Nov;19(11):2256-2266. doi: 10.1158/1535-7163.MCT-19-1137. Epub 2020 Aug 26. Mol Cancer Ther. 2020. PMID: 32847976
-
Rational drug design for androgen receptor and glucocorticoids receptor dual antagonist.Eur J Med Chem. 2019 Mar 15;166:232-242. doi: 10.1016/j.ejmech.2019.01.036. Epub 2019 Jan 26. Eur J Med Chem. 2019. PMID: 30711833
-
FoxA1 specifies unique androgen and glucocorticoid receptor binding events in prostate cancer cells.Cancer Res. 2013 Mar 1;73(5):1570-80. doi: 10.1158/0008-5472.CAN-12-2350. Epub 2012 Dec 26. Cancer Res. 2013. PMID: 23269278
-
Is the glucocorticoid receptor a key player in prostate cancer?: A literature review.Medicine (Baltimore). 2022 Jul 22;101(29):e29716. doi: 10.1097/MD.0000000000029716. Medicine (Baltimore). 2022. PMID: 35866830 Free PMC article. Review.
-
Recent advances in allosteric androgen receptor inhibitors for the potential treatment of castration-resistant prostate cancer.Pharm Pat Anal. 2015;4(5):387-402. doi: 10.4155/ppa.15.20. Epub 2015 Sep 21. Pharm Pat Anal. 2015. PMID: 26389532 Review.
Cited by
-
Comparison of discriminative motif optimization using matrix and DNA shape-based models.BMC Bioinformatics. 2018 Mar 6;19(1):86. doi: 10.1186/s12859-018-2104-7. BMC Bioinformatics. 2018. PMID: 29510689 Free PMC article.
-
Mechanistic insights into transcription factor cooperativity and its impact on protein-phenotype interactions.Nat Commun. 2020 Jan 8;11(1):124. doi: 10.1038/s41467-019-13888-7. Nat Commun. 2020. PMID: 31913281 Free PMC article.
-
Top-Down Crawl: a method for the ultra-rapid and motif-free alignment of sequences with associated binding metrics.Bioinformatics. 2022 Nov 15;38(22):5121-5123. doi: 10.1093/bioinformatics/btac653. Bioinformatics. 2022. PMID: 36179084 Free PMC article.
-
Androgen Receptor-Mediated Transcription in Prostate Cancer.Cells. 2022 Mar 5;11(5):898. doi: 10.3390/cells11050898. Cells. 2022. PMID: 35269520 Free PMC article. Review.
-
Hidden modes of DNA binding by human nuclear receptors.Nat Commun. 2023 Jul 13;14(1):4179. doi: 10.1038/s41467-023-39577-0. Nat Commun. 2023. PMID: 37443151 Free PMC article.
References
-
- Alipanahi B, Delong A, Weirauch MT, Frey BJ. 2015. Predicting the sequence specificities of DNA- and RNA-binding proteins by deep learning. Nat Biotechnol 33: 831–838. - PubMed
-
- Arbuckle ND, Luisi B. 1995. A recipe for specificity. Nat Struct Biol 2: 341–346. - PubMed
-
- Atherton J, Boley N, Brown B, Ogawa N, Davidson SM, Eisen MB, Biggin MD, Bickel P. 2012. A model for sequential evolution of ligands by exponential enrichment (SELEX) data. Ann Appl Stat 6: 928–949.
Publication types
MeSH terms
Substances
Grants and funding
LinkOut - more resources
Full Text Sources
Other Literature Sources
Research Materials