. 2017 Dec 1;8(1):1896.
doi: 10.1038/s41467-017-01917-2.

Remodelling of the gut microbiota by hyperactive NLRP3 induces regulatory T cells to maintain homeostasis

Affiliations

Remodelling of the gut microbiota by hyperactive NLRP3 induces regulatory T cells to maintain homeostasis

Xiaomin Yao et al. Nat Commun. .

Abstract

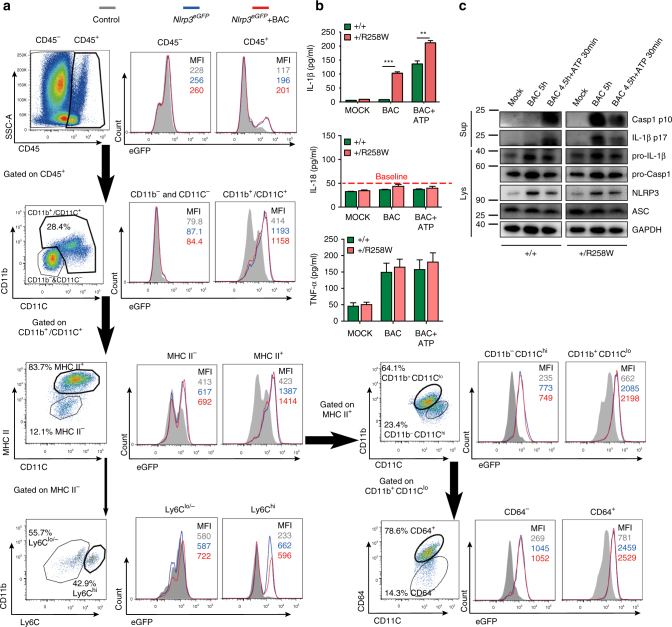
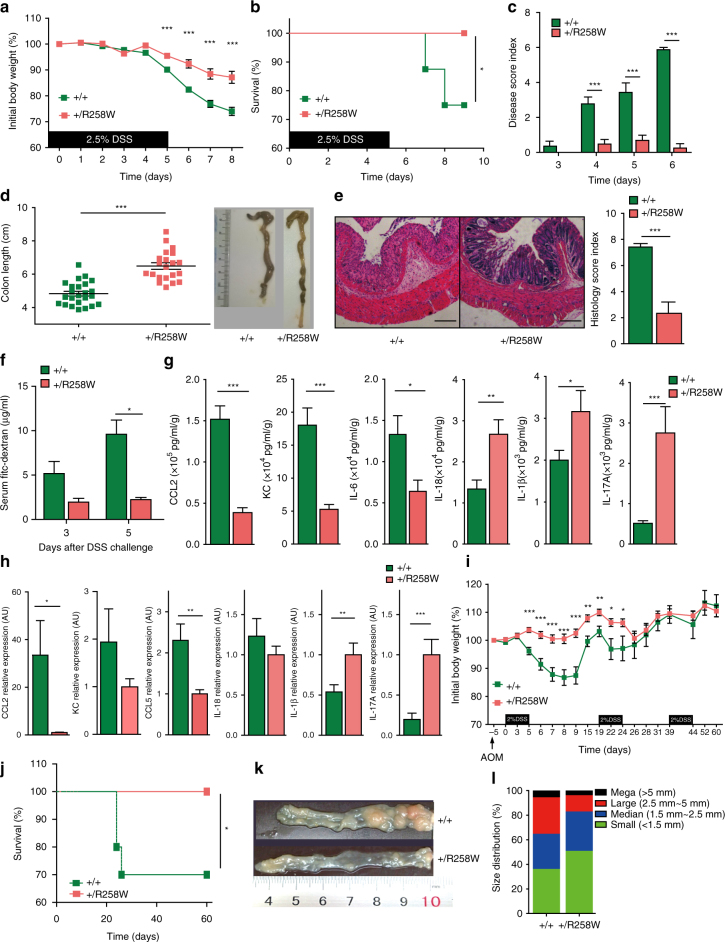
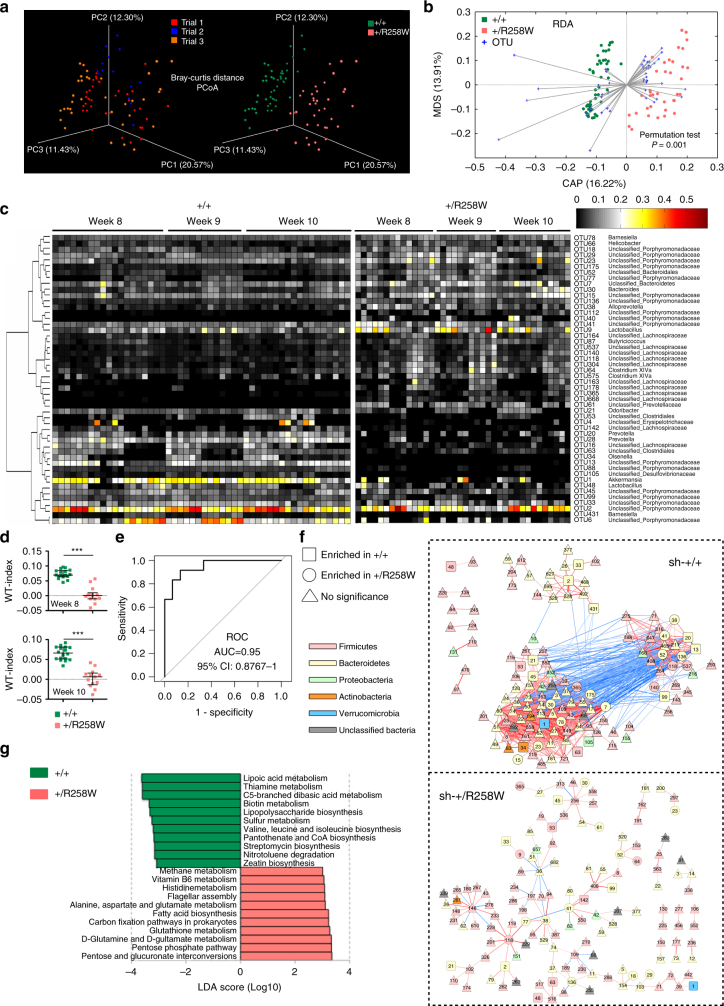
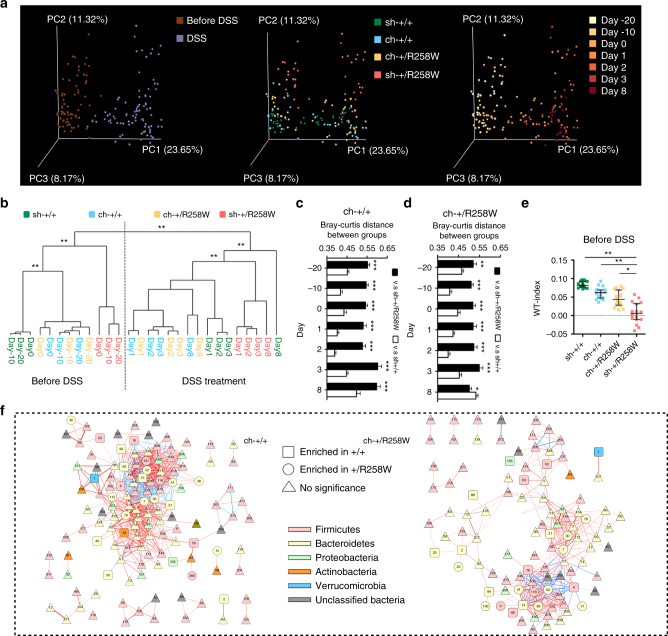
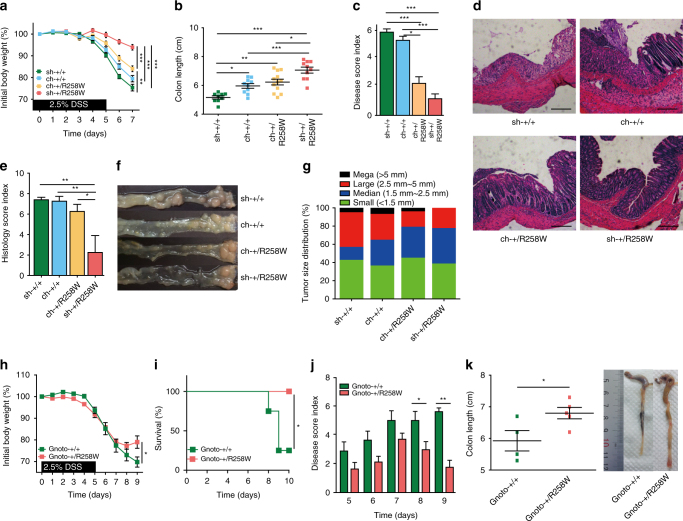
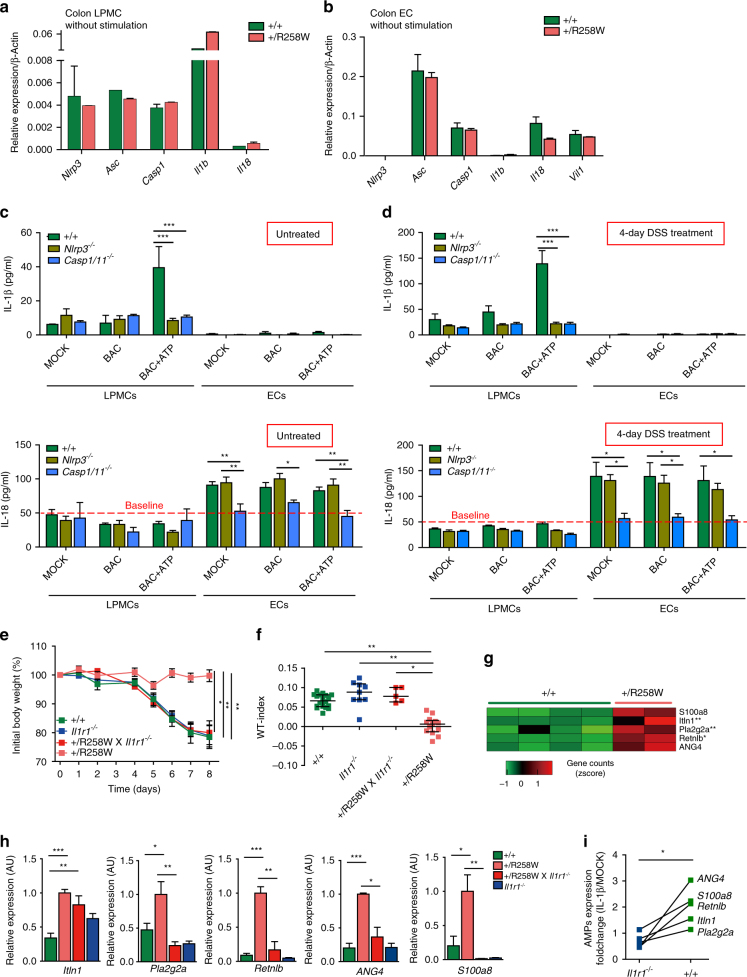
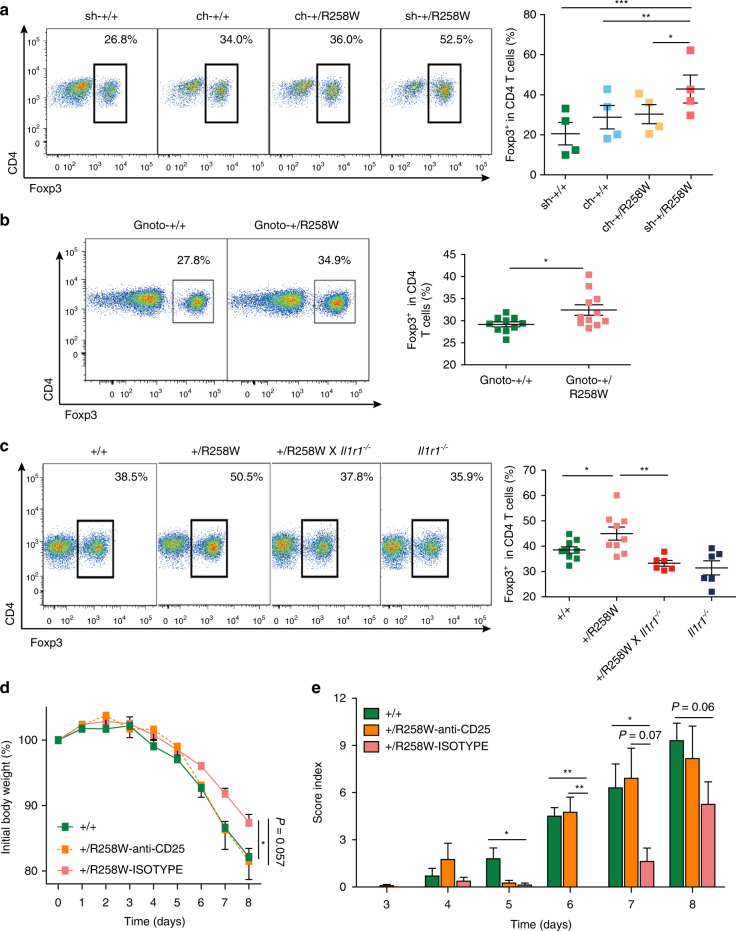
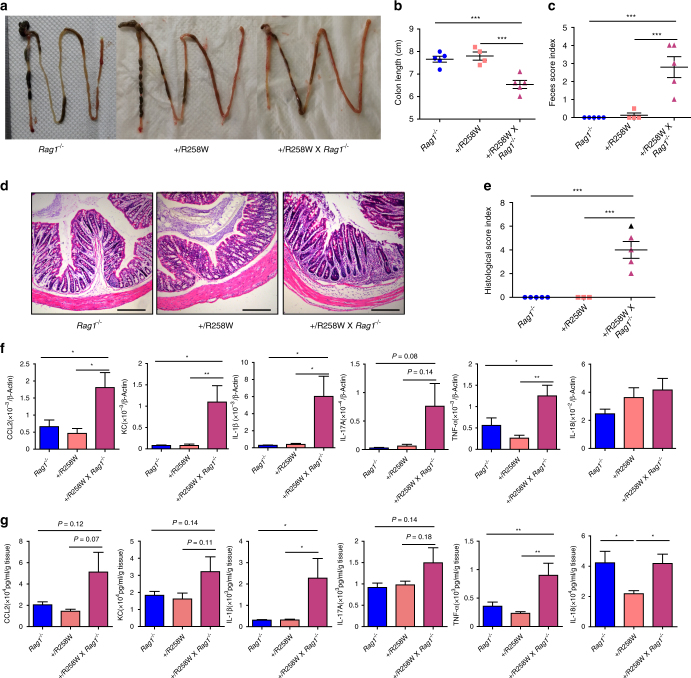
Inflammasomes are involved in gut homeostasis and inflammatory pathologies, but the role of NLRP3 inflammasome in these processes is not well understood. Cryopyrin-associated periodic syndrome (CAPS) patients with NLRP3 mutations have autoinflammation in skin, joints, and eyes, but not in the intestine. Here we show that the intestines of CAPS model mice carrying an Nlrp3 R258W mutation maintain homeostasis in the gut. Additionally, such mice are strongly resistant to experimental colitis and colorectal cancer; this is mainly through a remodelled gut microbiota with enhanced anti-inflammatory capacity due to increased induction of regulatory T cells (Tregs). Mechanistically, NLRP3R258W functions exclusively in the lamina propria mononuclear phagocytes to directly enhance IL-1β but not IL-18 secretion. Increased IL-1β boosts local antimicrobial peptides to facilitate microbiota remodelling. Our data show that NLRP3R258W-induced remodelling of the gut microbiota, induces local Tregs to maintain homeostasis and compensate for otherwise-detrimental intestinal inflammation.


Conflict of interest statement

The authors declare no competing financial interests.

Figures

Fig. 1
Fig. 1
Intestinal lamina propria CD11b+/CD11C+ mononuclear phagocytes from Nlrp3 R258W mice contain hyperactive inflammasome. a Colonic lamina propria mononuclear cells (LPMCs) were isolated from control mice (gray filled) or Nlrp3 eGFP reporter mice left untreated (blue line), or stimulated with heat-inactivated fecal bacteria (BAC) at multiplicity of infection (MOI) = 20:1 for 4 h (red line); different cell populations were identified by the indicated surface markers and were examined for NLRP3-eGFP expression. MFI represents geomean fluorescence intensity of eGFP in each sample. b, c Colonic LPMCs were stimulated with BAC (MOI = 20:1) for 12 h (b) or 5 h (c) with or without a ATP pulse for 30 min; control cells (MOCK) were not stimulated. IL-1β, IL-18, and TNF-α in the supernatants were determined through ELISA. The data are representative of at least three independent experiments and are shown as the means ± SEM. **P < 0.01, ***P < 0.001 (Two-tailed Student’s t test) (b); cleaved caspase-1 p10 subunit, IL-1β-p17 fragment in the supernatants (Sup), and their pro-forms together with NLRP3, ASC, and GAPDH in the cell lysates (Lys) were detected by western blot (c)
Fig. 2
Fig. 2
Nlrp3 R258W mice are resistant to DSS-induced colitis and colorectal cancer. ac Colitis was induced in the WT (n = 32) and Nlrp3 R258W (n = 21) mice using 2.5% DSS. The body weights (a change in percentage), survival rates (b change in percentage), and disease scores (c arbitrary unit) were assessed daily. d The colon lengths were measured from the cecum–colon junction to the anus end of a loosely stretched colon with a straight ruler upon killing of indicated experimental mice on day 8 and representative examples are shown. e Hematoxylin and eosin (H&E)-stained transverse sections of the colons were examined and scored as described in the “Methods” section. Representative images of these samples are shown; the scale bar is 200 µm. f WT (n = 6 for 3 days, n = 3 for 5 days) and Nlrp3 R258W (n = 3 for 3 days, n = 3 for 5 days) mice were treated with 2.5% DSS in drinking water for indicated days, then they were gavaged with FITC-Dextran and leakage of FITC-Dextran into the serum was measured 4 h later. g The indicated cytokines or chemokines in the culture supernatants of colon tissues from mice as shown in d were determined via ELISA. h The indicated transcripts from colon tissue homogenates from mice as shown in d were analyzed by Q-PCR. AU arbitrary unit. il WT (n = 10) and Nlrp3 R258W (n = 11) mice were treated with AOM + DSS to induce colon cancer. The body weights (i) and survival rates (j) were monitored. The final tumor loads (k) were shown as representative images, and the tumor size distributions (l) were determined. The data are shown as the means ± SEM. *P < 0.05, **P < 0.01, ***P < 0.001 (Two-tailed Student’s t test). Survival rate b, j difference is tested by Log-rank (Mantel–Cox) test, *P < 0.05
Fig. 3
Fig. 3
Nlrp3 R258W mice carry a unique gut microbiota with a sparingly inerconnected ecology and altered functionality. af Fecal microbiota composition was assayed by bacterial 16S rRNA V3–V4 region sequencing: a PCoA plot (based on Bray–Curtis distance) of the gut microbiota from three trials of WT (n = 18, 9, and 18) and Nlrp3 R258W (n = 18, 5, and 15) mice. b Redundancy analysis ordination biplot based on the Hellinger-transformed Euclidean distance among samples and the eigenvalues for 50 OTUs (which explained more than 10% of the variability of the samples). c Heat map of the 50 key OTUs in gut microbiota from WT and Nlrp3 R258W mice at the age of 8, 9, and 10 weeks in trials 1–3. d The WT indices of the gut microbiota from WT and Nlrp3 R258W mice at the age of 8 and 10 weeks in trials 1–3. The medians with interquartile ranges are shown. ***P < 0.001 (Mann–Whitney test). e The area under the ROC curve (AUC) of the gut–microbiota-based classification of the WT and Nlrp3 R258W mice. The WT-index was computed for another set of WT (n = 12) and Nlrp3 R258W (n = 15) samples (trial 4). f The network of OTUs (shared by more than 40% of samples) in the WT (+/+) and Nlrp3 R258W (+/R258W) mice during DSS treatment (n = 6 from day −20 to day 2 and n = 4 on days 3 and 8). The lines represent positive (red) and negative (blue) correlations between the nodes, with the line width indicating the correlation magnitude. Only nodes with |R| > 0.7 are drawn, and unconnected nodes have been omitted. g Metagenomic analysis of key pathways of gut microbiota shift in Nlrp3 R258W mice. Histogram shows the LDA scores computed for features (on the pathway level) that are differentially abundant between the WT and Nlrp3 R258W mice
Fig. 4
Fig. 4
The gut microbiota of the Nlrp3 R258W mice is affected by cohousing with WT littermates. af Fecal microbiota composition was assayed by bacterial 16S rRNA V3–V4 region sequencing: a PCoA plot (based on Bray–Curtis distance) of the fecal microbiota of singly housed WT (sh-+/+), cohoused WT (ch-+/+), cohoused Nlrp3 R258W (ch-+/R258W), and singly housed Nlrp3 R258W (sh-+/R258W) mice (n = 6 in each group) before and during DSS treatment. b Clustering of the gut microbiota based on distances between different groups with the first 16 PCs (accounting for 80% of total variations) of the PCoA based on the Bray–Curtis distance. **P < 0.01 (MANOVA test). (c, d The Bray–Curtis distance of the ch-+/+ (c) and ch-+/R258W (d) gut microbiota to the sh-animals was calculated. The data are shown as means ± SEM. *P < 0.05, **P < 0.01, ***P < 0.001 (two-tailed Student’s t test). e The WT indices of sh-+/+, ch-+/+, ch-+/R258W, and sh-+/R258W mice before DSS treatment: the medians with interquartile ranges are shown. *P < 0.05, **P < 0.01 (Kruskal–Wallis test). f The network of OTUs (shared by more than 40% samples) in co-house WT mice and co-house Nlrp3 R258W mice during DSS treatment (n = 6 from day −20 to day 3 and n = 4 on day 8). The red lines represent positive correlations between the nodes and the blue lines represent negative correlations, with line width indicating the correlation magnitude. Only the |R| is greater than 0.7 are drawn, and unconnected nodes have been omitted (refer to Fig. 3f)
Fig. 5
Fig. 5
The gut microbiota of Nlrp3 R258W mice confers resistance to DSS-induced colitis and colorectal cancer. ae Acute colitis was induced in sh-+/+ (n = 13) and sh-+/R258W (n = 10) mice and 1:1 cohoused (ch-, n = 12 for each genotype) mice. The analyses of body weights (a), colon length (b), disease scores (c), histological examination (d), scale bar is 200 μm, and histological score (e) were conducted as described in Fig. 2, except that the mice were killed on day 7. The data in a, b, c and e are shown as the means ± SEM. *P < 0.05, **P < 0.01, ***P < 0.001 (one-way ANOVA with Tukey’s post-hoc test). f, g Colon cancer was induced and monitored in singly housed and cohoused mice (n = 6 for each group), the representative colon tumor (f) and total tumor size distribution (g) were shown. hk Feces from the WT and Nlrp3 R258W mice were transplanted to germ-free WT mice (Gnoto-+/+, n = 4, Gnoto-+/R258W, n = 5), and acute colitis was then induced with 2.5% DSS. The diseases were assayed as described in Fig. 2, except that the mice were killed on day 9. The data in h, j and k are shown as the means ± SEM. *P < 0.05, **P < 0.01 (two-tailed Student’s t test). Survival rate is shown in i, *P < 0.05 (Log-rank (Mantel–Cox) test)
Fig. 6
Fig. 6
The Nlrp3 R258W gut microbiota is shaped by IL-1β-induced antimicrobial peptides. a, b Colonic LPMCs and epithelial cells (ECs) were isolated from WT and Nlrp3 R258W mice and assayed for the expression of the indicated genes via Q-PCR without stimulation. The data are shown as the means ± SEM. c, d Colonic LPMCs and ECs were isolated from naive (c n = 3 for each genotype) or 4 days 4% DSS-treated (d n = 4 for each genotype) WT, Nlrp3 −/− and Casp1/11 −/− mice, the cells were treated with BAC (MOI = 20:1) ± ATP, and the culture media was assayed for IL-1β and IL-18 secretion via ELISA. The data are shown as the means ± SEM. *P < 0.05, **P < 0.01, ***P < 0.001 (one-way ANOVA with Tukey’s post-hoc test). e Changes in body weight in WT (n = 8), Il1r1 −/− (n = 9), Nlrp3 R258W x IL1r1 −/− (n = 6), and Nlrp3 R258W (n = 5) mice during DSS-induced colitis. The data are shown as the means ± SEM, *P < 0.05, **P < 0.01 (one-way ANOVA with Tukey’s post-hoc test). f The microbiota WT-index was also calculated for mice in e before DSS treatment. The medians with interquartile ranges are shown. *P < 0.05, **P < 0.01 (Kruskal–Wallis test). g Untreated WT (n = 4) and Nlrp3 R258W (n = 2) mice colon tissue RNA was assayed by RNAseq analysis, selected AMPs were shown to be upregulated in the Nlrp3 R258W colon at varied extent. *P < 0.05, **P < 0.01 (statistical comparison was conducted using DESeq2, see “Methods” section). h AMPs expression in untreated colon tissue from WT, Nlrp3 R258W, Nlrp3 R258Wx IL1r1 −/− and IL1r1 −/− mice were analyzed by Q-PCR. AU arbitrary unit. The data are shown as the means ± SEM, *P < 0.05, **P < 0.01, ***P < 0.001 (one-way ANOVA with Tukey’s post-hoc test). i Colon tissues from Il1r1 −/− and WT mice were stimulated with 50 ng/ml mIL-1β for 4 h. Fold changes of AMPs expression (IL-1β stimulation vs. untreated) in colon tissues are shown. *P < 0.05 (two-tailed paired t test)
Fig. 7
Fig. 7
The reshaped microbiota in Nlrp3 R258W mice resists gut inflammation through boosting local Tregs. a Colonic lamina propria cells were isolated from either cohoused or singly housed WT/Nlrp3 R258W mice, intracellular Foxp3 level from CD4+ T cells was analyzed through flow cytometry. The representative samples were shown and the percentage of Foxp3+ cells in CD4+ T cells was summarized. The data are shown as the means ± SEM, *P < 0.05, **P < 0.01, ***P < 0.001 (repeated measures ANOVA with Dunnett’s post-hoc test). b Feces from the WT and Nlrp3 R258W mice were transplanted to germ-free WT mice (Gnoto-+/+, n = 10, Gnoto-+/R258W, n = 11), colonic lamina propria cells were isolated and intracellular Foxp3 level from CD4+ T cells was analyzed through flow cytometry. The representative samples were shown and the percentage of Foxp3+ cells in CD4+ T cells was summarized. The data are shown as the means ± SEM, *P < 0.05 (two-tailed Student’s t test) c Colonic lamina propria cells were isolated from WT, Nlrp3 R258W, Nlrp3 R258W x Il1r1 −/−, and Il1r1 −/− mice, intracellular Foxp3 level from CD4+ T cells was analyzed through flow cytometry. The representative samples were shown and the percentage of Foxp3+ cells in CD4+ T cells was summarized. The data are shown as the means ± SEM, *P < 0.05, **P < 0.01 (one-way ANOVA with Tukey’s post-hoc test). d, e WT untreated mice (n = 5), Nlrp3 R258W mice i.p. injected with isotype antibody (n = 4) and Nlrp3 R258W mice i.p. injected with anti-CD25 antibody (n = 6) on day −4 and day −2 with 500 µg/mouse/injection were subjected for colitis induction with 4% DSS from day 0. The body weights (d) and disease scores (e) were assessed daily. Data are shown as the means ± SEM. *P < 0.05, **P < 0.01 (two-tailed Student’s t test)
Fig. 8
Fig. 8
The Nlrp3 R258W x Rag1 −/− mice develop spontaneous colitis. ae Characterization of the spontaneous colitis in Nlrp3 R258W x Rag1 −/− mice (n = 5) together with Rag1 −/− (n = 5) and Nlrp3 R258W (n = 4) mice as control, the morphology (a), colon length (b), feces score (c), and histological examination (d), scale bar is 200 μm, and histological score (e) of Rag1 −/−, Nlrp3 R258W, and Nlrp3 R258W × Rag1 −/− mice were monitored. f, g The indicated inflammatory cytokine/chemokine expression (f) and secretion (g) from the colon tissue of indicated mice were determined through Q-PCR and ELISA, respectively. Data are shown as the means ± SEM. *P < 0.05, **P < 0.01, ***P < 0.001 (one-way ANOVA with Dunnett’s post-hoc test)

Similar articles

Cited by

References

    1. Aychek T, Jung S. Immunology. The axis of tolerance. Science. 2014;343:1439–1440. doi: 10.1126/science.1252785. - DOI - PubMed
    1. Mueller C, Macpherson AJ. Layers of mutualism with commensal bacteria protect us from intestinal inflammation. Gut. 2006;55:276–284. doi: 10.1136/gut.2004.054098. - DOI - PMC - PubMed
    1. Maloy KJ, Powrie F. Intestinal homeostasis and its breakdown in inflammatory bowel disease. Nature. 2011;474:298–306. doi: 10.1038/nature10208. - DOI - PubMed
    1. Kuhn R, Lohler J, Rennick D, Rajewsky K, Muller W. Interleukin-10-deficient mice develop chronic enterocolitis. Cell. 1993;75:263–274. doi: 10.1016/0092-8674(93)80068-P. - DOI - PubMed
    1. Sellon RK, et al. Resident enteric bacteria are necessary for development of spontaneous colitis and immune system activation in interleukin-10-deficient mice. Infect. Immun. 1998;66:5224–5231. - PMC - PubMed

Publication types

MeSH terms

LinkOut - more resources