

Repurposing a photosynthetic antenna protein as a super-resolution microscopy label
- PMID: 29196704
- PMCID: PMC5711914
- DOI: 10.1038/s41598-017-16834-z
Repurposing a photosynthetic antenna protein as a super-resolution microscopy label
Abstract
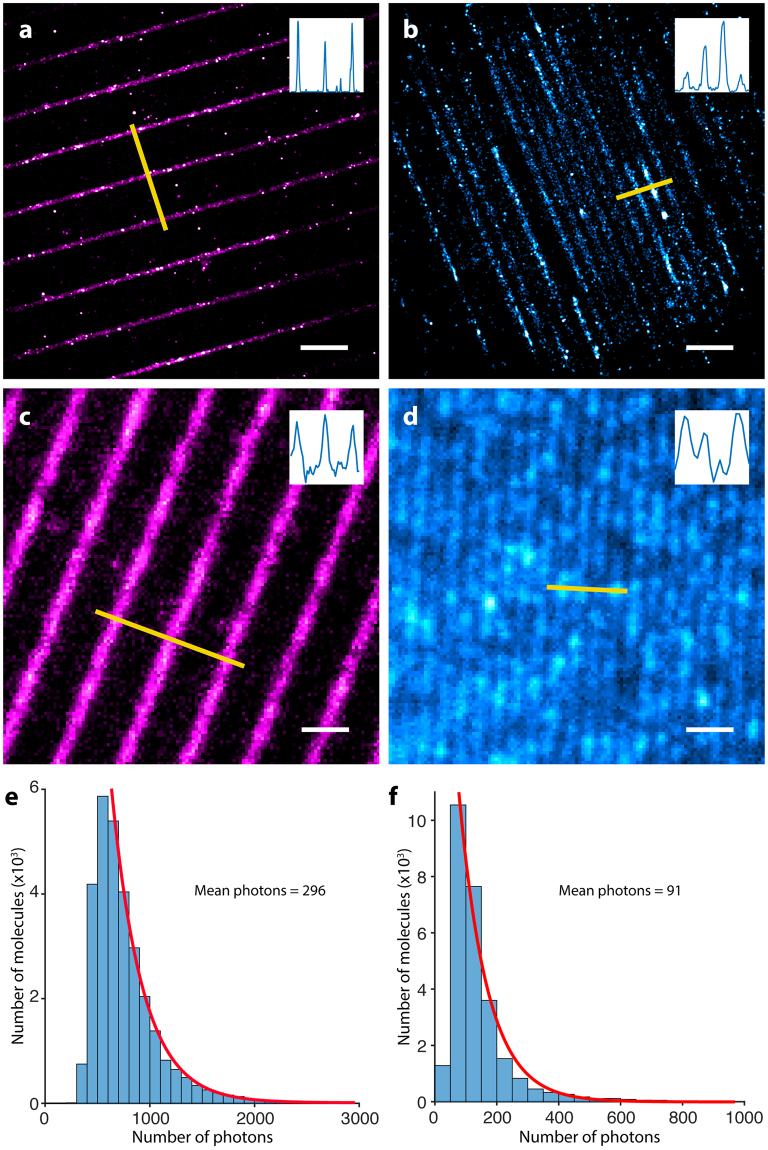
Techniques such as Stochastic Optical Reconstruction Microscopy (STORM) and Structured Illumination Microscopy (SIM) have increased the achievable resolution of optical imaging, but few fluorescent proteins are suitable for super-resolution microscopy, particularly in the far-red and near-infrared emission range. Here we demonstrate the applicability of CpcA, a subunit of the photosynthetic antenna complex in cyanobacteria, for STORM and SIM imaging. The periodicity and width of fabricated nanoarrays of CpcA, with a covalently attached phycoerythrobilin (PEB) or phycocyanobilin (PCB) chromophore, matched the lines in reconstructed STORM images. SIM and STORM reconstructions of Escherichia coli cells harbouring CpcA-labelled cytochrome bd 1 ubiquinol oxidase in the cytoplasmic membrane show that CpcA-PEB and CpcA-PCB are suitable for super-resolution imaging in vivo. The stability, ease of production, small size and brightness of CpcA-PEB and CpcA-PCB demonstrate the potential of this largely unexplored protein family as novel probes for super-resolution microscopy.
Conflict of interest statement
The authors declare that they have no competing interests.
Figures


Similar articles
-
Adapting photosynthesis to the near-infrared: non-covalent binding of phycocyanobilin provides an extreme spectral red-shift to phycobilisome core-membrane linker from Synechococcus sp. PCC7335.Biochim Biophys Acta. 2016 Jun;1857(6):688-94. doi: 10.1016/j.bbabio.2016.03.033. Epub 2016 Apr 2. Biochim Biophys Acta. 2016. PMID: 27045046
-
Functional Modification of Cyanobacterial Phycobiliprotein and Phycobilisomes through Bilin Metabolism Control.ACS Synth Biol. 2024 Aug 16;13(8):2391-2401. doi: 10.1021/acssynbio.4c00094. Epub 2024 Jul 22. ACS Synth Biol. 2024. PMID: 39038807 Free PMC article.
-
Combinatorial biosynthesis of Synechocystis PCC6803 phycocyanin holo-α-subunit (CpcA) in Escherichia coli and its activities.Appl Microbiol Biotechnol. 2016 Jun;100(12):5375-88. doi: 10.1007/s00253-016-7367-1. Epub 2016 Feb 10. Appl Microbiol Biotechnol. 2016. PMID: 26860945
-
Biosynthesis of phycobilins. Formation of the chromophore of phytochrome, phycocyanin and phycoerythrin.J Photochem Photobiol B. 1990 Apr 1;5(1):3-23. doi: 10.1016/1011-1344(90)85002-e. J Photochem Photobiol B. 1990. PMID: 2111391 Review.
-
[Cyanobacterial Phycobilisomes and Phycobiliproteins].Mikrobiologiia. 2015 Mar-Apr;84(2):131-43. Mikrobiologiia. 2015. PMID: 26263619 Review. Russian.
Cited by
-
De novo design of energy transfer proteins housing excitonically coupled chlorophyll special pairs.Res Sq [Preprint]. 2023 Apr 21:rs.3.rs-2736786. doi: 10.21203/rs.3.rs-2736786/v1. Res Sq. 2023. Update in: Nat Chem Biol. 2024 Jul;20(7):906-915. doi: 10.1038/s41589-024-01626-0. PMID: 37131790 Free PMC article. Updated. Preprint.
-
De novo design of proteins housing excitonically coupled chlorophyll special pairs.Nat Chem Biol. 2024 Jul;20(7):906-915. doi: 10.1038/s41589-024-01626-0. Epub 2024 Jun 3. Nat Chem Biol. 2024. PMID: 38831036 Free PMC article.
References
-
- Sidler, W.A. Phycobilisome and Phycobilliprotein structure. In The Molecular Biology of Cyanobacteria (pp. 139–216). Springer, Netherlands (1994).
-
- Glazer AN. Light guides. Directional energy transfer in a photosynthetic antenna. J. Biol. Chem. 1989;264:1–4. - PubMed
-
- Glazer AN. Phycobiliproteins—a family of valuable, widely used fluorophores. J. Appl. Phycol. 1994;6:105–112. doi: 10.1007/BF02186064. - DOI
Publication types
MeSH terms
Substances
Grants and funding
LinkOut - more resources
Full Text Sources
Other Literature Sources
