Radiopharmaceutical tracers for cardiac imaging
- PMID: 29196910
- PMCID: PMC6133155
- DOI: 10.1007/s12350-017-1131-5
Radiopharmaceutical tracers for cardiac imaging
Erratum in
-
Correction to: Radiopharmaceutical tracers for cardiac imaging.J Nucl Cardiol. 2018 Aug;25(4):1237-1241. doi: 10.1007/s12350-018-1184-0. J Nucl Cardiol. 2018. PMID: 29368086 Free PMC article.
Abstract
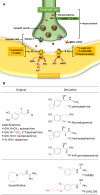
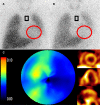
Cardiovascular disease (CVD) is the leading cause of death and disease burden worldwide. Nuclear myocardial perfusion imaging with either single-photon emission computed tomography or positron emission tomography has been used extensively to perform diagnosis, monitor therapies, and predict cardiovascular events. Several radiopharmaceutical tracers have recently been developed to evaluate CVD by targeting myocardial perfusion, metabolism, innervation, and inflammation. This article reviews old and newer used in nuclear cardiac imaging.
Keywords: Cardiovascular disease; positron emission tomography; radiopharmaceutical; single-photon emission computed tomography.
Figures


Comment in
-
Radiopharmaceuticals for cardiac imaging: Current status and future trends.J Nucl Cardiol. 2018 Aug;25(4):1242-1246. doi: 10.1007/s12350-018-1194-y. Epub 2018 Feb 7. J Nucl Cardiol. 2018. PMID: 29417412 No abstract available.
Similar articles
-
Fasting FDG PET compared to MPI SPECT in cardiac sarcoidosis.J Nucl Cardiol. 2011 Apr;18(2):371-4. doi: 10.1007/s12350-011-9347-2. J Nucl Cardiol. 2011. PMID: 21318450 No abstract available.
-
Development of radiolabeled compounds for myocardial perfusion imaging.Curr Pharm Des. 2012;18(8):1041-57. doi: 10.2174/138161212799315876. Curr Pharm Des. 2012. PMID: 22272824 Review.
-
Nuclear Imaging of the Cardiac Sympathetic Nervous System: A Disease-Specific Interpretation in Heart Failure.JACC Cardiovasc Imaging. 2020 Apr;13(4):1036-1054. doi: 10.1016/j.jcmg.2019.01.042. Epub 2019 Jul 17. JACC Cardiovasc Imaging. 2020. PMID: 31326479 Review.
-
Association between resting amygdalar activity and abnormal cardiac function in women and men: a retrospective cohort study.Eur Heart J Cardiovasc Imaging. 2019 Jun 1;20(6):625-632. doi: 10.1093/ehjci/jez047. Eur Heart J Cardiovasc Imaging. 2019. PMID: 31083711
-
PET/CT Evaluation of Cardiac Sarcoidosis.PET Clin. 2019 Apr;14(2):223-232. doi: 10.1016/j.cpet.2018.12.004. Epub 2019 Feb 1. PET Clin. 2019. PMID: 30826020 Review.
Cited by
-
Automatic Quantitative Assessment for Diagnostic and Therapeutic Response in Rodent Myocardial Infarct Model.Biomedicines. 2024 Jan 18;12(1):219. doi: 10.3390/biomedicines12010219. Biomedicines. 2024. PMID: 38255324 Free PMC article.
-
Current status and perspectives of nuclear cardiology.Ann Nucl Med. 2024 Jan;38(1):20-30. doi: 10.1007/s12149-023-01878-1. Epub 2023 Oct 27. Ann Nucl Med. 2024. PMID: 37891375 Review.
-
From radiolabeling to receptor quantification: preclinical assessment of [99mTc]Tc-carvedilol as a cardiac β-adrenoceptor probe.Front Pharmacol. 2025 Jul 8;16:1581598. doi: 10.3389/fphar.2025.1581598. eCollection 2025. Front Pharmacol. 2025. PMID: 40697658 Free PMC article.
-
Ten things to know about ten imaging studies: A preventive cardiology perspective ("ASPC top ten imaging").Am J Prev Cardiol. 2021 Mar 27;6:100176. doi: 10.1016/j.ajpc.2021.100176. eCollection 2021 Jun. Am J Prev Cardiol. 2021. PMID: 34327499 Free PMC article. Review.
-
Recommendations for 18F-fluorodeoxyglucose positron emission tomography imaging for diagnosis of cardiac sarcoidosis-2018 update: Japanese Society of Nuclear Cardiology recommendations.J Nucl Cardiol. 2019 Aug;26(4):1414-1433. doi: 10.1007/s12350-019-01755-3. J Nucl Cardiol. 2019. PMID: 31197741 Review. No abstract available.
References
-
- Bateman TM, Dilsizian V, Beanlands RS, DePuey EG, Heller GV, Wolinsky DA. American Society of Nuclear Cardiology and Society of Nuclear Medicine and Molecular Imaging Joint Position Statement on the Clinical Indications for Myocardial Perfusion PET. J Nucl Med. 2016;57:1654–1656. - PubMed
-
- Masuda A, Takeishi Y. Choosing the appropriate examination for diagnosis of stable ischemic heart disease. Ann Nucl Cardiol. 2016;2:167–173.
-
- Schindler T, Marashdeh W, Solnes L. Application of myocardial blood flow quantification in CAD patients. Ann Nucl Cardiol. 2016;2:84–93.
-
- Rauch B, Helus F, Grunze M, Braunwell E, Mall G, Hasselbach W, Kubler W. Kinetics of 13N-ammonia uptake in myocardial single cells indicating potential limitations in its applicability as a marker of myocardial blood flow. Circulation. 1985;71:387–393. - PubMed
MeSH terms
Substances
LinkOut - more resources
Full Text Sources
Other Literature Sources

