

Liver fibrosis detection and staging: a comparative study of T1ρ MR imaging and 2D real-time shear-wave elastography
- PMID: 29198003
- PMCID: PMC6061497
- DOI: 10.1007/s00261-017-1381-3
Liver fibrosis detection and staging: a comparative study of T1ρ MR imaging and 2D real-time shear-wave elastography
Abstract
Purpose: To compare the results of T1ρ MR imaging and 2D real-time shear-wave elastography (SWE) for liver fibrosis detection and staging.
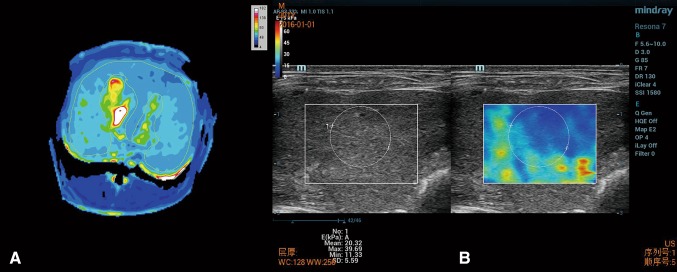
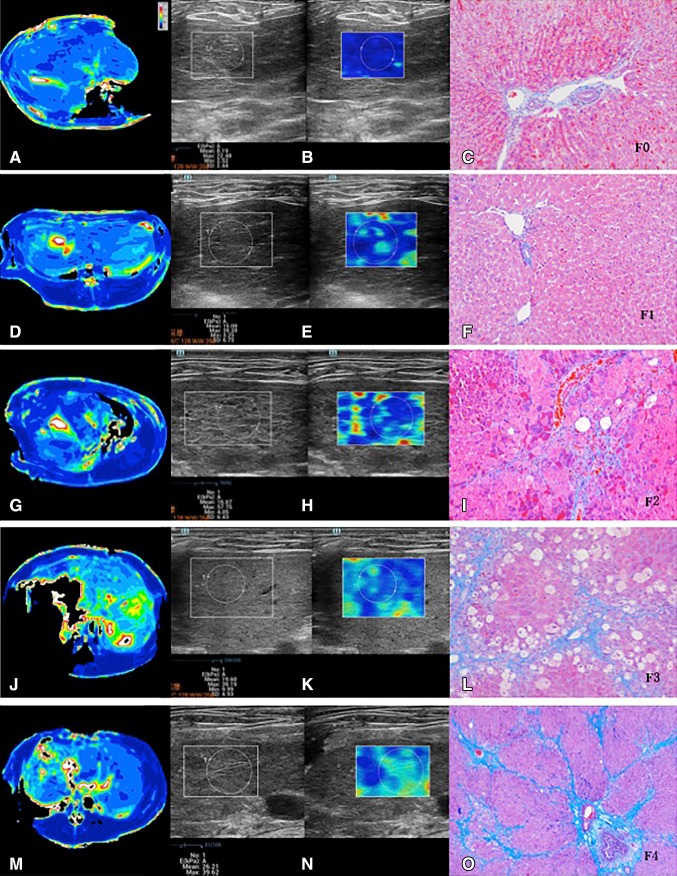
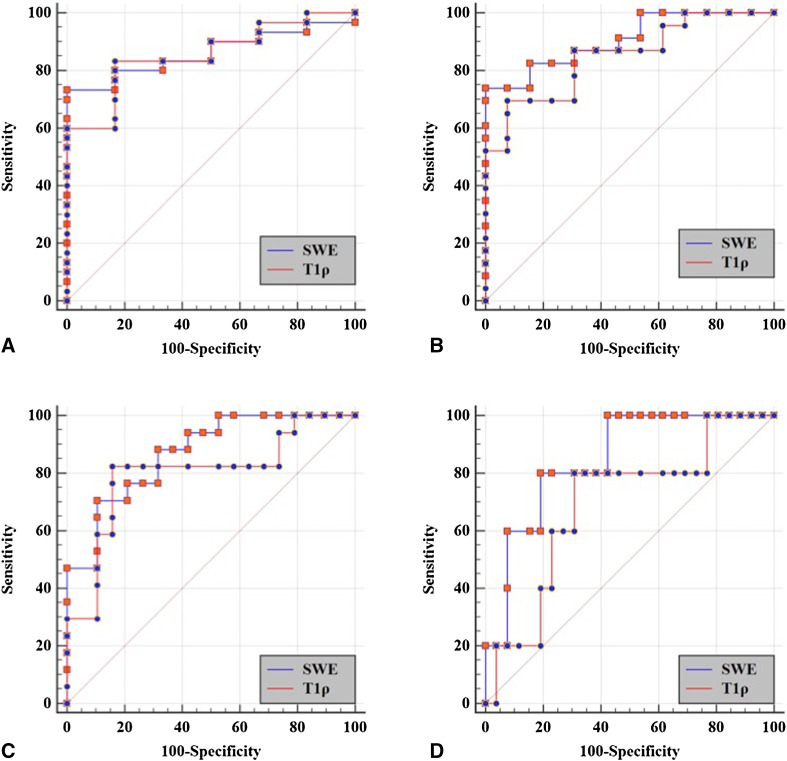
Methods: Twenty-nine rabbit models of CCl4-induced liver fibrosis were established and six untreated rabbits served as controls. T1ρ MR imaging and 2D real-time SWE examination were performed at 2, 4, 6, 8, 10, and 12 weeks. T1ρ values and liver stiffness (LS) values were measured. Fibrosis was staged according to the METAVIR scoring system. Correlation test was performed among T1ρ values, LS values, and fibrosis stage. Receiver operating characteristic (ROC) analysis was performed for assessing diagnostic performance of T1ρ and SWE in detection of no fibrosis (F0), substantial fibrosis (≥ F2), severe fibrosis (≥ F3), and cirrhosis (F4).
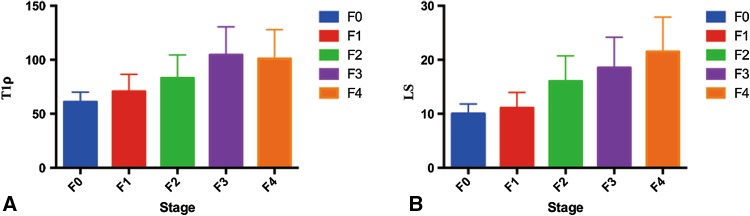
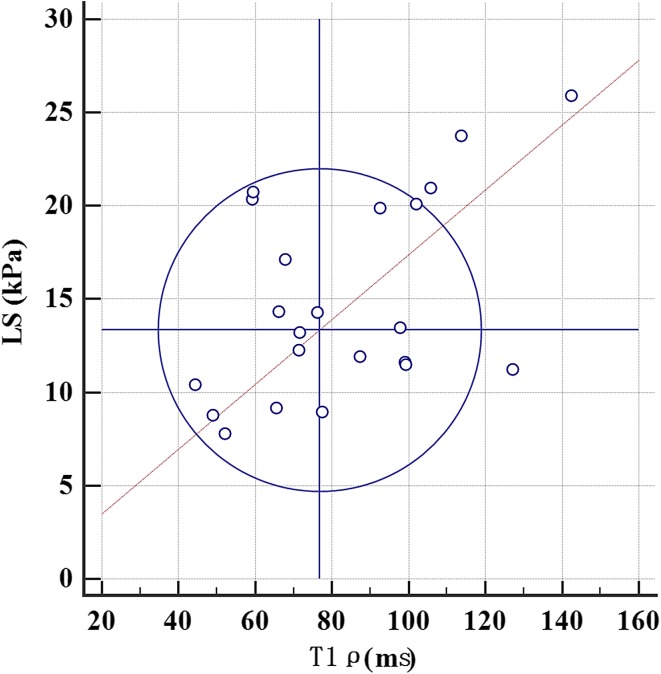
Results: There was moderate positive correlation between fibrosis stage and T1ρ values (r = 0.566; 95% CI 0.291-0.754; P < 0.0001), and LS value (r = 0.726; 95% CI 0.521-0.851; P = 0.003). T1ρ values showed moderate positive correlations with LS values [r = 0.693; 95% confidence interval (CI) 0.472-0.832; P < 0.0001]. Areas Under ROC (AUROCs) were 0.861 (95% CI 0.705-0.953) for SWE and 0.856 (95% CI 0.698-0.950) for T1ρ (P = 0.940), 0.906 (95% CI 0.762-0.978) for SWE and 0.849 (95% CI 0.691-0.946) for T1ρ (P = 0.414), 0.870 (95% CI 0.716-0.958) for SWE and 0.799 (95% CI 0.632-0.913) for T1ρ (P = 0.422), and 0.846 (95% CI 0.687-0.944) for SWE and 0.692 (95% CI 0.517-0.835) for T1ρ (P = 0.137), when diagnosing liver fibrosis with ≥ F1, ≥ F2, ≥ F3, and F4, respectively. There was moderate positive correlation between inflammatory activity and T1ρ values (r = 0.520; 95% CI 0.158-0.807; P = 0.013).
Conclusion: T1ρ imaging has potential for liver fibrosis detection and staging with good diagnostic capability similar to that of ultrasonography elastography.
Keywords: Liver fibrosis; Magnetic resonance imaging; T1ρ relaxation elastography; Ultrasonography.
Conflict of interest statement
Funding
This study was funded by the National Natural Science Foundation of China (Grant Number 81371520) and the National Natural Science Foundation for Young Scientists of China (Grant Number 81501433).
Conflict of interest
The authors declare that they have no conflict of interest.
Ethical approval
All applicable international, national, and/or institutional guidelines for the care and use of animals were followed.
Informed consent
Statement of informed consent was not applicable since the manuscript does not contain any patient data.
Figures
Similar articles
-
Hepatic fibrosis: prospective comparison of MR elastography and US shear-wave elastography for evaluation.Radiology. 2014 Dec;273(3):772-82. doi: 10.1148/radiol.14132000. Epub 2014 Jul 7. Radiology. 2014. PMID: 25007047
-
Accuracy of real-time shear wave elastography for assessing liver fibrosis in chronic hepatitis C: a pilot study.Hepatology. 2012 Dec;56(6):2125-33. doi: 10.1002/hep.25936. Epub 2012 Aug 31. Hepatology. 2012. PMID: 22767302
-
Staging liver fibrosis on multiparametric MRI in a rabbit model with elastography, susceptibility-weighted imaging and T1ρ imaging: a preliminary study.Acta Radiol. 2021 Feb;62(2):155-163. doi: 10.1177/0284185120917117. Epub 2020 Apr 23. Acta Radiol. 2021. PMID: 32326722
-
Assessment of biopsy-proven liver fibrosis by two-dimensional shear wave elastography: An individual patient data-based meta-analysis.Hepatology. 2018 Jan;67(1):260-272. doi: 10.1002/hep.29179. Epub 2017 Nov 15. Hepatology. 2018. PMID: 28370257 Free PMC article. Review.
-
Performance of two-dimensional shear wave elastography for detecting advanced liver fibrosis and cirrhosis in patients with biliary atresia: a systematic review and meta-analysis.Pediatr Radiol. 2023 Dec;53(13):2642-2650. doi: 10.1007/s00247-023-05796-2. Epub 2023 Nov 2. Pediatr Radiol. 2023. PMID: 37917168
Cited by
-
Consumption of Low Dose Fucoxanthin Does Not Prevent Hepatic and Adipose Inflammation and Fibrosis in Mouse Models of Diet-Induced Obesity.Nutrients. 2022 May 29;14(11):2280. doi: 10.3390/nu14112280. Nutrients. 2022. PMID: 35684079 Free PMC article.
-
Liver injury monitoring, fibrosis staging and inflammation grading using T1rho magnetic resonance imaging: an experimental study in rats with carbon tetrachloride intoxication.BMC Gastroenterol. 2020 Jan 15;20(1):14. doi: 10.1186/s12876-020-1161-3. BMC Gastroenterol. 2020. PMID: 31941457 Free PMC article.
-
Multiparametric quantitative magnetic resonance imaging of skeletal muscle in CKD.Am J Physiol Renal Physiol. 2025 Jul 1;329(1):F99-F111. doi: 10.1152/ajprenal.00254.2024. Epub 2025 May 27. Am J Physiol Renal Physiol. 2025. PMID: 40421837 Free PMC article.
-
Liver Fibrosis Conventional and Molecular Imaging Diagnosis Update.J Liver. 2019;8(1):236. Epub 2019 Jan 22. J Liver. 2019. PMID: 31341723 Free PMC article.
References
Publication types
MeSH terms
Grants and funding
LinkOut - more resources
Full Text Sources
Other Literature Sources
Medical
Miscellaneous
