. 2017;13(11):1804-1812.
doi: 10.1080/15548627.2017.1356949. Epub 2017 Dec 4.

Stress-response transcription factors Msn2 and Msn4 couple TORC2-Ypk1 signaling and mitochondrial respiration to ATG8 gene expression and autophagy

Affiliations

Stress-response transcription factors Msn2 and Msn4 couple TORC2-Ypk1 signaling and mitochondrial respiration to ATG8 gene expression and autophagy

Ariadne Vlahakis et al. Autophagy. 2017.

Abstract

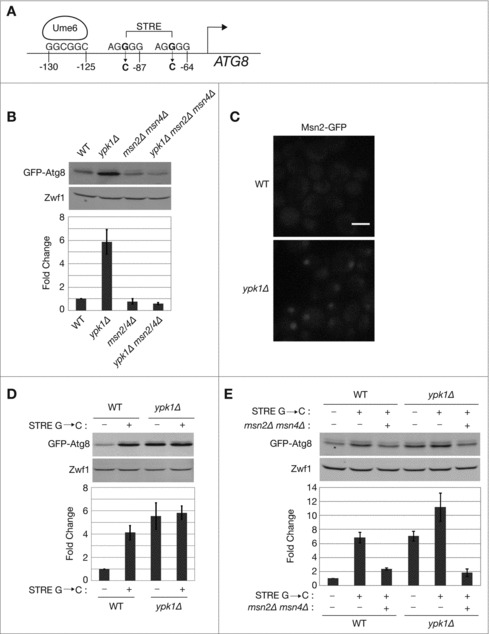
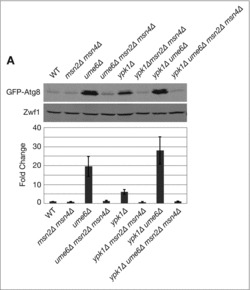
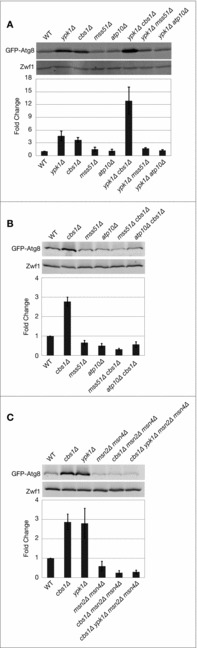
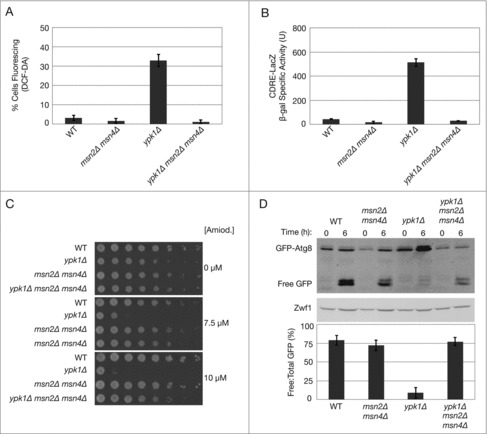
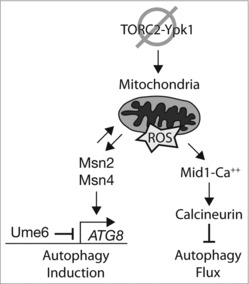
Macroautophagy/autophagy is a starvation and stress-induced catabolic process critical for cellular homeostasis and adaptation. Several Atg proteins are involved in the formation of the autophagosome and subsequent degradation of cytoplasmic components, a process termed autophagy flux. Additionally, the expression of several Atg proteins, in particular Atg8, is modulated transcriptionally, yet the regulatory mechanisms involved remain poorly understood. Here we demonstrate that the AGC kinase Ypk1, target of the rapamycin-insensitive TORC2 signaling pathway, controls ATG8 expression by repressing the heterodimeric Zinc-finger transcription factors Msn2 and Msn4. We find that Msn2 and Msn4 promote ATG8 expression downstream of the histone deacetylase complex (HDAC) subunit Ume6, a previously identified negative regulator of ATG8 expression. Moreover, we demonstrate that TORC2-Ypk1 signaling is functionally linked to distinct mitochondrial respiratory complexes. Surprisingly, we find that autophagy flux during amino acid starvation is also dependent upon Msn2-Msn4 activity, revealing a broad role for these transcription factors in the autophagy response.

Keywords: TOR signaling; Ypk1; autophagy; electron transport chain (ETC) complexes; gene expression; mitochondrial respiration; signal transduction.


Figures

Figure 1.
Figure 1.
TORC2-Ypk1 signaling regulates ATG8 expression via the heterodimeric zinc-finger transcription factor Msn2-Msn4. (A) Schematic representation of the ATG8 promoter region, indicating the identified recognition site for the HDAC subunit Ume6 as well as potential stress response elements (STRE) as determined by YEASTRACT. Also indicated are positions of G to C mutations introduced into the STRE sites. (B) Indicated strains carrying pRS416 prATG8-GFP-ATG8 were grown to log phase in SCD medium without uracil. GFP-Atg8 protein was visualized via western blot analysis as described in Materials and Methods. GFP-Atg8 protein expression was normalized to the Zwf1 loading control and quantification represents Atg8 protein levels relative to WT, presented as the mean ± standard deviation (SD) of at least 3 independent experiments. (C) Indicated strains expressing endogenously tagged MSN2-GFP were visualized by fluorescence microscopy as described in Materials and Methods. Scale bar: 5 μm. ((D)and E) Indicated strains carrying pRS416 prATG8-GFP-ATG8 or pRS416 prATG8-GFP-ATG8 possessing STRE mutations depicted in (A) were grown to log phase in SCD medium without uracil. GFP-Atg8 protein levels were detected by western blot and analyzed as described in (B).
Figure 2.
Figure 2.
Msn2-Msn4 link the HDAC subunit Ume6 to ATG8 transcription. Indicated strains expressing pRS416 prATG8-GFP-ATG8 were grown to log phase in SCD medium without uracil and western blot analysis was performed as described in Materials and Methods. GFP-Atg8 protein expression was normalized to the Zwf1 loading control and quantification represents Atg8 protein levels relative to WT, presented as the mean ± SD of at least 3 independent experiments.
Figure 3.
Figure 3.
Specific mitochondrial respiratory complexes link TORC2-Ypk1 and Msn2-Msn4 to ATG8 expression. (A-C) Indicated strains expressing pRS416 prATG8-GFP-ATG8 were grown to log phase in SCD medium without uracil. Western blot analysis was performed as described in Materials and Methods. GFP-Atg8 protein expression was normalized to Zwf1 loading control and quantification represents Atg8 protein levels relative to WT, presented as the mean ± SD of at least 3 independent experiments.
Figure 4.
Figure 4.
Msn2-Msn4 function upstream of mitochondria to regulate ROS and autophagy flux. (A) Indicated strains were grown to log phase and treated with 10 μM DCF for 30 min at 30°C before imaging by fluorescence microscopy, as described in Materials and Methods. Quantification represents the percentage of DCF-positive fluorescing cells, where a minimum of 250 cells for each strain was counted. (B) Indicated strains carrying plasmid pAMS363 that expresses 2xCDRE:LacZ were grown to log phase in SCD medium without uracil, and β-galactosidase activity was measured as described in Materials and Methods. β-galactosidase activity is represented as units of ONPG (nmol) converted/min/mg of protein. Data are presented as means ± SD of 3 independent experiments. (C) Indicated strains were grown to log phase and serial dilutions were plated onto agar plates containing YPD and the indicated concentrations of amiodarone. Cells were grown for ∼2–3 d at 30°C. (D) Indicated strains carrying pRS416 prATG8-GFP-ATG8 were grown to log phase in SCD medium without uracil medium and transferred to amino acid starvation medium (0.05% yeast extract, 2% dextrose) for 6 h. GFP and GFP-Atg8 protein levels were visualized by western blot analysis as described in Materials and Methods. Quantification of autophagy flux at 6 h of starvation is represented as a percentage of the ratio of free GFP to total GFP (GFP + GFP-Atg8) signal. Data are presented as means ± SD of 3 independent experiments.
Figure 5.
Figure 5.
Model for regulation of ATG8 expression and autophagy flux by TORC2-Ypk1, mitochondrial respiration, and Msn2-Msn4 during amino acid starvation. Model depicts the consequences of decreased TORC2-Ypk1 signaling and impaired mitochondrial function with respect to Msn2-Msn4 activity during both autophagy induction as well as autophagy flux. See text for details.

References

    1. He C, Klionsky DJ. Regulation mechanisms and signaling pathways of autophagy. Annu Rev Genet. 2009;43:67 93. doi:10.1146/annurev-genet-102808-114910. PMID:19653858 - DOI - PMC - PubMed
    1. Xie Z, Klionsky DJ. Autophagosome formation: core machinery and adaptations. Nat Cell Biol. 2007;9:1102 9. doi:10.1038/ncb1007-1102. PMID:17909521 - DOI - PubMed
    1. Wang CW, Klionsky DJ. The molecular mechanism of autophagy. Mol Med. 2003;9:65 76. PMID:12865942 - PMC - PubMed
    1. Abeliovich H, Dunn WA Jr., Kim J, Klionsky DJ. Dissection of autophagosome biogenesis into distinct nucleation and expansion steps. J Cell Biol. 2000;151:1025 34. doi:10.1083/jcb.151.5.1025. PMID:11086004 - DOI - PMC - PubMed
    1. Ecker N, Mor A, Journo D, Abeliovich H. Induction of autophagic flux by amino acid deprivation is distinct from nitrogen starvation-induced macroautophagy. Autophagy. 2010;6:879 90. doi:10.4161/auto.6.7.12753. PMID:20647741 - DOI - PubMed

Publication types

MeSH terms