. 2017 Dec 14;171(7):1611-1624.e24.
doi: 10.1016/j.cell.2017.10.044. Epub 2017 Nov 30.

Single-Cell Transcriptomic Analysis of Primary and Metastatic Tumor Ecosystems in Head and Neck Cancer

Affiliations

Single-Cell Transcriptomic Analysis of Primary and Metastatic Tumor Ecosystems in Head and Neck Cancer

Sidharth V Puram et al. Cell. .

Abstract

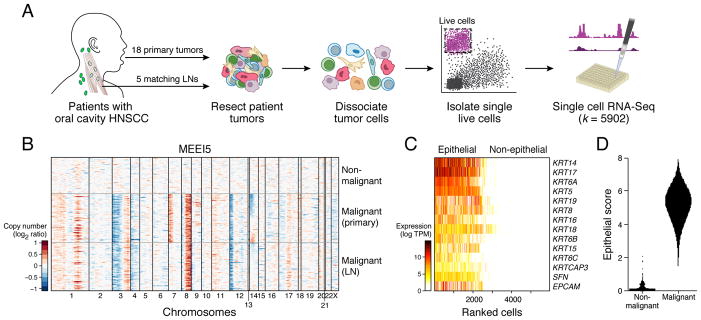
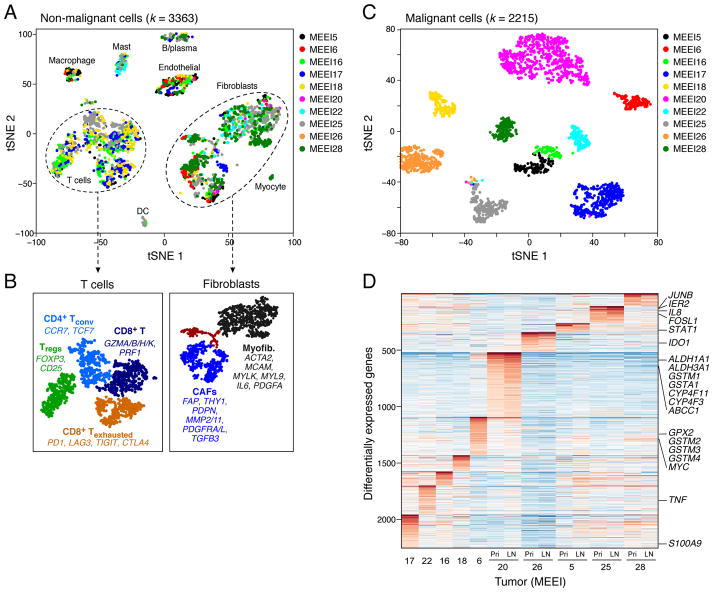
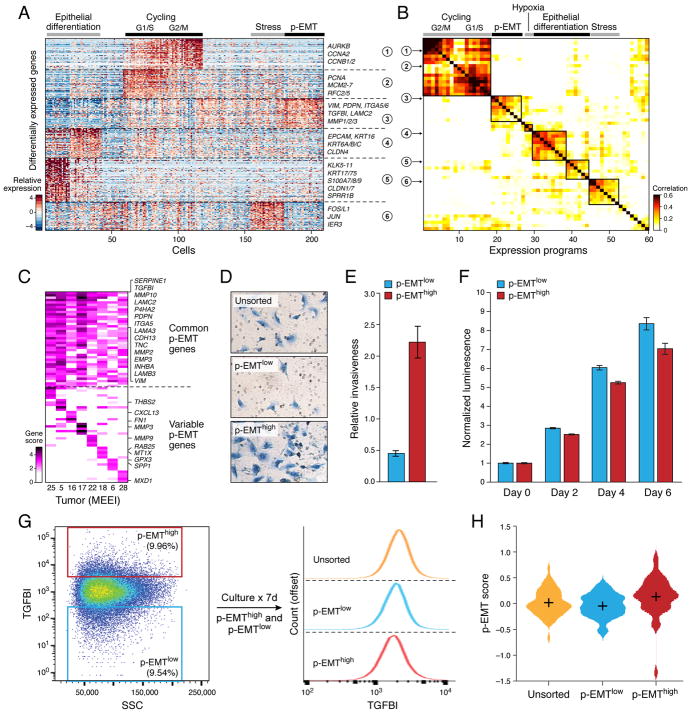
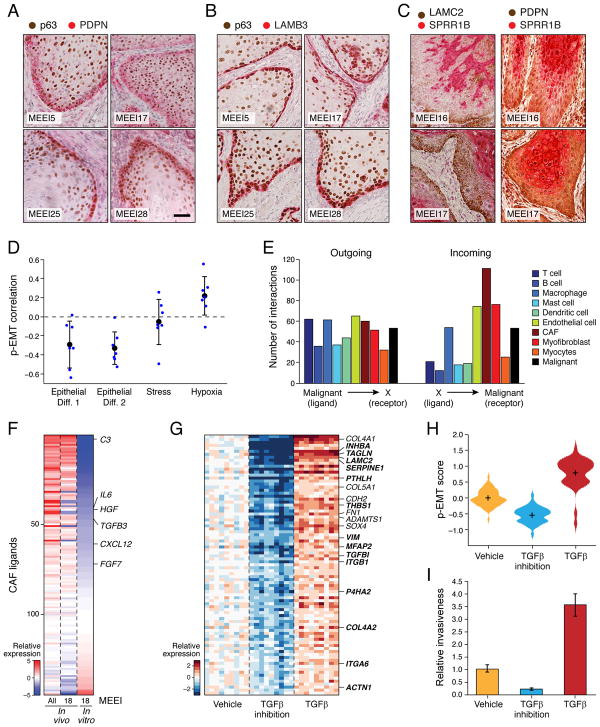
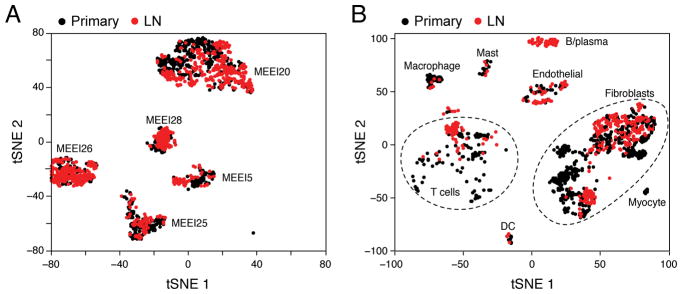
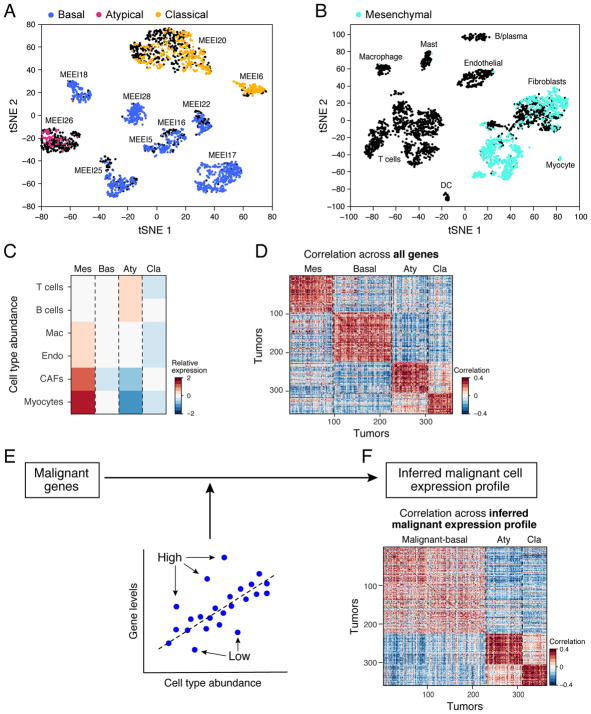
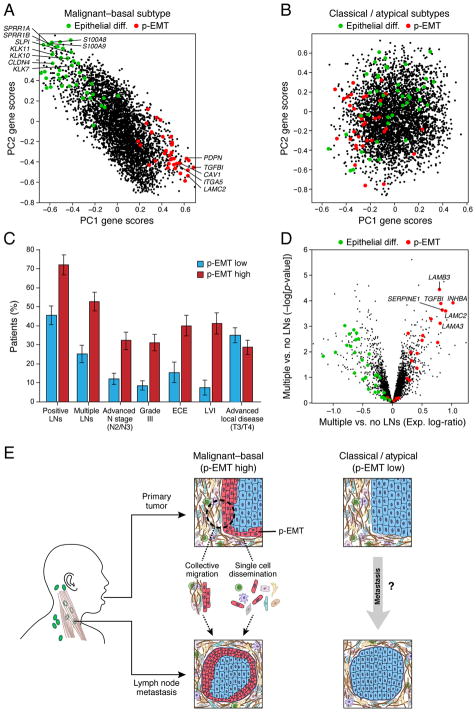
The diverse malignant, stromal, and immune cells in tumors affect growth, metastasis, and response to therapy. We profiled transcriptomes of ∼6,000 single cells from 18 head and neck squamous cell carcinoma (HNSCC) patients, including five matched pairs of primary tumors and lymph node metastases. Stromal and immune cells had consistent expression programs across patients. Conversely, malignant cells varied within and between tumors in their expression of signatures related to cell cycle, stress, hypoxia, epithelial differentiation, and partial epithelial-to-mesenchymal transition (p-EMT). Cells expressing the p-EMT program spatially localized to the leading edge of primary tumors. By integrating single-cell transcriptomes with bulk expression profiles for hundreds of tumors, we refined HNSCC subtypes by their malignant and stromal composition and established p-EMT as an independent predictor of nodal metastasis, grade, and adverse pathologic features. Our results provide insight into the HNSCC ecosystem and define stromal interactions and a p-EMT program associated with metastasis.

Keywords: epithelial-to-mesenchymal transition; head and neck squamous cell carcinoma; intra-tumoral heterogeneity; metastasis; scRNA-seq; single-cell RNA sequencing; tumor microenvironment.


Figures

Figure 1
Figure 1. Characterizing intra-tumoral expression heterogeneity in HNSCC by single-cell RNA-seq
(A) Workflow shows collection and processing of fresh biopsy samples of primary oral cavity HNSCC tumors and matched metastatic LNs for scRNA-seq. (B) Heat map shows large-scale CNVs for individual cells (rows) from a representative tumor (MEEI5), inferred based on the average expression of 100 genes surrounding each chromosomal position (columns). Red: amplifications; Blue: deletions. (C) Heatmap shows expression of epithelial marker genes across 5,902 single cells (columns), sorted by the average expression of these genes. (D) Violin plot shows distributions of epithelial scores (average expression of epithelial marker genes) for cells categorized as malignant or non-malignant based on CNVs. See Figure S1; Tables S1–S4.
Figure 2
Figure 2. Expression heterogeneity of malignant and non-malignant cells in the HNSCC ecosystem
(A) t-distributed stochastic neighbor embedding (t-SNE) plot of non-malignant cells from 10 patients reveals consistent clusters of stromal and immune cells across tumors. Clusters are assigned to indicated cell types by differentially expressed genes (see also Figure S1F). (B) (Left) Zoomed in t-SNE plot of T-cells with distinct naïve-like, regulatory, cytotoxic, and exhausted populations as identified by DBscan clustering. (Right) Zoomed in t-SNE plot of fibroblasts with myofibroblasts, non-activated resting fibroblasts, and activated CAFs, which can be seen to further divide into two sub-clusters. Differentially expressed genes are listed for key subsets. (C) t-SNE plot of malignant cells from 10 patients (indicated by colors) reveals tumor-specific clusters. Clustering patterns for malignant and non-malignant cells are not driven by transcriptome complexity (see Figure S2H). (D) Heatmap shows genes (rows) that are differentially expressed across 10 individual primary tumors (columns). For five tumors, expression is also shown for matched LNs. Red: high expression; Blue: low expression. Selected genes are highlighted. Two classical subtype tumors (MEEI6 and MEEI20; see also Figure 6A) preferentially expressed genes associated with detoxification and drug metabolism (e.g. GPX2, GSTMs, CYPs, ABCC1). See Figures S1 and S2; Table S5.
Figure 3
Figure 3. Unbiased clustering reveals a common program of partial EMT (p-EMT) in HNSCC tumors
(A) Heatmap shows differentially-expressed genes (rows) identified by non-negative matrix factorization (NNMF) clustered by their expression across single cells (columns) from a representative tumor (MEEI25). The gene clusters reveal intra-tumoral programs that are differentially expressed in MEEI25. The corresponding gene signatures are numbered and selected genes indicated (right). (B) Heatmap depicts pairwise correlations of 60 intra-tumoral programs derived from 10 tumors, as in (A). Clustering identifies seven coherent expression programs across tumors. Rows in the heatmap that correspond to programs derived from MEEI25 are indicated by arrows and numbered as in (A). (C) Heatmap shows NNMF gene scores (rows) for common (top) and tumor-specific (bottom) genes within the p-EMT program by tumor (columns). (D) Representative images of SCC9 HNSCC cells sorted by p-EMT marker TGFBI into p-EMThigh and p-EMTlow populations and analyzed by matrigel invasion assay. (E) Bar plot depicts relative invasiveness of p-EMThigh and p-EMTlow SCC9 cells sorted and analyzed as in (D) (representative experiment; error bars reflect SEM; ANOVA, p<0.005, n=3). (F) Bar plot depicts relative proliferation of p-EMThigh and p-EMTlow SCC9 cells sorted as in (D) (representative experiment; error bars reflect SEM; ANOVA, p<0.0001, n=4). (G) (Left) Fluorescence-activated cell sorting plot identifies p-EMThigh and p-EMTlow SCC9 cells isolated based on TGFBI expression. (Right) Histogram (offset) reveals the distribution (x-axis) of TGFBI expression across cells from the respective isolates (p-EMThigh, p-EMTlow, and unsorted; separated by dashed lines). After 7 days in culture, p-EMThigh, p-EMTlow, and unsorted cells have similar distributions of p-EMT marker expression. Additional experiments with the p-EMT marker CXADR demonstrate similar findings (data not shown). (H) Violin plot depicts p-EMT scores for unsorted, p-EMTlow, and p-EMThigh SCC9 cell sorted and cultured as in (G). Respective isolates largely recapitulate the initial distribution of p-EMT scores. See Figures S3 and S4; Tables S6 and S7.
Figure 4
Figure 4. p-EMT cells at the leading edge engage in cross-talk with CAFs
(A–C) IHC images of representative HNSCC tumors (MEEI5, MEEI16, MEEI17, MEEI25, MEEI28) stained for p-EMT markers (PDPN, LAMB3, LAMC2) and the malignant cell-specific marker p63 (A and B) or the epithelial program marker SPRR1B (C). Scale bar = 100 μM. (D) Scatter plot shows the Pearson correlation between the p-EMT program and other expression programs underlying HNSCC intra-tumoral heterogeneity (Figure 3). Blue circles depict the correlations within individual tumors; black circles and error-bars represent the average and standard error, respectively, across the different tumors. (E) Bar plot depicts numbers of putative receptor-ligand interactions between malignant HNSCC cells and indicated cell types. Interaction numbers were calculated based on expression of receptors and corresponding ligands in scRNA-seq data. Outgoing interactions refer to the sum of ligands from malignant cells that interact with receptors on the indicated cell type. Incoming interactions refer to the opposite. CAFs express a significantly greater number of ligands whose receptors are expressed by malignant cells (hypergeometric test, p<0.05). (F) Heatmap depicts expression of ligands expressed by in vivo and in vitro CAFs. Relative expression is shown for all in vivo CAFs, MEEI18 in vivo CAFs, and in vitro CAFs derived from MEEI18. (G) Heatmap depicts relative expression of genes that were differentially regulated when SCC9 cells were treated with TGFβ3 or TGFβ pathway inhibitors. Panel includes all genes with significantly higher expression upon TGFβ3 treatment and lower expression upon TGFβ inhibition, relative to vehicle (t-test, p<0.05). Heat intensity reflects relative expression of indicated genes in bulk RNA-seq profiles for nine samples in each group, corresponding to distinct dosage or time points (see STAR Methods). Selected genes are labeled and overlap with the in vivo p-EMT program (bold). (H) Violin plot depicts distributions of the p-EMT gene expression score across SCC9 cells treated as in (G) and profiled by scRNA-seq. p-EMT scores were increased with TGFβ3 treatment and decreased upon TGFβ inhibition, relative to vehicle (t-test, p<10−16) (I) Bar plot shows relative invasiveness of SCC9 cells treated as in (G) (representative experiment; error bars reflect SEM; ANOVA, p<0.0001, n=3). In vitro treatment of HNSCC cells with the CAF-related ligand TGFβ causes coherent induction of the p-EMT program and increases invasiveness, while TGFβ inhibition has the opposite effect. See Figure S5.
Figure 5
Figure 5. Intra-tumoral HNSCC heterogeneity recapitulated in nodal metastases
(A) t-SNE plot of malignant cells (as in Figure 2) from five primary tumors (black) and their matched LNs (red). Malignant cells cluster by tumor rather than by site. (B) t-SNE plot of non-malignant cells (as in Figure 2) from five primary tumors (black) and their matched LNs (red). Non-malignant cells are consistent across tumors but their representation and expression states vary between sites. See Figure S6.
Figure 6
Figure 6. HNSCC subtypes revised by deconvolution of expression profiles from hundreds of tumors
(A) t-SNE plot of malignant cells from ten tumors (as in Figure 2). Each cluster of cells corresponds to a different tumor. Cells are colored according to the TCGA expression subtype that they match. Black indicates no match. Each tumor can be clearly assigned to one of three subtypes: basal, atypical, or classical. (B) t-SNE plot of non-malignant cells (as in Figure 2) from ten tumors. Each cluster of cells corresponds to a different cell type. Cells are colored according to the TCGA expression subtype that they match. Black indicates no match. Fibroblasts and myocytes highly express signature genes of the mesenchymal subtype, which likely reflects tumor profiles with high stromal representation. (C) For each TCGA subtype (columns), heatmap shows relative expression of gene signatures for non-malignant cell types (rows), which were used as estimates of cell type abundances. Tumors classified as mesenchymal highly expressed genes specific to CAFs and myocytes, while atypical tumors were enriched for T- and B-cells. (D) Heatmap depicts pairwise correlations between TCGA expression profiles ordered by their subtype annotations. This analysis included all genes and recovered all four subtypes. (E) Schematic of linear regression used to subtract the influence of non-malignant cell frequency from bulk TCGA expression profiles, and thereby infer malignant cell-specific expression profiles. (F) Heatmap depicts pairwise correlations between TCGA expression profiles ordered by their subtype annotations. This analysis was based on the inferred malignant cell-specific expression profiles in (E). Classical and atypical subtypes are maintained. However, basal and mesenchymal subtypes collapse to a single subtype, which we term ‘malignant-basal.’ See Figure S7.
Figure 7
Figure 7. p-EMT predicts nodal metastasis and adverse pathologic features
(A) PC1 and PC2 gene scores based on PCA of inferred malignant cell-specific profiles from all malignant-basal TCGA tumors (n=225). p-EMT genes (red) and epithelial differentiation genes (green) underlie variance among malignant-basal tumors. (B) PC1 and PC2 gene scores based on PCA of inferred malignant cell-specific profiles from all classical and atypical TCGA tumors (n=156). p-EMT (red) and epithelial differentiation (green) genes are weakly associated with variance in these tumors. (C) Plot depicts percentage of p-EMT high and p-EMT low malignant-basal tumors associated with each clinical feature. Higher p-EMT scores were associated with positive LNs, advanced nodal stage, high grade, extracapsular extension (ECE), and lymphovascular invasion (LVI) (hypergeometric test, p<0.05). Advanced local disease (T3/T4) as determined by T-stage did not correlate with p-EMT score. (D) Volcano plot depicts gene expression differences between malignant-basal TCGA tumors with multiple LNs versus those without positive LNs. p-EMT genes (red) have increased expression, while epithelial differentiation genes (green) have decreased expression in metastatic tumors. (E) Model of the in vivo p-EMT program associated with invasion and metastasis in malignant-basal HNSCC tumors. See Figure S7.

Comment in

References

    1. Agrawal N, Frederick MJ, Pickering CR, Bettegowda C, Chang K, Li RJ, Fakhry C, Xie TX, Zhang J, Wang J, et al. Exome sequencing of head and neck squamous cell carcinoma reveals inactivating mutations in NOTCH1. Science. 2011;333:1154–1157. - PMC - PubMed
    1. Bacher R, Chu LF, Leng N, Gasch AP, Thomson JA, Stewart RM, Newton M, Kendziorski C. SCnorm: robust normalization of single-cell RNA-seq data. Nat Methods. 2017;14:584–586. - PMC - PubMed
    1. Cancer Genome Atlas N. Comprehensive genomic characterization of head and neck squamous cell carcinomas. Nature. 2015;517:576–582. - PMC - PubMed
    1. Cancer Genome Atlas Research N. Integrated genomic analyses of ovarian carcinoma. Nature. 2011;474:609–615. - PMC - PubMed
    1. Cibulskis K, Lawrence MS, Carter SL, Sivachenko A, Jaffe D, Sougnez C, Gabriel S, Meyerson M, Lander ES, Getz G. Sensitive detection of somatic point mutations in impure and heterogeneous cancer samples. Nat Biotechnol. 2013;31:213–219. - PMC - PubMed