. 2017 Dec 14;171(7):1625-1637.e13.
doi: 10.1016/j.cell.2017.10.040. Epub 2017 Nov 30.

A J-Protein Co-chaperone Recruits BiP to Monomerize IRE1 and Repress the Unfolded Protein Response

Affiliations

A J-Protein Co-chaperone Recruits BiP to Monomerize IRE1 and Repress the Unfolded Protein Response

Niko Amin-Wetzel et al. Cell. .

Abstract

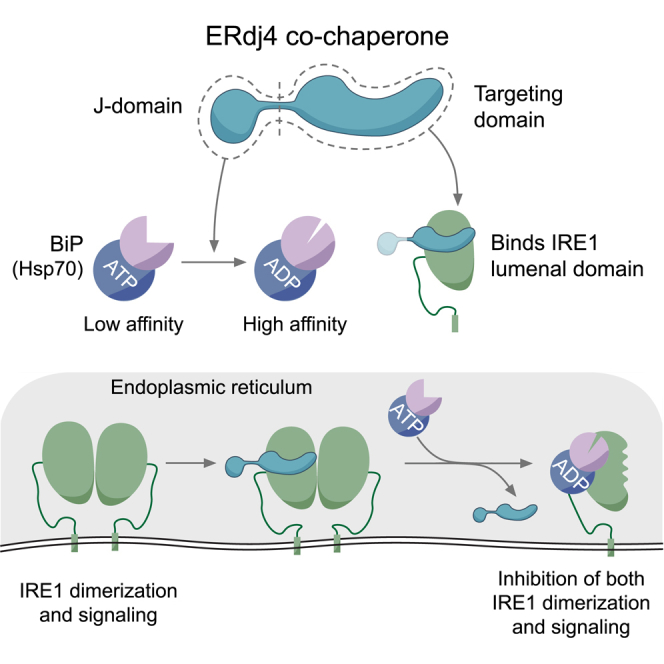
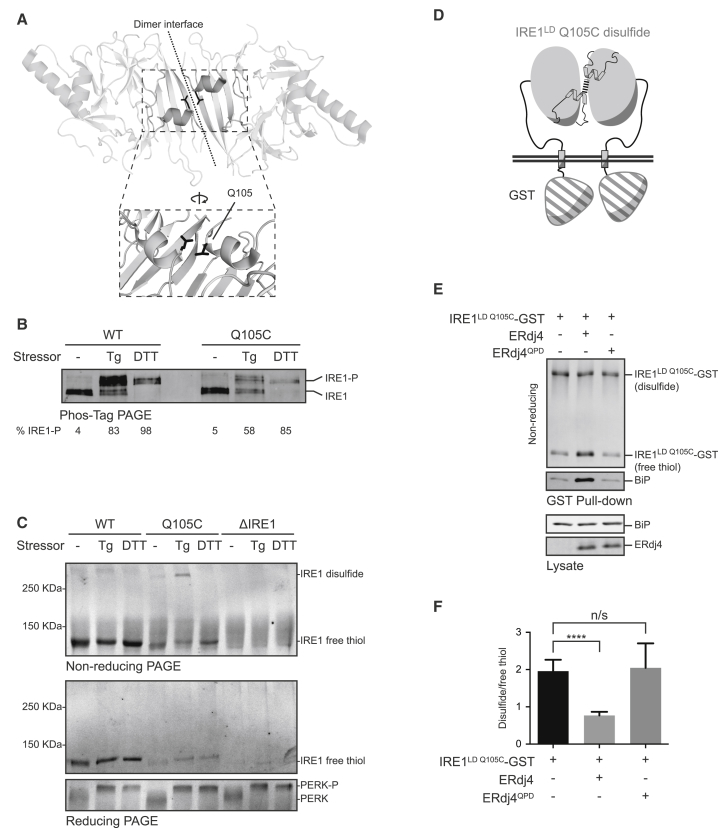
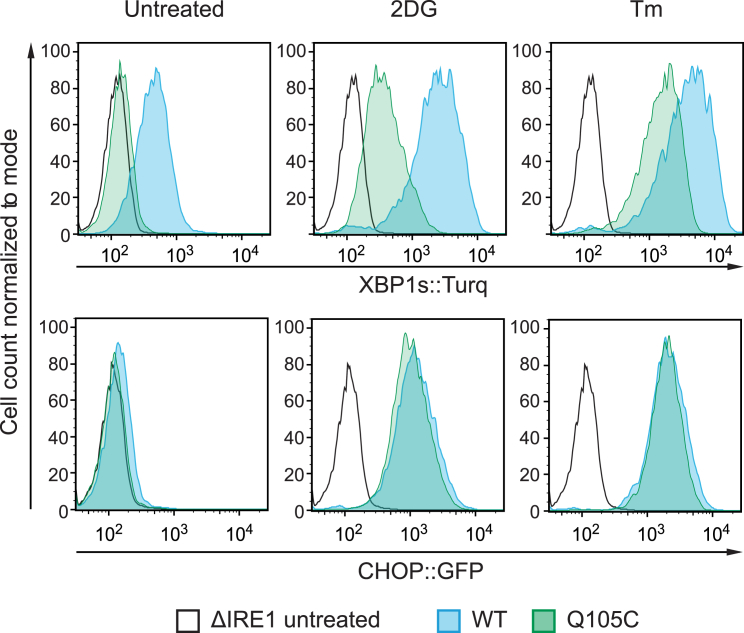
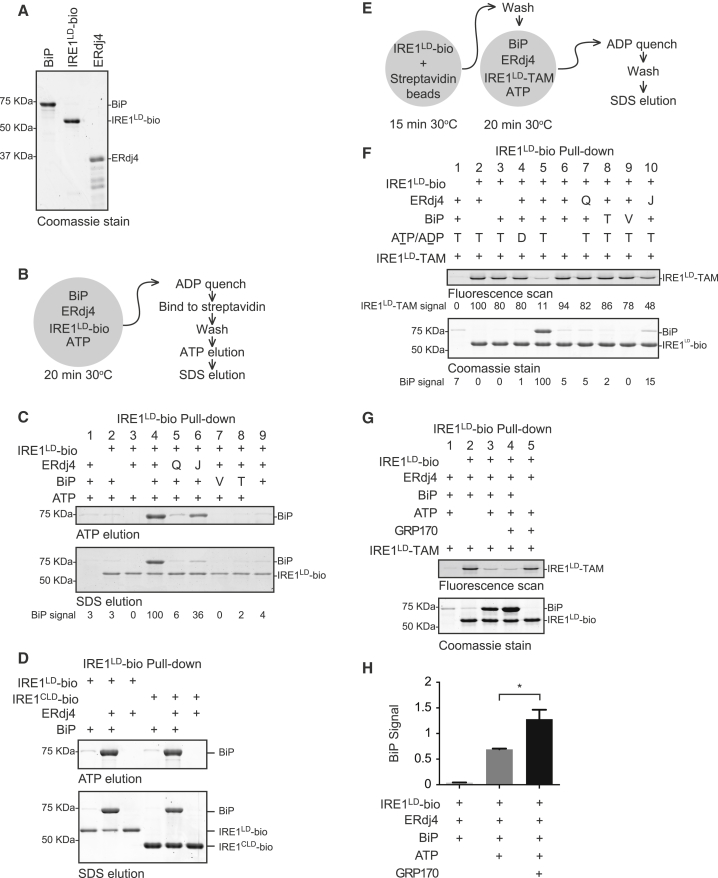
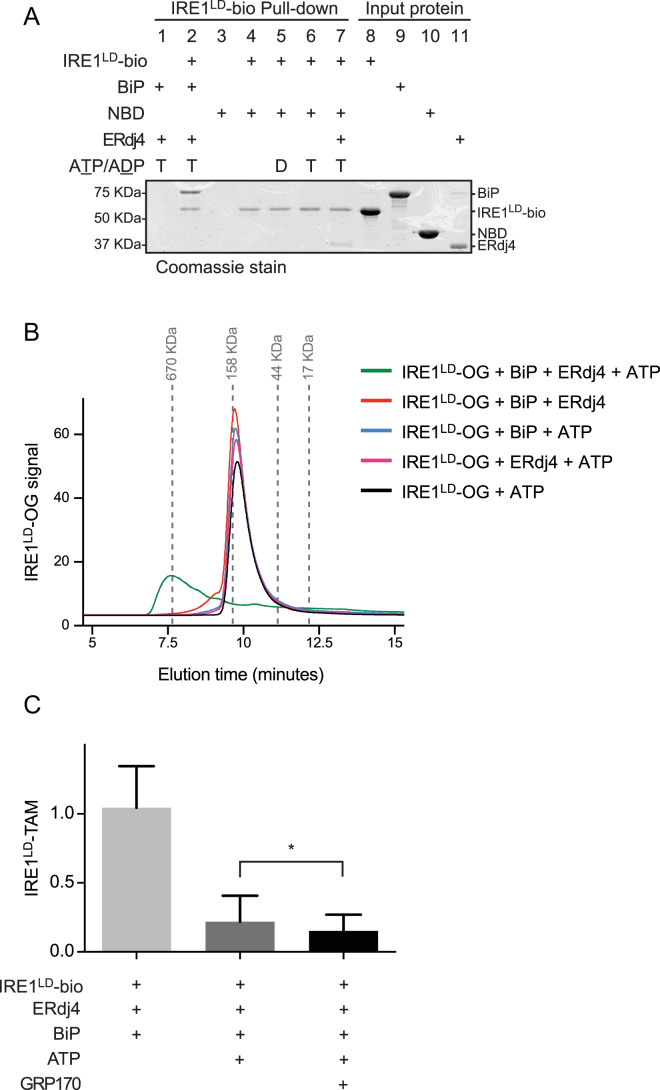
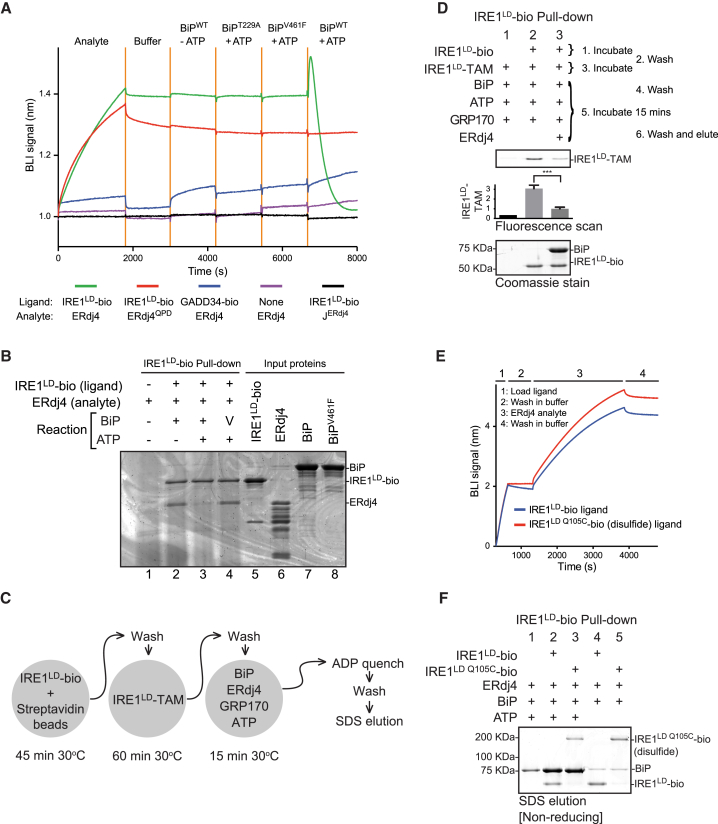
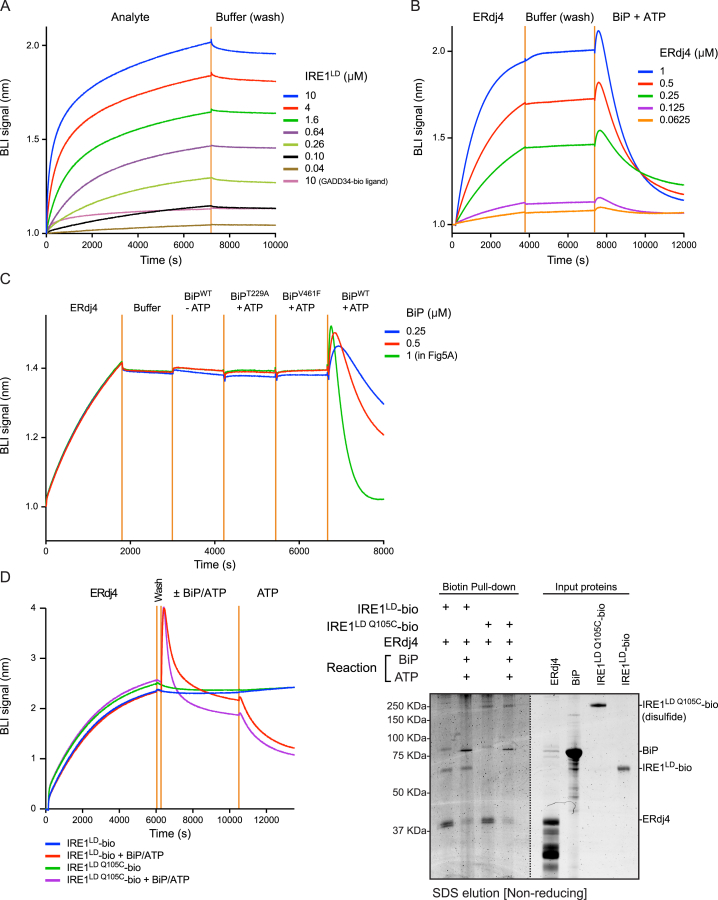
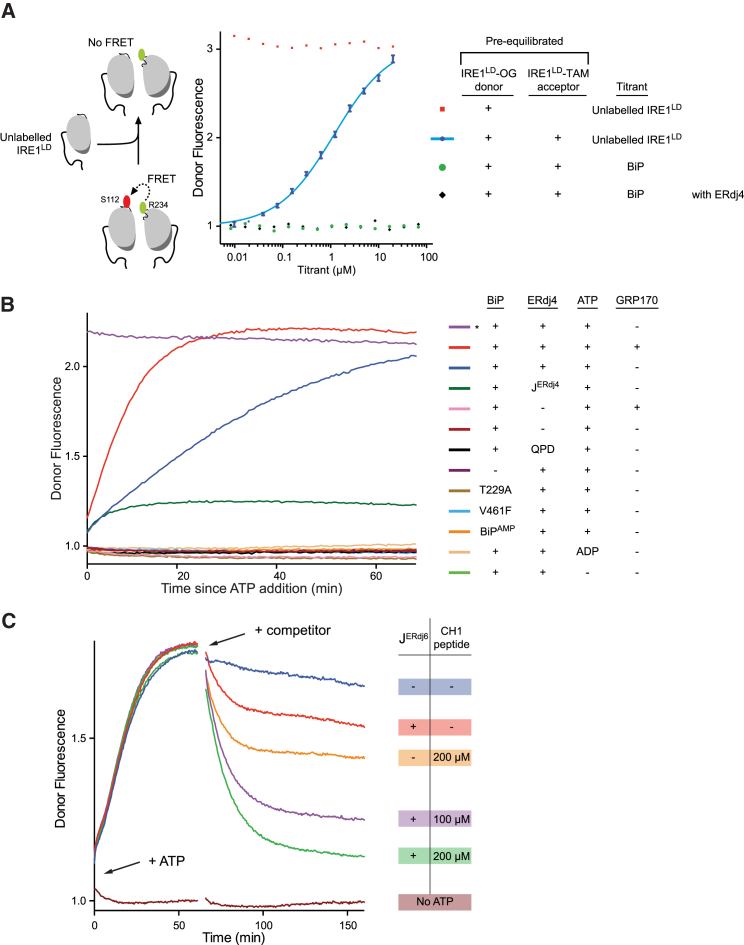
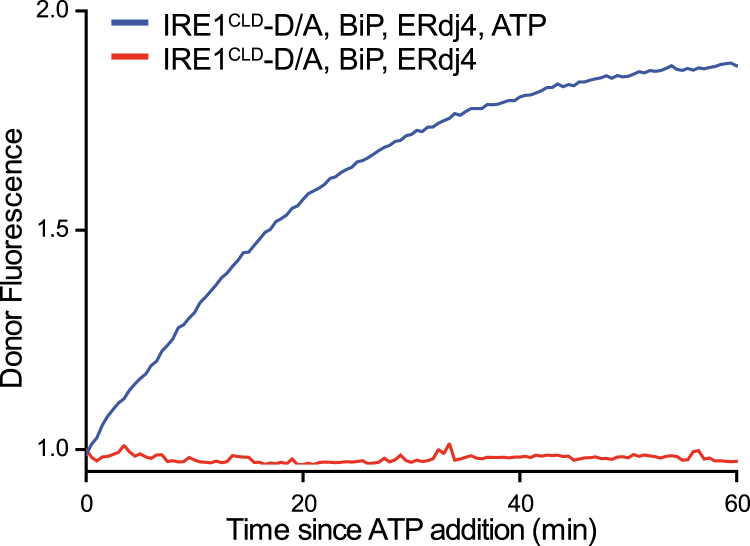
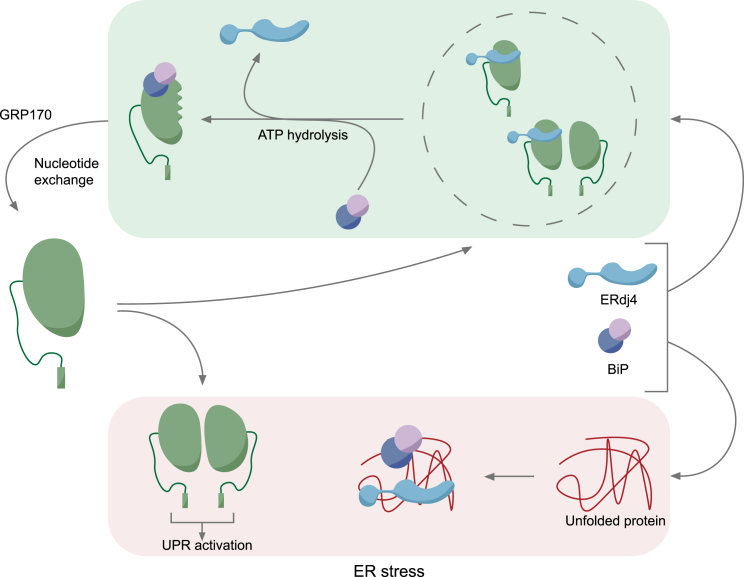
When unfolded proteins accumulate in the endoplasmic reticulum (ER), the unfolded protein response (UPR) increases ER-protein-folding capacity to restore protein-folding homeostasis. Unfolded proteins activate UPR signaling across the ER membrane to the nucleus by promoting oligomerization of IRE1, a conserved transmembrane ER stress receptor. However, the coupling of ER stress to IRE1 oligomerization and activation has remained obscure. Here, we report that the ER luminal co-chaperone ERdj4/DNAJB9 is a selective IRE1 repressor that promotes a complex between the luminal Hsp70 BiP and the luminal stress-sensing domain of IRE1α (IRE1LD). In vitro, ERdj4 is required for complex formation between BiP and IRE1LD. ERdj4 associates with IRE1LD and recruits BiP through the stimulation of ATP hydrolysis, forcibly disrupting IRE1 dimers. Unfolded proteins compete for BiP and restore IRE1LD to its default, dimeric, and active state. These observations establish BiP and its J domain co-chaperones as key regulators of the UPR.

Keywords: Allosteric Regulation; Biological Feedback; Endoplasmic Reticulum; Fluorescence Resonance Energy Transfer; HSP70 Heat-Shock Proteins; Protein Dimerization; Protein Folding; Repressor Protein; Stress; Unfolded Protein Response.


Figures

None
Graphical abstract
Figure 1
Figure 1
ERdj4 Is a Selective IRE1 Repressor (A) XBP1s::Turquoise and CHOP::GFP-reporter activity in CHO cells with the indicated ER-localized J-protein (ERdj) deleted. Shown is the median fluorescence (± SEM) from 20,000 cells, normalized to WT. Inset: 2-dimensional flow cytometry of untreated (UT) and tunicamycin-treated (Tm) WT CHO reporter cells. (B) XBP1s::Turquoise and CHOP::GFP activity in CHO cells untreated or treated with the IRE1 inhibitor 4μ8C, which blocks IRE1-dependent CHOP activation. Fluorescence normalized to WT. Mean of medians ± SD, n = 3, ∗∗∗p = 0.0005, repeated measurements one-way ANOVA, Dunnett’s multiple corrections test. (C) XBP1s::Turquoise signals from cells transfected with empty plasmid or with mCherry marked plasmid encoding ERdj4 with a WT or inactive J domain (ERdj4QPD). Transfected cells were gated for moderate mCherry expression levels, as shown in Figure S1B. (D) Immunoblot of immunoprecipitated endogenous IRE1α analyzed by Phos-tag SDS-PAGE. Where indicated, cells were treated with dithiothreitol (DTT). Fraction of active (phosphorylated) IRE1-P from this representative blot is noted. (E) Representative immunoblot of endogenous IRE1α and associated BiP recovered from the indicated cell lines by immunoprecipitation of IRE1α. (F) Ratio of BiP to IRE1 signal in six independent experiments as in (E). Mean ± SD, p = 0.0118, parametric ratio paired Student’s t test). See also Figure S1.
Figure S1
Figure S1
Wild-Type ERdj4 Rescues ΔERdj4, Related to Figure 1 (A) Plot of tunicamycin (Tm) concentration-dependent changes in XBP1s::Turquoise and CHOP::GFP reporter gene activity in wild-type CHO cells. Shown is the median fluorescence value (normalized to the untreated sample) obtained from 10,000 cells in experimental triplicates and the fit to a sigmoidal dose-response curve. (B) Dual channel flow cytometry plots of the XBP1s::Turquoise reporter and mCherry (a transfection marker) in wild-type and ΔERdj4 cells transiently transfected with a mCherry-tagged plasmid encoding no ERdj4 (“empty”), wild-type ERdj4 and mutant ERdj4QPD. The red rectangle delineates the gate used to select cells expressing moderate levels of mCherry-tagged plasmid for the histogram shown in Figure 1C. (C) XBP1s::Turquoise and CHOP::GFP signals from cells of the indicated genotype (wild-type, WT or ΔERdj4) transfected with ER-localized mCherry (ER-mCherry, a control) or mCherry tagged full-length ERdj4 (ERdj4-mCherry), mCherry tagged ERdj4 isolated J domain (1-90) (J4-mCherry; WT and QPD, lacking the C-terminal targeting domain). Transfected cells were gated for moderate mCherry expression as in (B) above. (D) XBP1s::Turquoise signals from wild-type or ΔERdj4 cells. Where indicated, cells were treated with tunicamycin (Tm) or the IRE1 inhibitor 4μ8c.
Figure 2
Figure 2
ERdj4 Promotes a BiP-IRE1 Complex (A) Schema of the IRE1LD-GST protein containing the entire human IRE1α luminal and transmembrane domains (residues 19–486, solid) fused to GST (striped). (B) Representative immunoblots of IRE1LD-GST and endogenous BiP, recovered by glutathione affinity chromatography or in lysate of transfected ΔERdj4 cells. (C) Ratio of BiP to IRE1LD-GST signal from 4 experiments, as in (B). Mean ± SD. ∗∗p = 0.0048, parametric ratio paired Student’s t test). (D) As in (B); compares IRE1LD-GST to PERKLD-GST. R(B/LD) notes the ratio of the BiP signal to the LD-GST species from the representative experiment shown. (E) As in (B); compares ERdj4 to ERdj6. (F) As in (B); compares IRE1LD-GST to IRE1CLD-GST. (G) As in (B); prior to elution with sample buffer, the indicated glutathione Sepharose beads were incubated for 5 min with 3 mM ATP at room temperature. (H) Immunoblot of endogenous IRE1α and BiP recovered from CHO cells of the indicated genotype by immunoprecipitation of IRE1α. Prior to elution with sample buffer, the indicated protein-A Sepharose beads were incubated with ATP (as in G). The bottom panel shows the input of BiP in the two samples.
Figure 3
Figure 3
ERdj4 Opposes IRE1 Dimerization (A) Crystal structure of human IRE1LD (PDB: 2HZ6) highlighting Q105 (black) at the dimer interface. (B) Reducing Phos-tag SDS-PAGE of endogenous IRE1α recovered from WT or IRE1Q105C cells treated in the indicated manner. Fraction of active (phosphorylated) IRE1-P from this representative immuno blot is noted. (C) Representative immunoblot of endogenous IRE1α and PERK recovered from the indicated cell lines by immunoprecipitation of IRE1α or PERK and resolved by reducing and non-reducing SDS-PAGE. ER stress was induced by thapsigargin (Tg) or DTT. (D) Schema of IRE1LD Q105C-GST with the Q105C-Q105C disulfide indicated. (E) Representative immunoblot of IRE1LD Q105C-GST and BiP recovered from ΔERdj4 cells transfected with indicated constructs and resolved by non-reducing SDS-PAGE. (F) Ratio of disulfide-bound IRE1LD Q105C-GST dimer to free thiol in indicated samples. Quantified in six independent experiments as shown in (D) above (mean ± SD, n = 6, ∗∗∗∗p < 0.0001, unpaired Student’s t test with Welch’s correction). See also Figure S2.
Figure S2
Figure S2
ERN1Q105C/IRE1Q105C Encodes a Functional (albeit Attenuated) IRE1, Related to Figure 3 Histogram of XBP1s::Turquoise and CHOP::GFP signals obtained by flow cytometry analysis of the indicated cell lines untreated or exposed overnight to 2-deoxyglucose (2DG, 4mM), or tunicamycin (Tm, 2.5 μg/ml).
Figure 4
Figure 4
Complex Formation between BiP and IRE1 Requires ERdj4 (A) Coomassie stain of purified BiP, IRE1LD-bio, and ERdj4 resolved by SDS-PAGE. (B) Schema of the experiment shown in (C). (C) Coomassie-stained SDS-PAGE gel of biotinylated IRE1LD-bio and BiP recovered on a streptavidin matrix from reactions constituted as indicated. Concentrations used were 5 μM IRE1LD-bio, 8 μM ERdj4, 30 μM BiP, and 2 mM ATP. Q = ERdj4QPD, T = BiPT229A, V = BiPV461F, and J = isolated J domain of ERdj4. Proteins were eluted sequentially with ATP (ATP elution) and SDS sample buffer (SDS elution). (D) As in (B) and (C), with IRE1CLD. (E) Schema of the experiment shown in (F). (F) Sequential fluorescence scan and Coomassie stain of the same SDS-PAGE gel of proteins recovered on immobilized streptavidin from reactions assembled from the indicated components. The IRE1LD-bio-loaded beads were allowed to associate with fluorescently labeled IRE1LD-TAM, whose recovery in the pull-down reports on the integrity of the IRE1LD dimer. Concentrations used were 0.5 μM IRE1LD-TAM, 8 μM ERdj4, 30 μM BiP, and 2 mM ATP. Q = ERdj4QPD, T = BiPT229A, V = BiPV461F, and J = isolated J domain of ERdj4. (G) As in (E) and (F), with 1 μM GRP170. (H) Quantification of the effect of GRP170 on BiP association with IRE1LD-bio, as in (G). Mean ± SD, n = 3, p = 0.0223 by Student’s paired ratio t test. See also Figure S3.
Figure S3
Figure S3
Canonical Complex Formation between BiP and IRE1, Related to Figure 4 (A) Coomassie-stained SDS-PAGE gel of biotinylated IRE1LD-bio and BiP recovered on a streptavidin matrix from reactions constituted as in Figure 4B, with BiP or the nucleotide-binding domain of BiP (NBD) as indicated. Note: We have not been able to observe noncanonical complex formation between IRE1LD and the BiP NBD. (B) Fluorescence trace (Ex: 496 nm Em: 524 nm) of IRE1LD-OG elution from a Sec3 size-exclusion chromatography column. Reaction mixtures of the indicated composition were incubated at 30°C for 20 minutes and clarified at 21,000 g for 5 minutes. (C) Quantification of the effect of GRP170 on IRE1LD-TAM association with IRE1LD-bio, as in Figure 4G. Mean ± SD, n = 3, p = 0.0293 by Student’s paired ratio t test.
Figure 5
Figure 5
ERdj4 Recruits BiP to Disrupt IRE1 Dimerization (A) Bio-layer interferometry (BLI) signal of streptavidin sensors loaded with the indicated biotinylated ligand and reacted sequentially with the indicated solution of analyte, followed sequentially by the indicated solutions of BiP and ATP. Concentrations used were 1.5 μM ERdj4, 1 μM BiP, and 2 mM ATP. (B) Protein recovered from a BLI sensor lacking (lane 1) or containing an IRE1LD-bio ligand (lanes 2–4). The sensor was incubated with an ERdj4 analyte and then with BiP or BiPV461F ± ATP. (C) Schema of the experiment shown in (D). (D) Fluorescence scans and Coomassie-stained SDS-PAGE gel of proteins recovered on immobilized streptavidin from reactions assembled from the indicated components. The IRE1LD-bio-loaded streptavidin beads were pre-associated with IRE1LD-TAM and then incubated in a solution of BiP, ERdj4, GRP170, and ATP. Bars show mean IRE1LD-TAM signal recovered with IRE1LD-bio (± SD) from four independent experiments, ∗∗∗p = 0.001 by parametric student’s paired ratio t test. (E) Time-dependent changes in BLI signal of sensors loaded with either WT biotinylated IRE1LD (blue trace) or covalent dimeric disulfide-linked IRE1LD Q105C-bio (red trace) ligands. Ligand loading (step 1), wash (step 2), interaction with ERdj4 (step 3), and wash (step 4) are shown. (F) Coomassie stained non-reducing SDS-PAGE gel of IRE1LD-bio and BiP recovered on a streptavidin matrix from reactions constituted as in Figures 4B and 4C but with IRE1LD-bio or covalent dimeric disulfide-linked IRE1LD Q105C-bio. Proteins were eluted with SDS sample buffer. See also Figure S4.
Figure S4
Figure S4
Disruption of Pre-formed IRE1LD-Dimers, Related to Figure 5 (A) Bio-layer interferometry (BLI) signal from streptavidin sensors pre-loaded with a biotinylated ERdj4 ligand (or with an irrelevant control biotinylated GADD34 ligand) and reacted with the indicated concentration of IRE1LD as an analyte and then transferred to a buffer only (wash) solution. (B) BLI signal from streptavidin sensors pre-loaded with biotinylated IRE1LD ligand and reacted with the indicated concentrations of ERdj4 as an analyte and transferred to a buffer only (wash) solution before incubation with 1 μM BiP and 2 mM ATP. (C) BLI signal from streptavidin sensors pre-loaded with biotinylated IRE1LD ligand and reacted with ERdj4 as an analyte and then transferred to a buffer only (wash) solution before incubation with the indicated concentrations of BiP and 2 mM ATP. (D) (Left) BLI signal of streptavidin sensors loaded with the wild-type biotinylated IRE1LD, or covalent dimeric disulfide-linked biotinylated IRE1LD Q105C ligands and reacted with ERdj4, followed sequentially by the indicated solutions. Concentrations used were 1.7 μM ERdj4, 6 μM BiP, 2 mM ATP. (Right) Coomasie-stained non-reducing SDS-PAGE gel of protein recovered by SDS sample buffer elution from the BLI sensors used (left). The dotted line indicates the boundary at which the image contrast/brightness properties were treated differently to make the image clearer. Note: To enable formation of Q105C-disulfide, without interference by other cysteines, both the WT IRE1LD and the IRE1LD Q105C ligands were surface biotinylated on exposed lysine residues. This coupling chemistry likely accounts for the differences in kinetics of the BLI signal observed in this experiment as compared with (A), (B), and (C) and Figure 5A, in which the IRE1LD ligand was biotinylated on a single C-terminal cysteine residue (D443C) using maleimide biotin
Figure 6
Figure 6
Unfolded Proteins Compete for BiP to Restore the IRE1 Dimer (A) Donor fluorescence as a function of the concentration of competing unlabeled IRE1LD equilibrated with a FRET pair (0.2 μM labeled IRE1LD) consisting of an IRE1LD-OG488 donor (conjugated at R234C) and IRE1LD-TAM acceptor (conjugated at S112C) (blue trace, mean values ± SD from three independent experiments). Also shown are titrations of unlabeled IRE1LD into a mock FRET sensor (no IRE1LD-TAM acceptor; red trace) and titration of BiP with ADP (± ERdj4) into the pre-equilibrated FRET pair (green and black traces). (B) Time-dependent change in donor fluorescence of the IRE1LD FRET pair from (A) incubated at t = 0 with the components shown to the right. Concentrations used were 0.2 μM FRET IRE1LD, 30 μM BIP, 2.5 μM ERdj4, 1 μM GRP170, and 2 mM ATP. JERdj4 lacks the C-terminal targeting region. BiPAMP is AMPylated BiP. The asterisks marks a reaction set up with a mock FRET sensor lacking the IRE1LD-TAM acceptor. (C) Time-dependent change in donor fluorescence of the IRE1LD FRET pair exposed at t = 0 to BiP, ERdj4 and ATP (arrow labeled “+ ATP”). Concentrations used were 0.2 μM FRET IRE1LD, 50 μM BIP, 2.5 μM ERdj4, and 2 mM ATP. Following disruption of the FRET pair, at 60 min, the sample was injected with BiP binding peptide and the J domain of ERdj6 (2.5 μM) (arrow labeled “+ competitor”). See also Figure S5.
Figure S5
Figure S5
ERdj4 and BiP Monomerize the IRE1 Core Luminal Domain, Related to Figure 6 As in Figure 6B, but with OG488 and TAMRA-labeled IRE1CLD.
Figure 7
Figure 7
IRE1 Repression by ERdj4 and BiP and Activation by Unfolded Proteins In the unstressed ER (green shading), ERdj4 binds the IRE1 CLD via its C-terminal targeting domain. ERdj4 stimulates BiP’s ATPase activity to promote BiP binding to IRE1, ejection of ERdj4, and formation of a repressive BiP-IRE1 complex with a disrupted dimer interface. The BiP-IRE1 complex turns over by nucleotide exchange. Free ERdj4 and BiP recruit the released IRE1 (either as a monomer or dimer) in a kinetically maintained repressive cycle. Accumulating unfolded proteins during ER stress (red shading) compete for BiP and/or ERdj4, interrupting the cycle of repression. IRE1 monomers are free to dimerize and activate downstream signals.

References

    1. Abravaya K., Myers M.P., Murphy S.P., Morimoto R.I. The human heat shock protein hsp70 interacts with HSF, the transcription factor that regulates heat shock gene expression. Genes Dev. 1992;6:1153–1164. - PubMed
    1. Adamson B., Norman T.M., Jost M., Cho M.Y., Nuñez J.K., Chen Y., Villalta J.E., Gilbert L.A., Horlbeck M.A., Hein M.Y. A Multiplexed Single-Cell CRISPR Screening Platform Enables Systematic Dissection of the Unfolded Protein Response. Cell. 2016;167:1867–1882. - PMC - PubMed
    1. Avezov E., Cross B.C., Kaminski Schierle G.S., Winters M., Harding H.P., Melo E.P., Kaminski C.F., Ron D. Lifetime imaging of a fluorescent protein sensor reveals surprising stability of ER thiol redox. J. Cell Biol. 2013;201:337–349. - PMC - PubMed
    1. Behnke J., Feige M.J., Hendershot L.M. BiP and its nucleotide exchange factors Grp170 and Sil1: mechanisms of action and biological functions. J. Mol. Biol. 2015;427:1589–1608. - PMC - PubMed
    1. Bertolotti A., Zhang Y., Hendershot L.M., Harding H.P., Ron D. Dynamic interaction of BiP and ER stress transducers in the unfolded-protein response. Nat. Cell Biol. 2000;2:326–332. - PubMed

MeSH terms