. 2017 Dec 7;68(5):978-992.e4.
doi: 10.1016/j.molcel.2017.11.002. Epub 2017 Nov 30.

Transcriptome-wide Analysis of Roles for tRNA Modifications in Translational Regulation

Affiliations

Transcriptome-wide Analysis of Roles for tRNA Modifications in Translational Regulation

Hsin-Jung Chou et al. Mol Cell. .

Abstract

Covalent nucleotide modifications in noncoding RNAs affect a plethora of biological processes, and new functions continue to be discovered even for well-known modifying enzymes. To systematically compare the functions of a large set of noncoding RNA modifications in gene regulation, we carried out ribosome profiling in budding yeast to characterize 57 nonessential genes involved in tRNA modification. Deletion mutants exhibited a range of translational phenotypes, with enzymes known to modify anticodons, or non-tRNA substrates such as rRNA, exhibiting the most dramatic translational perturbations. Our data build on prior reports documenting translational upregulation of the nutrient-responsive transcription factor Gcn4 in response to numerous tRNA perturbations, and identify many additional translationally regulated mRNAs throughout the yeast genome. Our data also uncover unexpected roles for tRNA-modifying enzymes in regulation of TY retroelements, and in rRNA 2'-O-methylation. This dataset should provide a rich resource for discovery of additional links between tRNA modifications and gene regulation.

Keywords: RNA modifications; noncoding RNA; protein translation; ribosome profiling; tRNA.


Figures

Figure 1
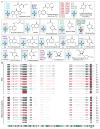
Figure 1. Overview of dataset
(A) Nonessential genes involved in tRNA modifications in budding yeast. Encoded proteins are grouped roughly according to function, as for example the Elongator complex is grouped along with other enzymes required for formation of the mcm5s2U wobble modification. For each group of enzymes, the known product is shown (R indicates ribose in the tRNA backbone for modified bases), along with a tRNA cartoon showing the best-characterized modification locations. For some sets of mutants, the modification shown represents only a subset of products, as for example Elongator and associated factors also catalyze the formation of mcm5U, ncm5U, and ncm5Um, in addition to mcm5s2U as shown. Throughout the manuscript, modifying enzymes are generally color-coded as indicated here, except in cases where subsets of related factors must be distinguished. (B) Example of RNA-Seq and ribosome footprinting data for chr3:57,000–107,000, showing strong correlations between biological replicate experiments, and also, for the majority of the transcriptome, between mutant strains. See also Supplemental Figures S1 and S2, and Tables S1–S3.
Figure 2
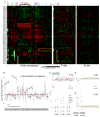
Figure 2. Codon-level analysis of ribosome occupancy
(A) Effects of all 57 mutations on average ribosome occupancy at A, P, and E sites over all 61 codons (excluding stop codons). Columns depict mutations, with key mutations identified above clusters – Supplemental Figure S3A shows an expanded view with all 57 mutants annotated, and the entire dataset is available as Table S6. Heat maps show log2 fold changes relative to the wild-type average (red=increased codon occupancy; green=decreased codon occupancy). Data for A, P, and E sites are all sorted identically, based on A site dataset clustering. Note that P and E site panels are scaled to 50% of the width of the A site panel. Yellow boxes highlight examples shown in panels (B–F). (B) A site ribosome occupancy for all 61 codons for Elongator-related mutants, relative to wild-type average. Grey diamonds show average occupancy (zero, by definition) and standard deviation for 9 replicates of BY4741, red diamonds show average and standard deviation for 30 Elongator-related datasets (2 biological replicates for 15 deletion mutants). The expected increase in ribosome occupancy is confirmed over AAA, CAA, and GAA, as indicated. (C–E) Data are shown as in panel (B), but here data are shown separately for known target codons (left columns, indicated) with all remaining codons then sorted alphabetically. Data for (C–D) and (E) show A and P site occupancy, as indicated. (F) Discrepant behavior between mutants affecting yW synthesis. A, P, and E site occupancy data shown for Phe codons for the four tyw mutants, as indicated – Tyw1-3 are indistinguishable by design, while the discrepant behavior of Tyw4 is visually emphasized.
Figure 3
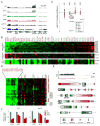
Figure 3. Dramatic effects of Trm7 on ribosome occupancy profiles
(A) Increased ribosome occupancy at 5′ UTRs in trm7Δ mutants. RNA-Seq and RPF data for wild-type and trm7Δ mutant yeast at characteristic genomic loci. Red arrows show examples of increased ribosome occupancy in the mutant. (B) Polysome profiles of the indicated strains reveal a global deficit in translation in trm7Δ. WT and unrelated trm4Δ are shown for comparison. See also Supplemental Figures S4A–B. (C) RiboMeth-Seq analysis of rRNA 2′-O-methylation in wild-type yeast. Top panel shows counts (normalized to reads per million rRNA-mapping reads) of sequencing reads starting across 54 nt of 18S rRNA. The three annotated locations are dramatically under-represented, and correspond to three well-known 2′-O-methylation sites on 18S rRNA. Bottom panel shows methylation “A scores” (Birkedal et al., 2015; Marchand et al., 2016) aggregated for 8 wild-type datasets – individual replicates are nearly indistinguishable – with * indicating previously-validated methylation sites. Our dataset also recovers known methylation sites on 25S rRNA (Supplemental Figure S4C). (D) Trm7 effects on rRNA RiboMeth-Seq. Scatterplot compares methylation A scores for WT (x axis, n=8) and trm7Δ (y axis, n=8) strains. The five significantly differentially-methylated nucleotides are indicated with large purple points, and lose methylation in trm7Δ but are unaffected in the unrelated trm3Δ mutant (Supplemental Figures S4D–E). (E) Normalized RiboMeth-Seq 5′ end read starts (as in (C), top panel) for 14 nt surrounding 25S rRNA C663, as indicated. (F) Comparison of mutant effects on the five candidate Trm7 target sites in 25S rRNA, shown as the change in A score for each mutant replicate relative to the average of 8 WT replicates. For the five Trm7 target nucleotides, data are shown for WT, trm7, and trm3 mutants (n=8 each), and for trm13, trm44, trm732, and rtt10 mutants (n=2 each). Note that C663 methylation is lost in mutants affecting Trm7 as well as one of its heterodimerization partners, Rtt10, while the remaining four potential Trm7 target sites are not affected by either Trm732 or Rtt10.
Figure 4
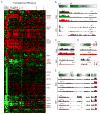
Figure 4. Effects of tRNA modifying enzymes on RNA abundance
(A) Overview of all RNA-Seq changes across the 57 mutants in this study. Data are shown for all genes changing at least 2-fold in at least 2 mutants (filtered for average mRNA abundance > 10 rpkm). Boxes show 5 relatively coherent gene expression clusters, with prominent functional annotations enriched in each geneset indicated. See also Supplemental Figure S5. (B) Translational upregulation of GCN4 is a common occurrence in tRNA modification mutants. Top panels show RNA-Seq and RPF data for the GCN4 ORF and its 5′ UTR, which carries 4 well-studied regulatory upstream ORFs (uORFs). Zoom-ins focusing on the GCN4 coding region show RNA-Seq and RPF data for the indicated mutants. (C) Mutant effects on GCN4 RNA and RPF levels are shown for all mutants, sorted from high to low Gcn4 translational upregulation. (D) RNA-Seq correlates of GCN4 translational upregulation. Rows show Gcn4 targets (genes that exhibit >2-fold increase in RNA Pol2 occupancy in (Qiu et al., 2016)) for all mutants, sorted as in (C).
Figure 5
Figure 5. Analysis of silencing-related phenotypes
(A) RNA-Seq data for a ~15 kb locus adjacent to TEL2R. Two notable phenotypes are indicated with arrows – repression of PHO genes, observed in a wide range of mutants in this study (Figure 4A), and derepression of a subset of subtelomeric genes, which is confined primarily to mutants in the KEOPS complex. (B) Mutant effects on expression of haploid-specific genes (a robust reporter for silent mating locus derepression), subtelomeric genes, and PHO genes, as indicated. Mutants are sorted by their average effect on haploid-specific genes. (C) Mutant effects on translational efficiency of Sir proteins. (D) Downregulation of TY1 expression in Elongator-related mutants. Cluster shows genes from Cluster 4 (Figure 4A) – structural genes encoded by the TY1 retroelement are indicated with orange boxes. (E) ORFs downregulated in Elongator-related mutants are associated with TY1 long terminal repeats (LTRs). Top panels show RNA-Seq data for TYE7 for WT and a representative Elongator-related mutant. Bottom panels show genomic loci associated with the ORFs shown in panel (D). (F) Elongator effects on target genes are not mediated via changes in TYE7 expression. Q-RT-PCR for two ORFs and for a TY1 element, as well as two normalization controls (TEF1 and TDH3), were performed in one of six strain backgrounds – wild-type, uba4Δ, elp3Δ, tye7Δ, tye7Δuba4Δ, and tye7Δelp3Δ, as indicated – in four replicates. All data are normalized to the wild-type expression levels. Left panel validates our RNA-Seq observations, while right panel shows Elongator effects on these genes in the absence of Tye7. TY1 mRNA levels are decreased in tye7Δ – as expected – but, importantly, deletion of Elongator leads to a further decrease in TY1 expression. See also Supplemental Figure S6.
Figure 6
Figure 6. Effects of tRNA-modifying enzymes on translational efficiency
(A) Overview of translational efficiency dataset. Heatmap shows log2 fold changes, relative to wild-type, of all genes with TE changes of at least 2-fold in 2 or more mutants. See also Supplemental Figure S7. (B) Translational regulation of SER3 by uORFs. RNA and RPF (ribosome-protected footprint) data are shown for WT, pus7Δ (where SER3 is unaffected) and elp1Δ, in which SER3 translational efficiency is increased. Notable here is a peak of ribosome occupancy over the upstream regulatory transcript SRG1 which is lost (despite no change in SRG1 RNA abundance) in mutants that translationally derepress SER3. (C–E) Examples of genes translationally repressed in various tRNA modifying enzyme mutants. Data shown as in panel (B), with green arrows highlighting diminished ribosome occupancy of ORFs, and red arrows highlighting likely regulatory uORFs. Here, known (CPA1) or putative (CMR3, YGP1) upstream regulatory ORFs are highlighted in red in the genomic annotation.

References

    1. Alexandrov A, Chernyakov I, Gu W, Hiley SL, Hughes TR, Grayhack EJ, Phizicky EM. Rapid tRNA decay can result from lack of nonessential modifications. Molecular cell. 2006;21:87–96. - PubMed
    1. Astrom SU, Bystrom AS. Rit1, a tRNA backbone-modifying enzyme that mediates initiator and elongator tRNA discrimination. Cell. 1994;79:535–546. - PubMed
    1. Birkedal U, Christensen-Dalsgaard M, Krogh N, Sabarinathan R, Gorodkin J, Nielsen H. Profiling of ribose methylations in RNA by high-throughput sequencing. Angew Chem Int Ed Engl. 2015;54:451–455. - PubMed
    1. Chen C, Huang B, Eliasson M, Ryden P, Bystrom AS. Elongator complex influences telomeric gene silencing and DNA damage response by its role in wobble uridine tRNA modification. PLoS genetics. 2011;7:e1002258. - PMC - PubMed
    1. Czerwoniec A, Dunin-Horkawicz S, Purta E, Kaminska KH, Kasprzak JM, Bujnicki JM, Grosjean H, Rother K. MODOMICS: a database of RNA modification pathways. 2008 update. Nucleic acids research. 2009;37:D118–121. - PMC - PubMed

MeSH terms