. 2018 May;141(5):1870-1879.e14.
doi: 10.1016/j.jaci.2017.08.033. Epub 2017 Nov 30.

Bedroom allergen exposures in US households

Affiliations

Bedroom allergen exposures in US households

Päivi M Salo et al. J Allergy Clin Immunol. 2018 May.

Abstract

Background: Bedroom allergen exposures contribute to allergic disease morbidity because people spend considerable time in bedrooms, where they come into close contact with allergen reservoirs.

Objective: We investigated participant and housing characteristics, including sociodemographic, regional, and climatic factors, associated with bedroom allergen exposures in a nationally representative sample of the US population.

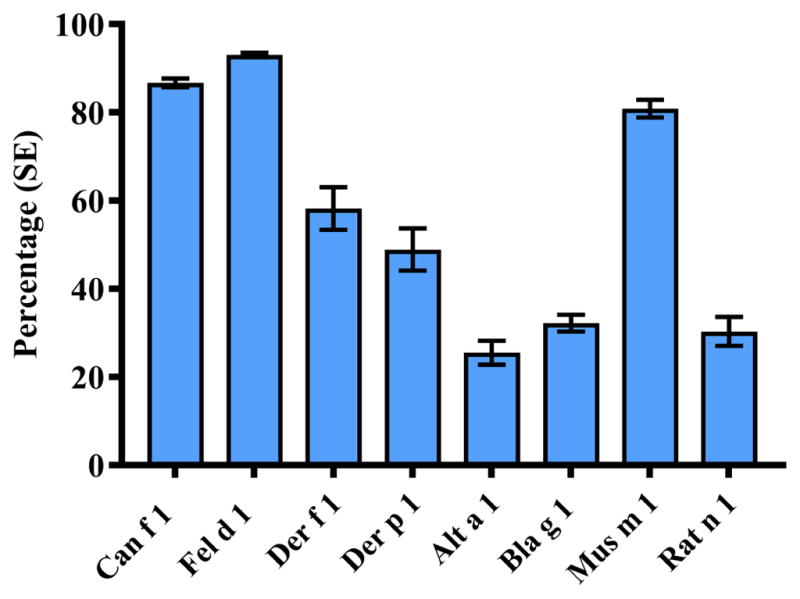
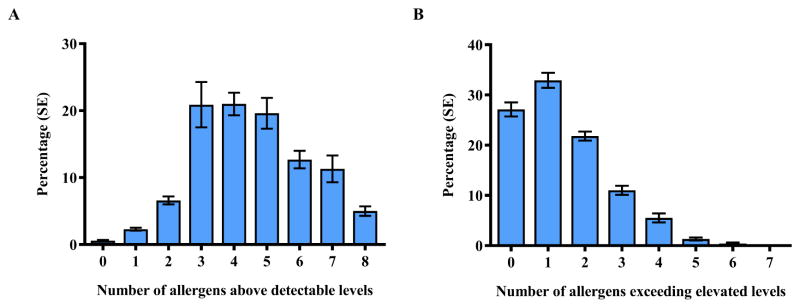
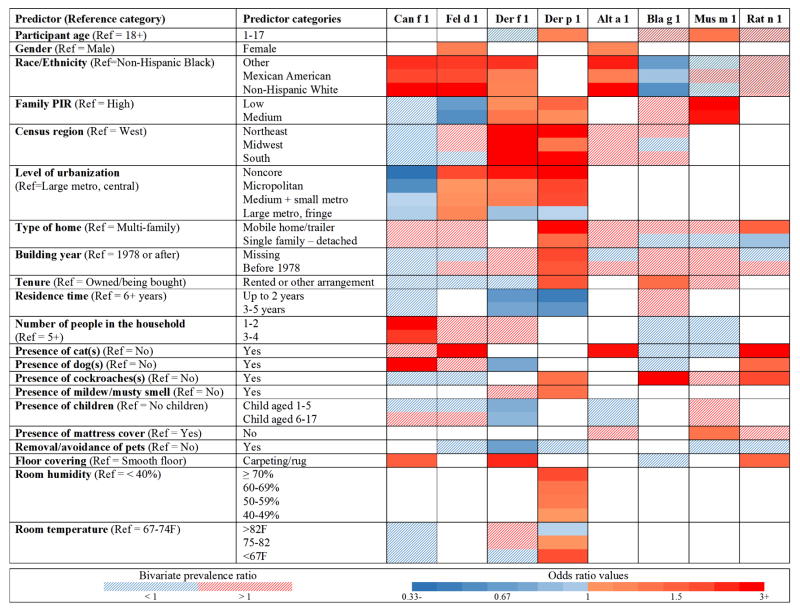
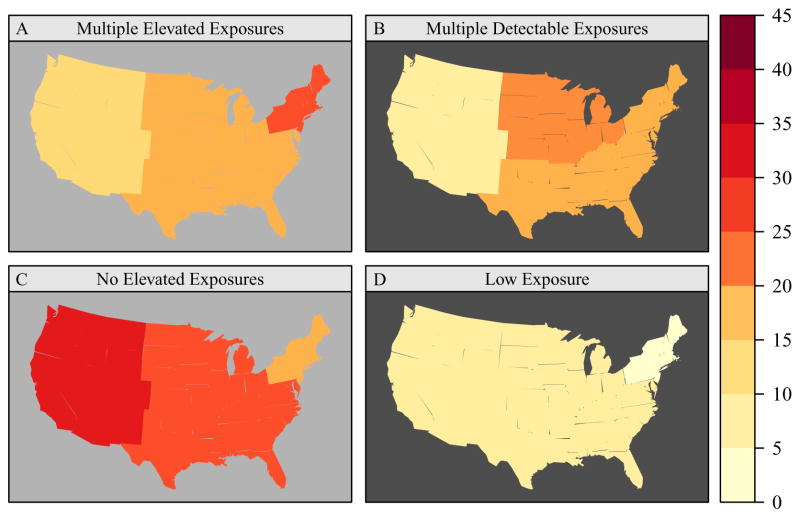
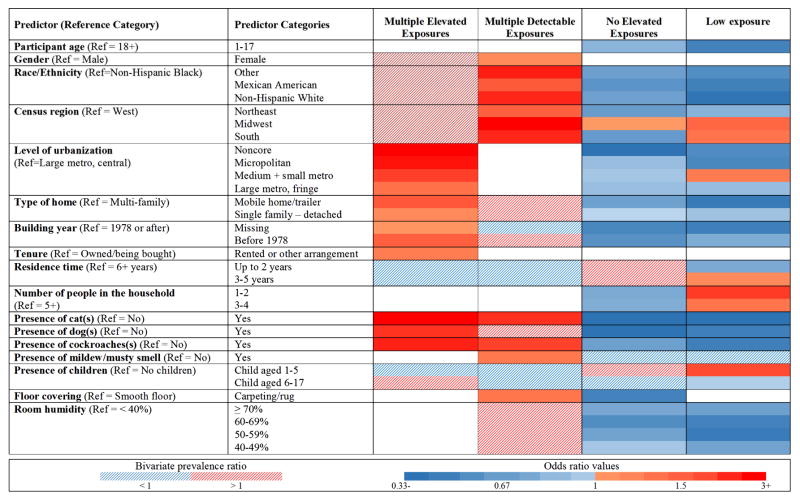
Methods: Data were obtained from National Health and Nutrition Examination Survey 2005-2006. Information on participant and housing characteristics was collected by using questionnaires and environmental assessments. Concentrations of 8 indoor allergens (Alt a 1, Bla g 1, Can f 1, Fel d 1, Der f 1, Der p 1, Mus m 1, and Rat n 1) in dust vacuumed from nearly 7000 bedrooms were measured by using immunoassays. Exposure levels were classified as increased based on percentile (75th/90th) cutoffs. We estimated the burden of exposure to multiple allergens and used multivariable logistic regression to identify independent predictors for each allergen and household allergen burden.

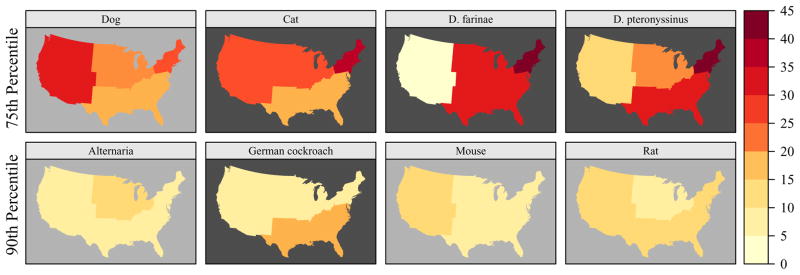
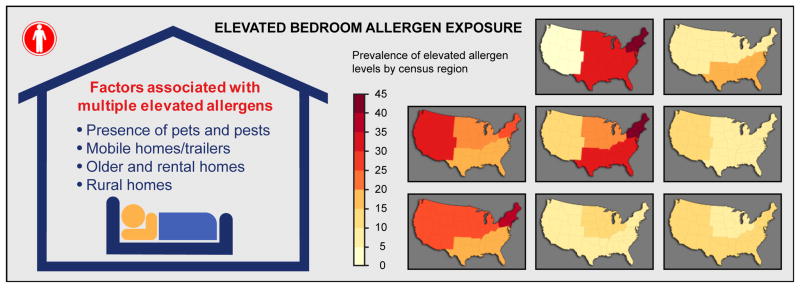
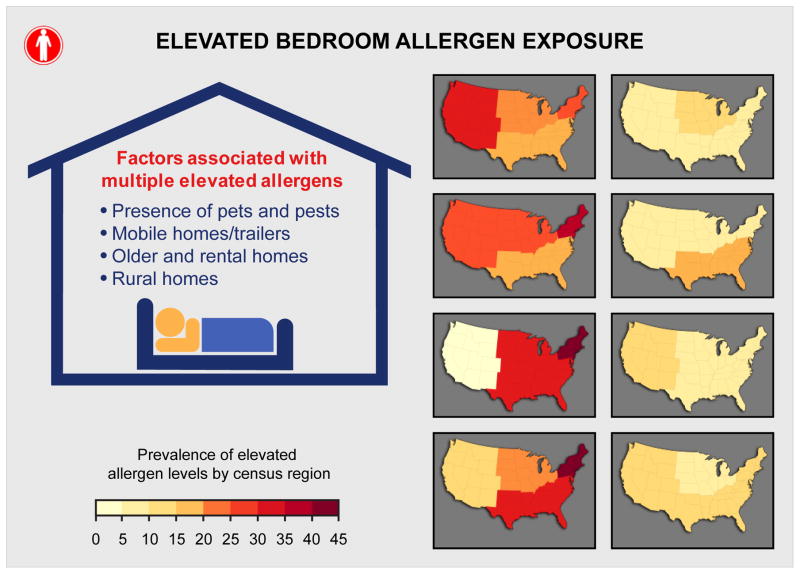
Results: Almost all participants (>99%) had at least 1 and 74.2% had 3 to 6 allergens detected. More than two thirds of participants (72.9%) had at least 1 allergen and 18.2% had 3 or more allergens exceeding increased levels. Although exposure variability showed significant racial/ethnic and regional differences, high exposure burden to multiple allergens was most consistently associated with the presence of pets and pests, living in mobile homes/trailers and older and rental homes, and living in nonmetropolitan areas.

Conclusions: Exposure to multiple allergens is common. Despite highly variable exposures, bedroom allergen burden is strongly associated with the presence of pets and pests.

Keywords: Allergen; allergy; exposure; home; indoor.


Figures

Figure 1
Figure 1
Prevalence (±SE) of exposure to detectable bedroom allergen levels in the US population.
Figure 2
Figure 2
Exposure to multiple allergens in bedrooms. Percentages (±SE) of NHANES 2005–2006 participants with detectable (A) and elevated (B) levels of allergens by numbers of allergens exceeding allergen-specific thresholds (LOD, 75th/90th percentile). Can f 1, Fel d 1, Der f 1, and Der p 1 levels were elevated if allergen concentration >75th percentile; Alt a 1, Bla g 1, Mus m 1 and Rat n 1 levels were elevated if allergen concentration > 90th percentile.
Figure 3
Figure 3
Prevalence of elevated allergen levels by census region. Can f 1, Fel d 1, Der f 1, and Der p 1 levels were elevated if allergen concentration >75th percentile; Alt a 1, Bla g 1, Mus m 1 and Rat n 1 levels were elevated if allergen concentration > 90th percentile. The dark background color in the map indicates statistically significant differences (P < 0.05) across US census regions (Northeast, Midwest, South, West).
Figure 3
Figure 3
Prevalence of elevated allergen levels by census region. Can f 1, Fel d 1, Der f 1, and Der p 1 levels were elevated if allergen concentration >75th percentile; Alt a 1, Bla g 1, Mus m 1 and Rat n 1 levels were elevated if allergen concentration > 90th percentile. The dark background color in the map indicates statistically significant differences (P < 0.05) across US census regions (Northeast, Midwest, South, West).
Figure 4
Figure 4
Independent predictors of elevated allergen levels. The odds ratios from multivariable regression models are presented in the online repository (Table E4). For the independent predictors, the solid red/blue color indicates the direction of the associations (red increasing; blue decreasing) when each of the participant/housing characteristic categories were compared to the reference category adjusting for the other independent predictor variables in the model. The dashed areas indicate participant/housing characteristics included in initial prediction models based on bivariate analysis (P < 0.25; Figure E2). The metropolitan counties are subdivided based on the population of their metropolitan statistical area (MSA): large (central, fringe), for MSA population of 1 million or more; medium, for MSA population of 250,000–999,999; and small, for MSA population below 250,000. Non-metropolitan counties not defined as micropolitan are considered to be noncore and are thought of as the most rural areas.
Figure 4
Figure 4
Independent predictors of elevated allergen levels. The odds ratios from multivariable regression models are presented in the online repository (Table E4). For the independent predictors, the solid red/blue color indicates the direction of the associations (red increasing; blue decreasing) when each of the participant/housing characteristic categories were compared to the reference category adjusting for the other independent predictor variables in the model. The dashed areas indicate participant/housing characteristics included in initial prediction models based on bivariate analysis (P < 0.25; Figure E2). The metropolitan counties are subdivided based on the population of their metropolitan statistical area (MSA): large (central, fringe), for MSA population of 1 million or more; medium, for MSA population of 250,000–999,999; and small, for MSA population below 250,000. Non-metropolitan counties not defined as micropolitan are considered to be noncore and are thought of as the most rural areas.
Figure 5
Figure 5
Prevalence of allergen burden by census region. Allergen Burden Outcomes: Multiple Elevated Exposures (≥3 allergens at elevated levels); Multiple Detectable Exposures (≥7 allergens >LOD, ≥1 allergens at elevated levels); No Elevated Exposures (0 allergens at elevated levels); Low Exposure (≤2 allergens > LOD, 0 allergens at elevated levels). Can f 1, Fel d 1, Der f 1, and Der p 1 levels were elevated if allergen concentration >75 percentile; Alt a 1, Bla g 1, Mus m 1 and Rat n 1 levels were elevated if allergen concentration > 90 percentile. The dark background color in the map indicates statistically significant differences (P < 0.05) across census regions (Northeast, Midwest, South, West).
Figure 6
Figure 6
Independent predictors of allergen burden. Allergen Burden Outcomes: Multiple Elevated Exposures (≥3 allergens at elevated levels); Multiple Detectable Exposures (≥7 allergens LOD, ≥1 allergens at elevated levels); No Elevated Exposures (0 allergens at elevated levels); Low Exposure (≤2 allergens > LOD, 0 allergens at elevated levels). The odds ratios from multivariable regression models are presented in the online repository (Table E5). For the independent predictors, the solid red/blue color indicates the direction of the associations (red increasing; blue decreasing) when each of the participant/housing characteristic categories were compared to the reference category adjusting for the other independent predictor variables in the model. The dashed areas indicate participant/housing characteristics included in initial prediction models based on bivariate analysis (P < 0.25; Figure E4).

Similar articles

Cited by

References

    1. Custovic A. To what extent is allergen exposure a risk factor for the development of allergic disease? Clin Exp Allergy. 2015;45:54–62. - PubMed
    1. Kanchongkittiphon W, Mendell MJ, Gaffin JM, Wang G, Phipatanakul W. Indoor environmental exposures and exacerbation of asthma: an update to the 2000 review by the Institute of Medicine. Environ Health Perspect. 2015;123:6–20. - PMC - PubMed
    1. Erwin EA, Platts-Mills TA. Allergens. Immunol Allergy Clin North Am. 2005;25:1–14. - PubMed
    1. Phipatanakul W, Matsui E, Portnoy J, Williams PB, Barnes C, Kennedy K, et al. Environmental assessment and exposure reduction of rodents: a practice parameter. Ann Allergy Asthma Immunol. 2012;109:375–87. - PMC - PubMed
    1. Portnoy J, Kennedy K, Sublett J, Phipatanakul W, Matsui E, Barnes C, et al. Environmental assessment and exposure control: a practice parameter--furry animals. Ann Allergy Asthma Immunol. 2012;108:223e1–15. - PMC - PubMed

Publication types