. 2017 Dec 7;21(6):747-760.e7.
doi: 10.1016/j.stem.2017.11.003. Epub 2017 Nov 30.

Bone Marrow Myeloid Cells Regulate Myeloid-Biased Hematopoietic Stem Cells via a Histamine-Dependent Feedback Loop

Affiliations

Bone Marrow Myeloid Cells Regulate Myeloid-Biased Hematopoietic Stem Cells via a Histamine-Dependent Feedback Loop

Xiaowei Chen et al. Cell Stem Cell. .

Abstract

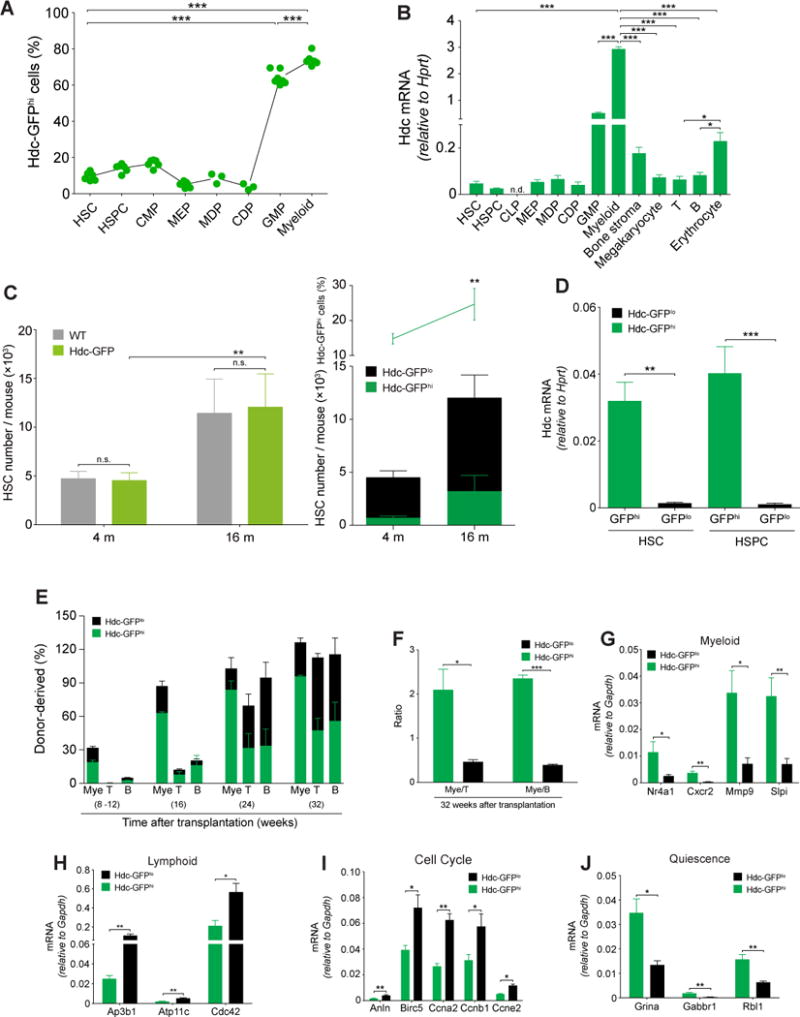
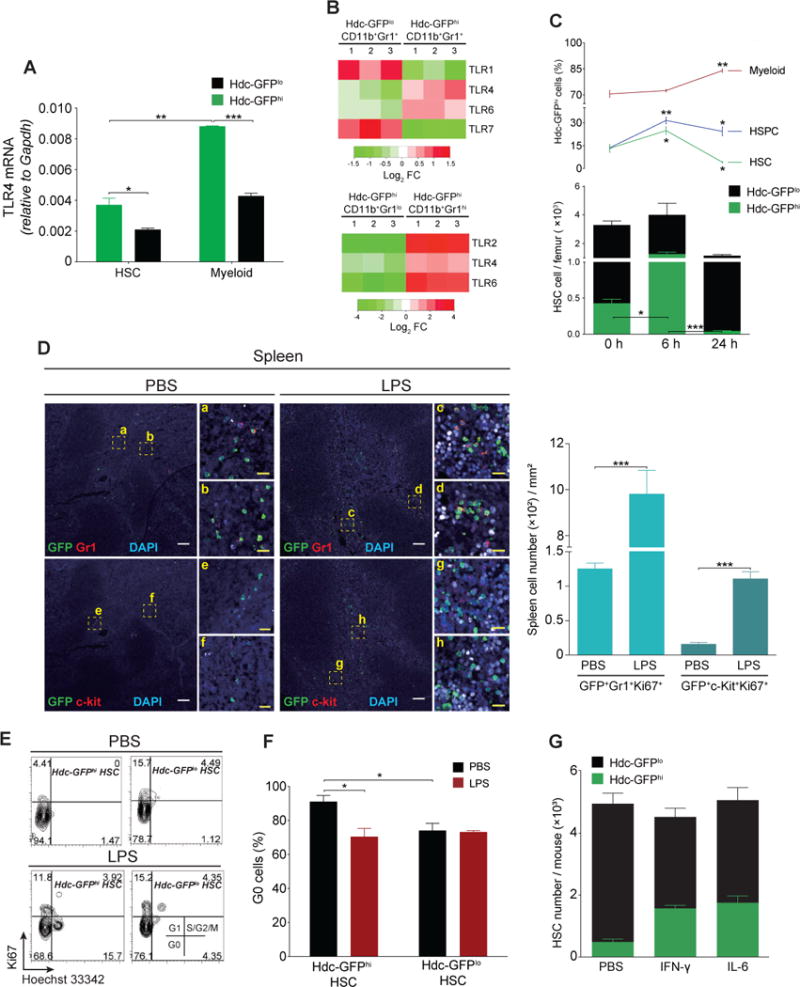
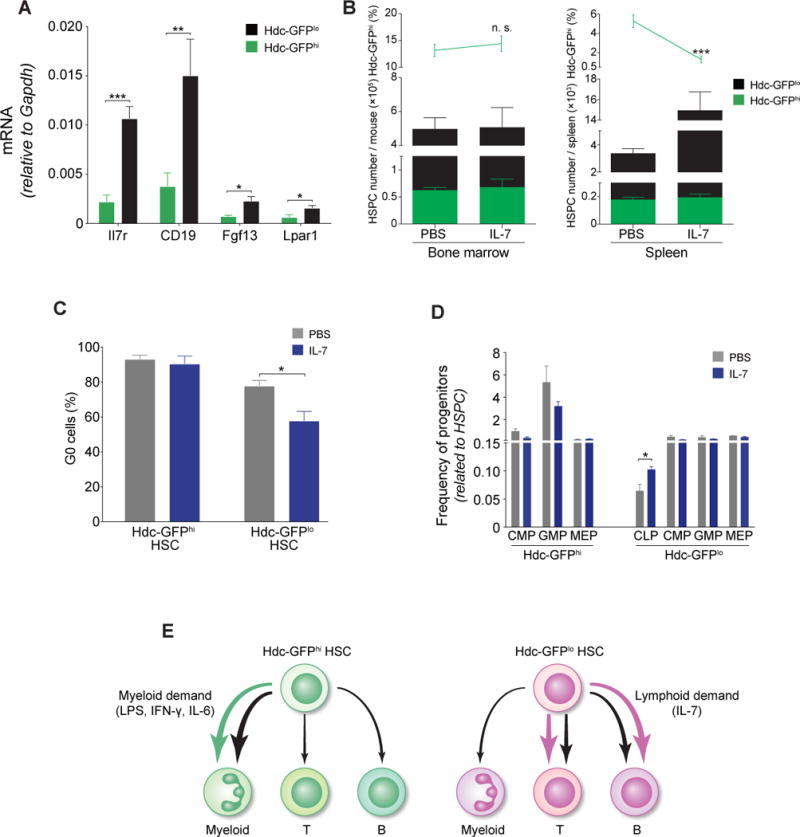
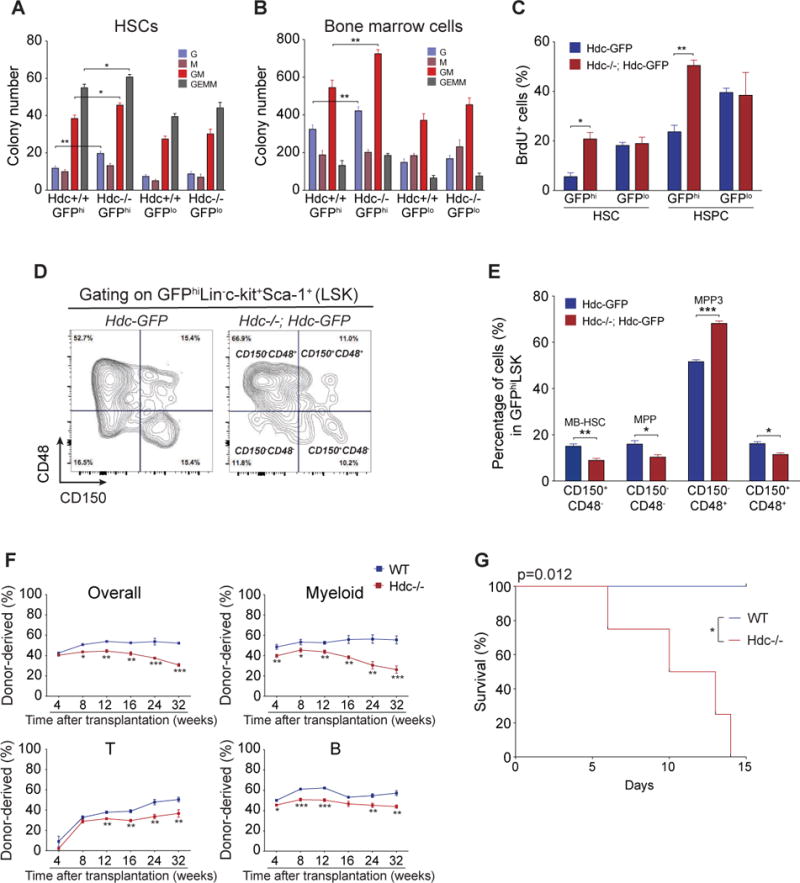
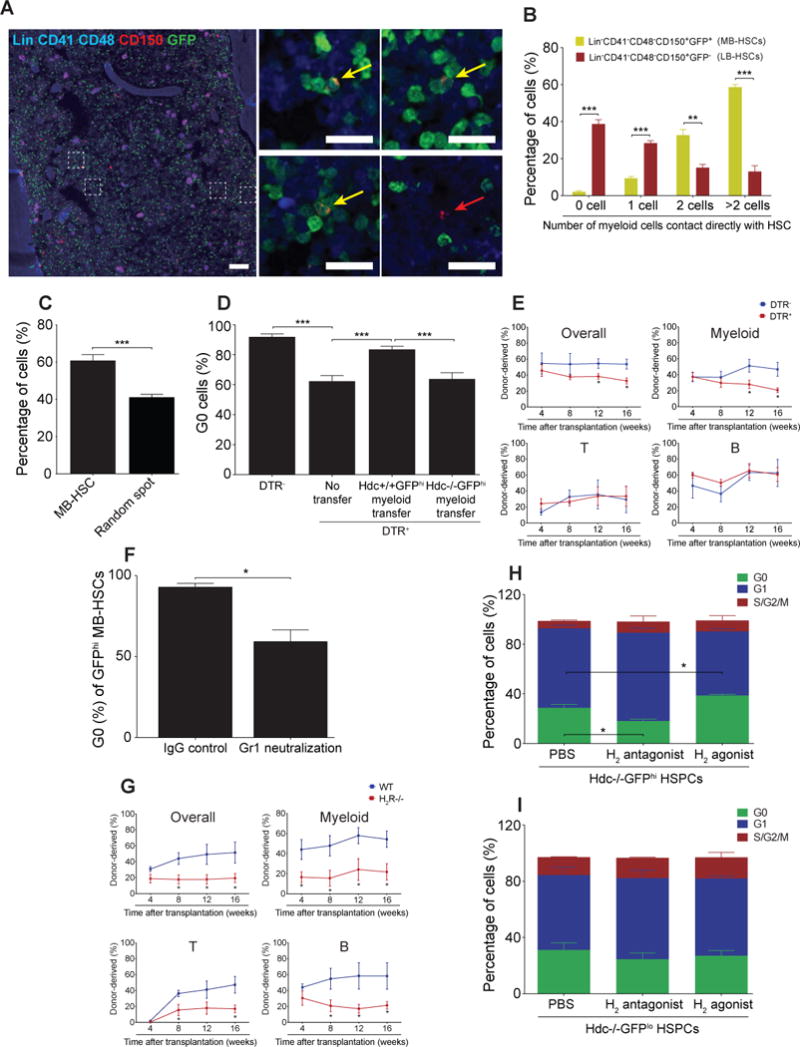
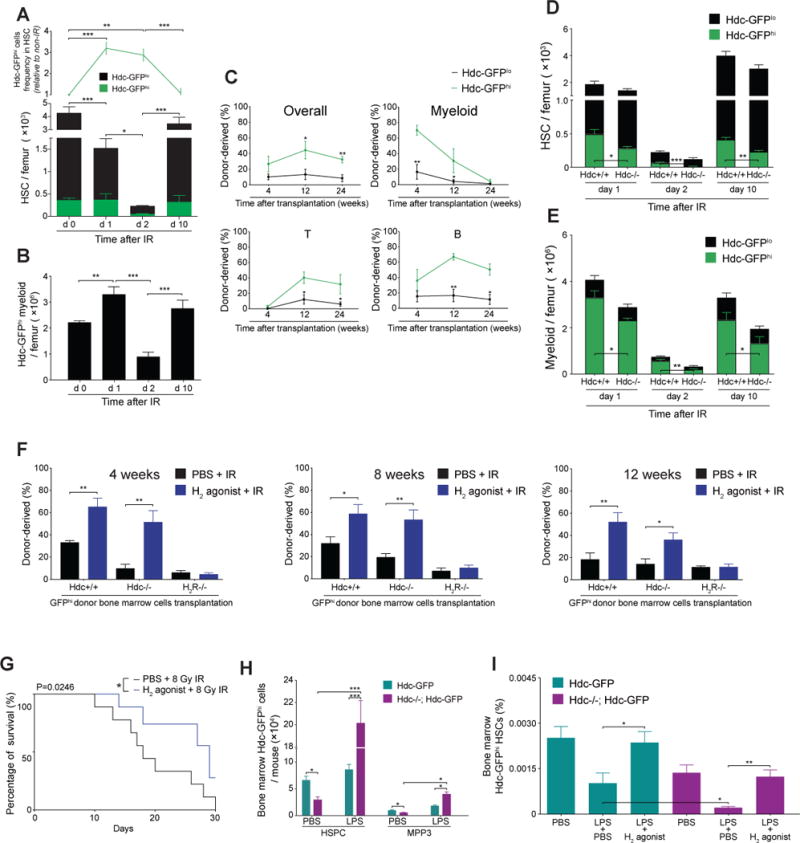
Myeloid-biased hematopoietic stem cells (MB-HSCs) play critical roles in recovery from injury, but little is known about how they are regulated within the bone marrow niche. Here we describe an auto-/paracrine physiologic circuit that controls quiescence of MB-HSCs and hematopoietic progenitors marked by histidine decarboxylase (Hdc). Committed Hdc+ myeloid cells lie in close anatomical proximity to MB-HSCs and produce histamine, which activates the H2 receptor on MB-HSCs to promote their quiescence and self-renewal. Depleting histamine-producing cells enforces cell cycle entry, induces loss of serial transplant capacity, and sensitizes animals to chemotherapeutic injury. Increasing demand for myeloid cells via lipopolysaccharide (LPS) treatment specifically recruits MB-HSCs and progenitors into the cell cycle; cycling MB-HSCs fail to revert into quiescence in the absence of histamine feedback, leading to their depletion, while an H2 agonist protects MB-HSCs from depletion after sepsis. Thus, histamine couples lineage-specific physiological demands to intrinsically primed MB-HSCs to enforce homeostasis.

Keywords: H2 receptor; bone marrow niche; hematopoietic stem cells; histamine; histidine decarboxylase; myeloid biased; quiescence; self-renewal.


Figures

Figure 1
Figure 1. Hdc Expression Identifies MB-HSC
(A) Percentage of Hdc-GFPhi cells in lineages of bone marrow (BM) cells (n = 3 - 7 per group). Six independent experiments. (B) mRNA expression of Hdc gene in BM cells and stromal cells (n = 3 - 5). (C) Quantification of Hdc-GFPhi HSCs in Hdc-GFP and WT mice (n = 3 per group). (D) Hdc mRNA expression in Hdc-GFPhi and Hdc-GFPlo BM HSCs and HSPCs (n = 3 per group). (E) Contribution of Hdc-GFPhi HSCs (n = 12) to lethally irradiated recipients. (F) Blood myeloid/lymphoid ratio of recipients in (E). (G-J) Relative mRNA expression of myeloid (G) and lymphoid lineage (H), cell cycle (I), and quiescence signatures genes (J) in HSCs (n = 3 - 4 per group). Data were analyzed with one-way analysis of variation (ANOVA) with Bonferroni post-hoc test (A and B) or two-tailed Student’s t-test (C-J). See also Figure S1-S3.
Figure 2
Figure 2. Myeloid Stimuli Activates Hdc-GFPhi MB-HSC
(A) TLR4 mRNA in HSCs (n = 3 - 4) and myeloid cells (n = 5). (B) TLRs expression from gene microarray analysis in myeloid cells (n = 3 per group). (C) Quantification of HSCs, HSPCs, and myeloid cells at 24 hours after LPS treatment (n = 5). (D) Myeloid cells (Gr1+) and progenitors (c-kit+) in spleen from LPS (n = 4) or PBS (n = 3)-treated Hdc-GFP mice. Four independent experiments. (E and F) Cell cycle analysis of BM HSCs at 6 hours after PBS (n = 3) or LPS (n = 3) treatment. (G) Absolute numbers of HSC in BM of Hdc-GFP mice treated with PBS, IFN-γ, or IL6 (n = 5 per group). Data were analyzed with two-tailed Student’s t-test (A, F, and G) or one-way analysis of variation (ANOVA) with Bonferroni post-hoc test (C). See also Figure S3.
Figure 3
Figure 3. Hdc-GFPhi MB-HSCs Are Not Responsive to IL-7
(A) Relative mRNA expression of IL-7/IL7-R pathway genes in HSPCs (n = 4 per group). (B) Quantification of Hdc-GFPhi HSPCs in IL-7 or PBS-treated mice (n = 3 per group). (C) Percentage of G0 HSCs (n = 3 per group). (D) Frequencies of progenitors in IL-7 or PBS-treated Hdc-GFP mice (n = 5 per group). (E) Schematic depiction of the relative lineage bias of Hdc-GFPhi HSCs or Hdc-GFPlo HSCs. Data were analyzed with two-tailed Student’s t-test (A-D). See also Figure S3.
Figure 4
Figure 4. Hdc Deficiency Leads to MB-HSC Activation
(A and B) Absolute number of myeloid CFU from 150 BM HSCs (A) and 1 × 10⁵ BM cells (B) (n = 3 per group). Three independent experiments. (C) BrdU incorporation of HSCs and HSPCs (n = 5 per group). (D and E) Hdc deficiency (Hdc−/−) increased HSC and myeloid lineage progenitors. (F) Competitive transplantation assays of 2 × 10⁵ unfractionated BM cells from Hdc−/− (n = 12) or WT mice (n = 10). (G) Kaplan-Meier curve depicting survival rates of Hdc−/− (n = 6) and WT mice (n = 5) after 5-FU treatment. Data were analyzed with two-tailed Student’s t-test (A-C, E, and F) or Logrank test (G). See also Figure S4.
Figure 5
Figure 5. Histamine-producing Myeloid Cells Maintain MB-HSCs
(A and B) Spatial relationship between MB-HSC (a to c, yellow arrow, n = 198) or LB-HSC (d, red arrow, n = 321) and Hdc-GFP+ myeloid cells. (C) Percentages of MB-HSCs (n = 541) and random spots (n = 2480) that contacted directly with ≥ 2 Hdc-GFP+ myeloid cells. (D) G0 BM HSCs in Hdc-CreERT2; tdTomato; iDTR (n = 6) and Hdc-CreERT2; tdTomato mice (n = 6) as depicted in Figure S5E. Cell cycle rescue was performed by GFPhiCD11b+Gr1+ cells transfer (n = 8). Hdc−/−; Hdc-GFPhi myeloid cells were used as control (n = 6). (E) Percentage of donor-derived myeloid, T, and B cells in lethally irradiated recipients transplanted with unfractionated BM cells from Hdc-CreERT2; tdTomato; iDTR or control mice (n = 5 per group). (F) G0 Hdc-GFPhi MB-HSCs in Gr1 monoclonal antibody or rat IgG-treated mice (n = 3 per group). (G) Donor chimerism in recipients transplanted with 2 × 10⁵ WT or H2R−/− total BM cells along with the same number of CD45.1 BM cells (n = 10 per group). (H and I) Hdc-GFPhi HSPCs (n = 6) and Hdc-GFPlo HSPCs (n = 5) co-cultured with Hdc−/− stromal cells and H2 antagonist or agonist. Data were analyzed with Mann-Whitney test (B and C), one-way analysis of variation (ANOVA) with Bonferroni post-hoc test (D, H, and I), or two-tailed Student’s t-test (E-G). See also Figure S5.
Figure 6
Figure 6. Myeloid-derived Histamine Protects MB-HSCs from Myelosuppressive Injury
(A) Quantification of Hdc-GFPhi HSCs in irradiated Hdc-GFP mice (n = 4 - 6 per time point). (B) Number of BM Hdc-GFP+ myeloid cells in (A). (C) Competitive reconstitution comparison between 3 Gy-irradiated 1,500 Hdc-GFPhi and Hdc-GFPlo HSPCs (n = 5 per group). (D and E) Number of total HSCs (D) or myeloid cells (E) in 5 Gy-irradiated Hdc-GFP (n = 4) and Hdc−/−; Hdc-GFP mice (n = 6). (F) Blood chimerism of lethally irradiated recipients transplanted with 5 × 10⁵ unfractionated Hdc-GFP+ donor BM cells along with Sca-1-depleted CD45.1 BM cells (n = 5 each treatment). (G) Survival of 8Gy- irradiated mice pre-treated with either H2 agonist or PBS (n = 15 per group). (H) Absolute number of BM Hdc-GFPhi HSPCs and MPP (MPP3) in LPS or PBS-treated mice at 24 hours (n = 3 - 6 per group). (I) Protective effect of H2 agonist on LPS-induced sepsis mice (n = 5 per group). Data were analyzed with one-way analysis of variation (ANOVA) with Bonferroni post-hoc test (A, B, and I), two-tailed Student’s t-test (C-E, F, and H), or Logrank test (G). See also Figure S6. For all panels, ± SEM is shown. *p < 0.05; **p < 0.01; ***p < 0.001. n.s., not significant. n.d., not detectable. n indicates biological replicates. For all experiments greater than or equal to two independent experiments were performed unless otherwise indicated.

Comment in

References

    1. Alcaniz L, Vega A, Chacon P, El Bekay R, Ventura I, Aroca R, Blanca M, Bergstralh DT, Monteseirin J. Histamine production by human neutrophils. FASEB J. 2013;27:2902–2910. - PubMed
    1. Ardi VC, Kupriyanova TA, Deryugina EI, Quigley JP. Human neutrophils uniquely release TIMP-free MMP-9 to provide a potent catalytic stimulator of angiogenesis. Proc Natl Acad Sci U S A. 2007;104:20262–20267. - PMC - PubMed
    1. Beerman I, Maloney WJ, Weissmann IL, Rossi DJ. Stem cells and the aging hematopoietic system. Current opinion in immunology. 2010;22:500–506. - PMC - PubMed
    1. Benjamini Y, Hochberg Y. Controlling the false discovery rate; A practical and powerful approach to multiple testing. J Roy Stat Soc Ser B. 1995;57:289–300.
    1. Broxmeyer HE, Hoggatt J, O’Leary HA, Mantel C, Chitteti BR, Cooper S, Messina-Graham S, Hangoc G, Farag S, Rohrabaugh SL, et al. Dipeptidylpeptidase 4 negatively regulates colony-stimulating factor activity and stress hematopoiesis. Nat Med. 2012;18:1786–1796. - PMC - PubMed