. 2018 Jan 4;22(1):104-118.e6.
doi: 10.1016/j.stem.2017.10.005. Epub 2017 Nov 30.

Hypoxic Induction of Vasorin Regulates Notch1 Turnover to Maintain Glioma Stem-like Cells

Affiliations

Hypoxic Induction of Vasorin Regulates Notch1 Turnover to Maintain Glioma Stem-like Cells

Jianghong Man et al. Cell Stem Cell. .

Abstract

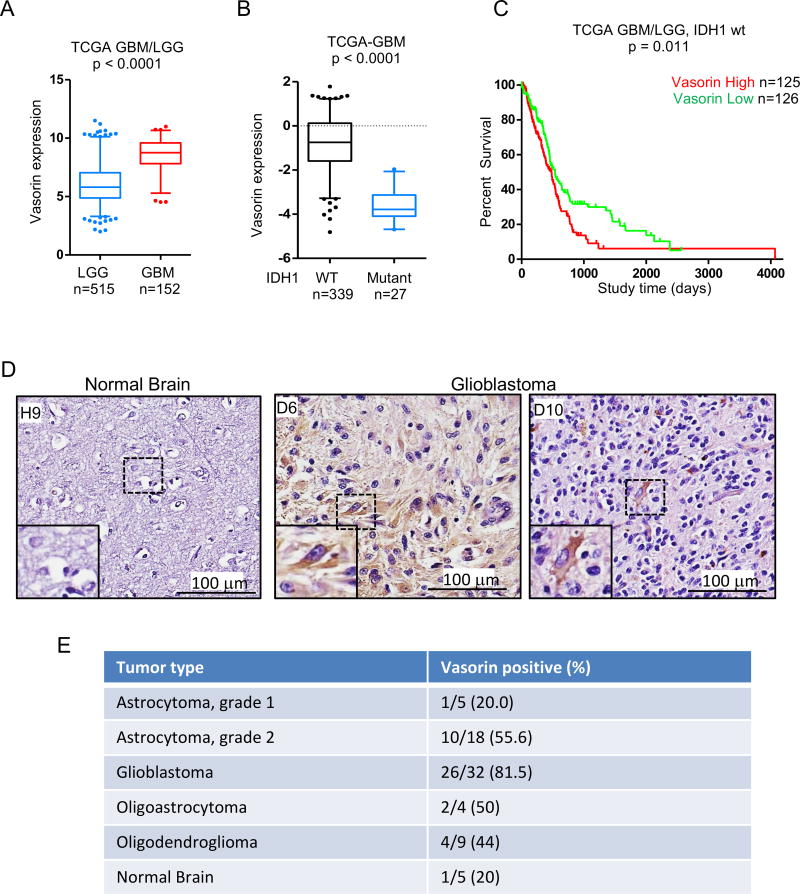
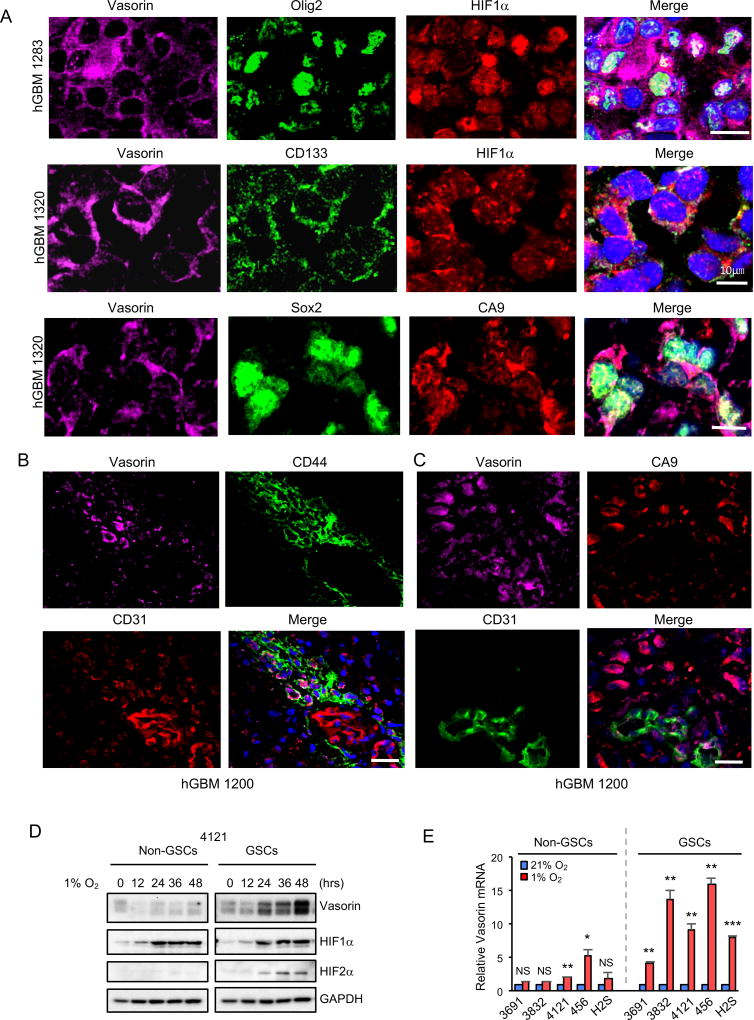
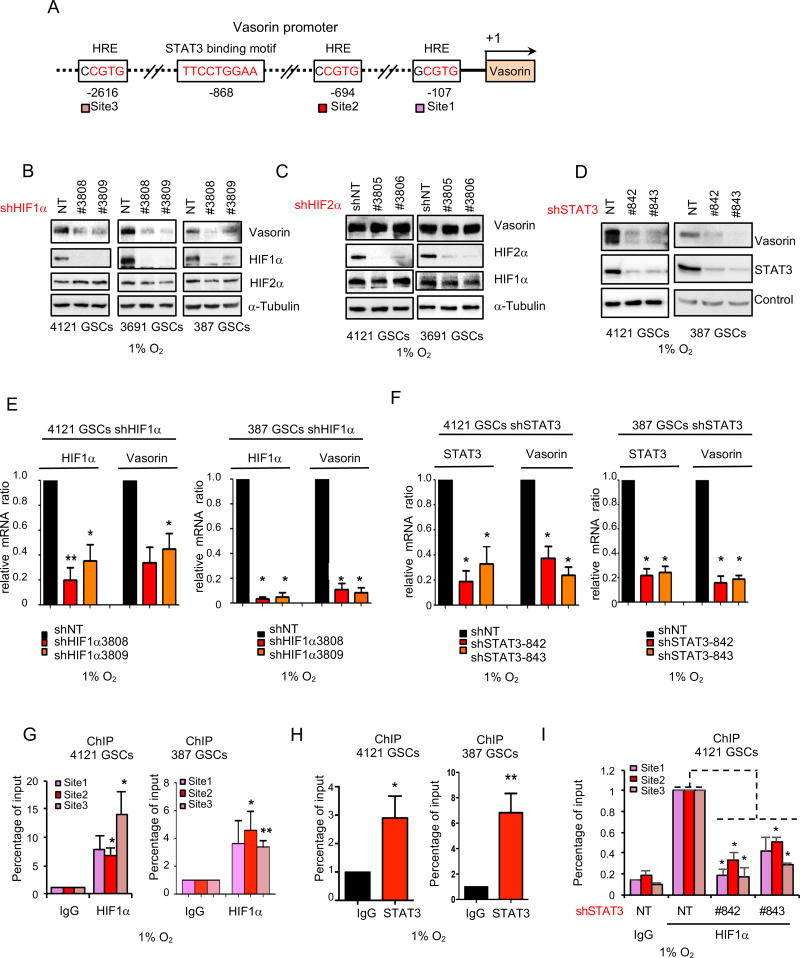
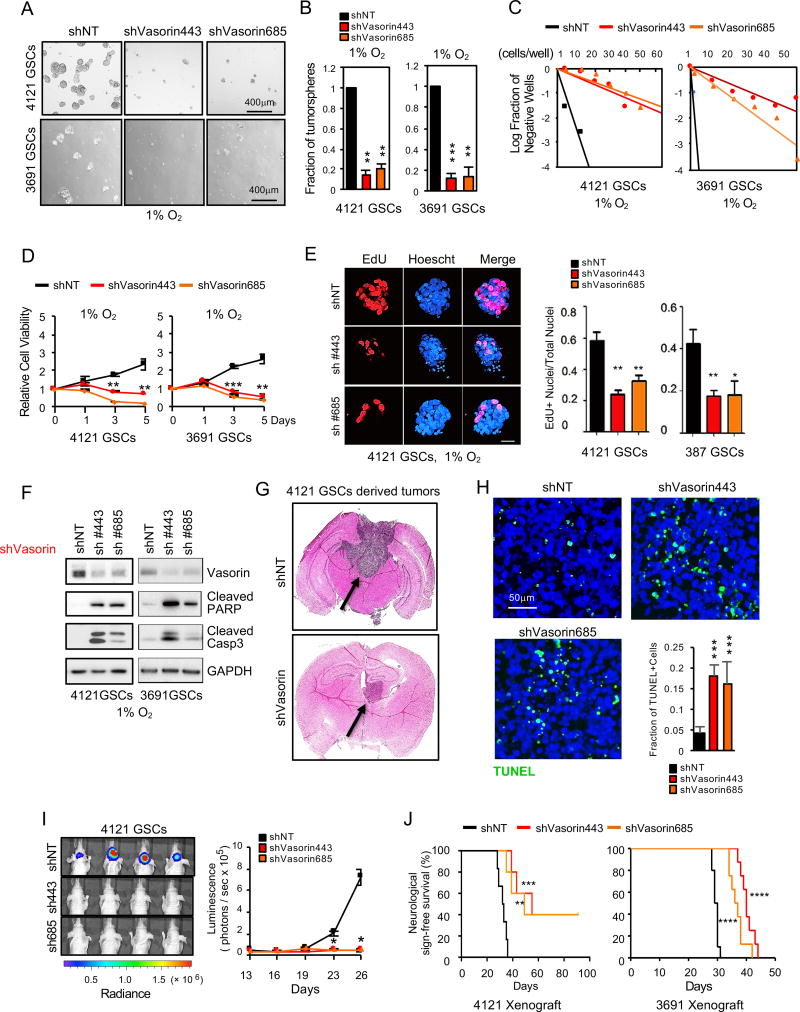
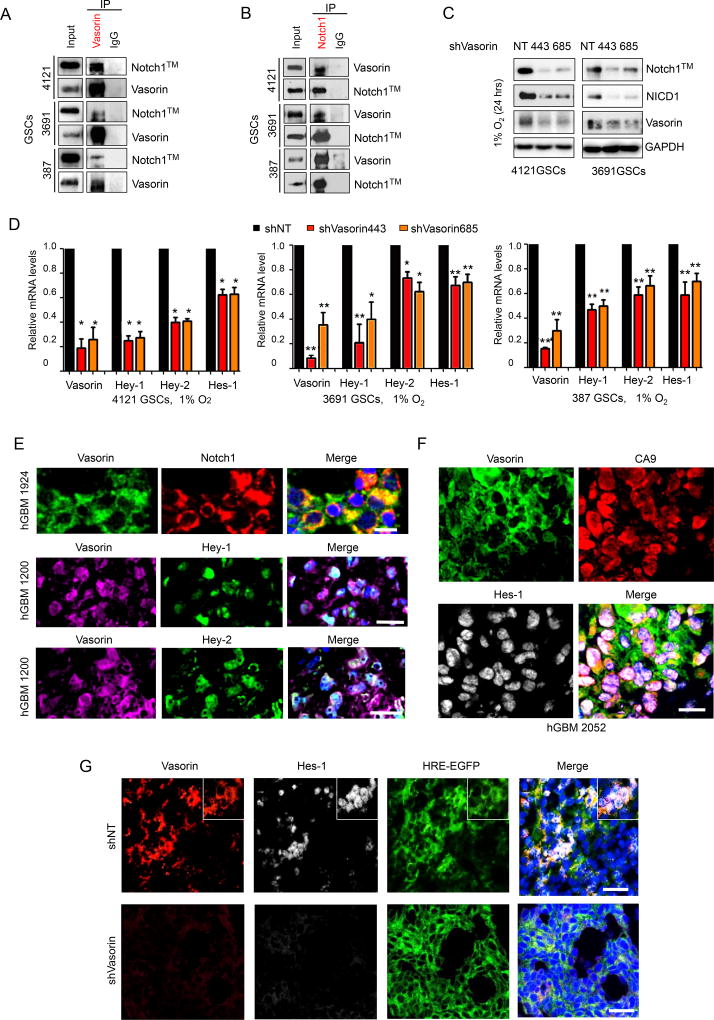
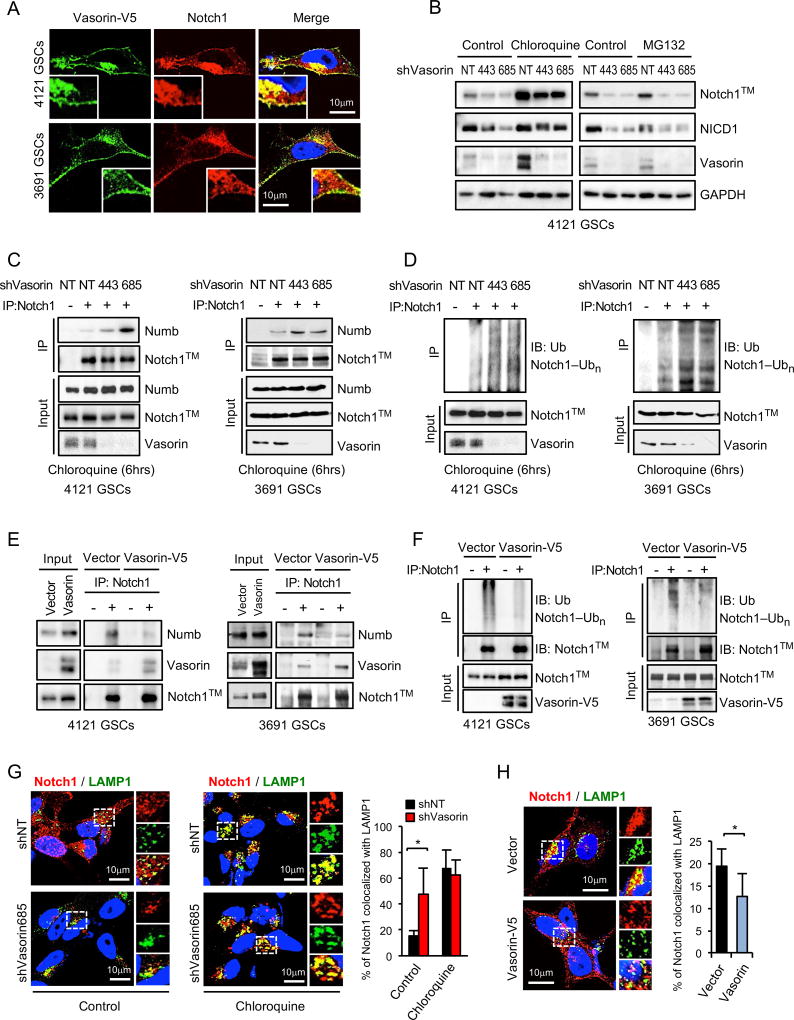
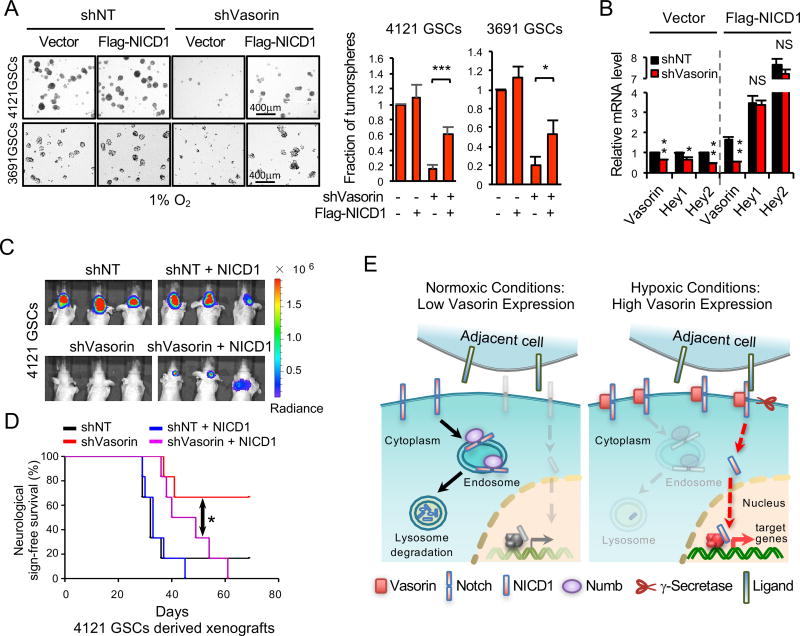
Tumor hypoxia is associated with poor patient survival and is a characteristic of glioblastoma. Notch signaling is implicated in maintaining glioma stem-like cells (GSCs) within the hypoxic niche, although the molecular mechanisms linking hypoxia to Notch activation have not been clearly delineated. Here we show that Vasorin is a critical link between hypoxia and Notch signaling in GSCs. Vasorin is preferentially induced in GSCs by a HIF1α/STAT3 co-activator complex and stabilizes Notch1 protein at the cell membrane. This interaction prevents Numb from binding Notch1, rescuing it from Numb-mediated lysosomal degradation. Thus, Vasorin acts as a switch to augment Notch signaling under hypoxic conditions. Vasorin promotes tumor growth and reduces survival in mouse models of glioblastoma, and its expression correlates with increased aggression of human gliomas. These findings provide mechanistic insights into how hypoxia promotes Notch signaling in glioma and identify Vasorin as a potential therapeutic target.

Keywords: HIF1; Notch; Numb; STAT3; Vasorin; glioblastoma; glioma; glioma stem-like cells; hypoxia; pseudohypoxia.


Figures

Figure 1
Figure 1. Vasorin Is Expressed in Aggressive Gliomas
(A) Boxplot of Vasorin expression in low grade gliomas (LGG) and glioblastoma (GBM) from the TCGA diffuse glioma database. Significance testing by Mann-Whitney U test. (B) Boxplot of Vasorin expression in IDH1 wild-type (WT) and IDH1 mutant glioblastomas from the TCGA GBM database. Significance testing by Mann-Whitney U test. (C) Kaplan-Meier survival analysis of patients with IDH1 wt gliomas stratified by Vasorin expression. Median Vasorin expression was used for stratification into Vasorin high and Vasorin low tumors. (D) Immunohistochemical staining of Vasorin in normal brain and GBM. Representative images are shown. (E) Table of tumor type and Vasorin expression in gliomas and normal brain. The fraction and percent of Vasorin positive tumors or normal brain are shown.
Figure 2
Figure 2. Vasorin is Induced by Hypoxia in Glioma Stem-like Cells
(A) Immunofluorescent (IF) staining of Vasorin (purple), putative stem cell marker (Olig2, CD133, or Sox2; green) and hypoxia marker (HIF1α or CA9; red) in human GBM. Nuclei were counterstained with DAPI (blue). Representative images are shown. Scale bar measures 10µm. (B) IF staining of Vasorin (purple), CD44 (green) and endothelial marker CD31 (red) in human GBM. Nuclei were counterstained with DAPI (blue). Representative images are shown. Scale bar measures 25µm. (C) IF staining of Vasorin (purple), CA9 (red) and CD31 (green) in human GBM. Nuclei were counterstained with DAPI (blue). Representative images are shown. Scale bar measures 25µm. (D) Matched non-GSCs and GSCs (line 4121) were cultured in standard conditions or hypoxia (1% O2) for the indicated amount of time. Expression of Vasorin and HIF proteins was assessed by immunoblot. (E) Five matched non-GSC and GSC pairs were cultured in standard conditions or hypoxia (1% O2) for 24 hrs. Vasorin mRNA expression was analyzed by qRT-PCR. * p < 0.05; ** p < 0.01; *** p<0.001; NS, not significant Data are represented as mean ± SD. See also Figure S1–S2.
Figure 3
Figure 3. A HIF1α/STAT3 Co-Activator Complex Induces Expression of Vasorin in GSCs
(A) Cartoon of Vasorin promoter with 3 putative hypoxia response elements (HRE) and 1 STAT3 binding site. (B–D) Immunblot (IB) of Vasorin in GSCs transduced with two different shRNA sequences targeting HIF1α (B), HIF2α (C) or STAT3 (D). GSCs were cultured in hypoxia (1% O2) for 48 hrs. (E) qRT-PCR of HIF1α and Vasorin in GSCs transduced with shNT or shHIF1α and cultured in hypoxia for 48 hrs. (F) qRT-PCR of STAT3 and Vasorin in GSCs transduced with shNT or shSTAT3 and cultured in hypoxia for 48 hrs. (G–H) Chromatin IP (ChIP) analyses on the promoter of Vasorin. Assays were performed with the indicated antibodies and immunoprecipitates were subjected to qPCR analyses using primers flanking the HRE sites (G) or STAT3 binding motif (H). GSCs were cultured in hypoxia for 48 hrs. (I) ChIP of HIF1α binding to the Vasorin promoter in GSCs cultured under hypoxia after STAT3 knockdown. *p < 0.05; **p < 0.01, *** p < 0.001. Data are represented as mean ± SD. See also Figure S3.
Figure 4
Figure 4. Vasorin Promotes GSC Maintenance and Tumorigenesis
(A) GSCs (4121 and 3691) were transduced with two different shVasorin sequences and cultured in hypoxia (1% O2) for 5 days and tumorsphere formation was assessed by bright field microscopy. (B) Quantification of tumorspheres in 2 different GSC lines (4121 and 3691) in hypoxia after Vasorin knockdown. (C) In vitro limiting dilution assay of GSCs expressing shNT or shVasorin cultured in hypoxia. (D) Cell viability of GSC lines 4121 and 3691 after Vasorin knockdown and cultured in hypoxia. (E) IF imaging (left) of EdU incorporation in GSC tumorspheres cultured under hypoxic conditions for 48 hrs. Quantification of the fraction of EdU+ cells (right). (F) IB analysis of cleaved caspase3 and cleaved PARP proteins in GSCs with Vasorin knockdown cultured under hypoxic conditions. (G–J) GSCs stably expressing luciferase were transduced with shNT or shVasorin through lentiviral infection and intracranially transplanted into the brains of nude mice (2×10⁴ cells per mouse). (G) Representative images of cross-sections (hematoxylin and eosin stained) of mouse brains 26 days after transplantation. (H) Apoptotic cells in GBM xenografts derived from GSCs expressing shNT or shVasorin were detected in situ using the TUNEL assay. Nuclei were counterstained with DAPI (blue). The apoptotic index was assessed by the ratio of TUNEL-positive cells / total number of cells from eight randomly selected fields. (I) GBM xenografts derived from luciferase-labeled GSCs expressing shNT or shVasorin were tracked by bioluminescence (right). Real-time images from animals on day 26 are shown (left). Error bars represent the mean ± SEM. (J) Kaplan-Meier survival curve of mice implanted with 4121 GSCs (n=6 for each group) or 3691 GSCs (n=8 for each group) expressing shNT or shVasorin. Significance testing by log rank test. *p < 0.05; **p < 0.01; ***p < 0.001, ****p<0.0001 Data are represented as mean ± SD unless otherwise stated. See also Figure S4.
Figure 5
Figure 5. Vasorin Binds to Membranous Notch1 to Facilitate Notch Signaling
(A–B) Co-immunoprecipitation (Co-IP) of Vasorin (A) or Notch1 (B) in 3 different GSC lines (387, 3691 and 4121) and blotted for Notch1™ and Vasorin. IgG was used as a control antibody for IPs. (C) IB of Notch1™, NICD1 and Vasorin in GSCs transduced with shNT or shVasorin and cultured in 1% O2 for 24 hours. (D) qRT-PCR of Notch target genes in GSCs (4121) transduced with shNT or shVasorin. (E) Top: IF staining of Vasorin (green) and Notch1 (red) in human GBM. Scale bar measures 20µm. Middle: IF staining of Vasorin (purple) and Hey-1 (green) in human GBM. Scale bar measures 50µm. Bottom: IF staining of Vasorin (purple) and Hey-2 (green) in human GBM. Scale bar measures 50µm. Nuclei were counterstained with DAPI (blue). (F) IF staining of Vasorin (green), CA9 (red) and Hes-1 (gray) in human GBM. Nuclei were counterstained with DAPI (blue). Scale bar measures 50µm. (G) IF staining of Vasorin (red), Hes-1 (gray) in GBM xenografts derived from GSCs expressing HRE-EGFP and shNT or shVasorin. Nuclei were counterstained with DAPI (blue). Scale bar measures 50µm. *p < 0.05, **p < 0.01 Data are represented as mean ± SD. See also Table S1 and Figure S5.
Figure 6
Figure 6. Vasorin Reduces Notch1 Lysosomal Degradation
(A) Co-IF staining of Vasorin (green) and Notch1 (red) in GSCs with stable expression of Vasorin-V5. (B) IB analysis of Notch1 and Vasorin in GSCs transduced with shNT or shVasorin, then treated with chloroquine or MG132. (C–D) GSCs (4121 and 3691) were transduced with shNT or shVasorin and treated with chloroquine for 6 hours before harvest. (C) Cell lysates were immunoprecipitated (IP) with anti-Notch1 antibody and the co-precipitated proteins were analyzed by IB with the indicated antibodies. IgG was used as a control antibody for IPs. (D) Cell lysates were immunoprecipitated with an anti-Notch1 antibody and then immunoblotted with anti-Ubiquitin (Ub) or anti-Notch1 antibody. (E–F) GSCs (4121 and 3691) were stably transduced with control vector or Vasorin-V5. (E) Co-IP assay was performed as described in (C). IgG was used as a control antibody for IPs. (F) Ubiquitylation of Notch1™ in GSCs overexpressing Vasorin-V5 was performed as described in (D). (G) Co-IF staining of Notch1 (red) and lysosomal marker LAMP1 (green) in GSCs transduced with shNT or shVasorin and then treated with control chloroquine for 6 hours (left). Quantification of the percentage of Notch1 co-localized with LAMP1 (right). (H) Co-IF staining of Notch1 (red) and LAMP1 (green) in GSCs stably expressing control vector or Vasorin-V5 (left). Quantification of the percentage of Notch1 co-localized with LAMP1 (right). The co-localized pixels were assessed by ImageJ. *p < 0.05 Data are represented as mean ± SD. See also Figure S6.
Figure 7
Figure 7. Regulation of Notch Signaling by Vasorin
(A) Tumorsphere formation from GSCs (4121 and 3691) transduced with Flag-NICD1 in the setting of reduced Vasorin. GSCs were cultured under hypoxic conditions (1% O2). Quantification of tumorspheres (right). (B) qRT-PCR of Vasorin and Notch target genes in GSCs expressing Flag-NICD1 or vector control in the background of shNT or shVasorin knockdown. (C) Bioluminescence imaging of GBM xenografts derived from GSCs expressing luciferase and either shNT or shVasorin in combination with vector control or Flag-NICD1. Images from animals on day 26 after GSC intracranial transplantation are shown. (D) Kaplan-Meier survival curves of mice implanted with GSCs (4121) treated as described in (C). Significance testing by log rank test. (E) Model of membranous Notch1 regulation by Vasorin. Under normoxic conditions, Vasorin expression is low. Numb binds Notch1™ to facilitate its degradation by the lysosome. Under hypoxic conditions, Vasorin expression is high. Vasorin binds to and stabilizes membranous Notch1 to permit ligand binding, followed by proteolytic cleavage to release the NICD1 and transactivate Notch target genes. *p < 0.05; **p < 0.01; ***p < 0.001 Data are represented as mean ± SD. See also Figure S7.

Comment in

References

    1. Andersson ER, Lendahl U. Therapeutic modulation of Notch signalling--are we there yet? Nature reviews Drug discovery. 2014;13:357–378. - PubMed
    1. Bao S, Wu Q, McLendon RE, Hao Y, Shi Q, Hjelmeland AB, Dewhirst MW, Bigner DD, Rich JN. Glioma stem cells promote radioresistance by preferential activation of the DNA damage response. Nature. 2006;444:756–760. - PubMed
    1. Bar EE, Lin A, Mahairaki V, Matsui W, Eberhart CG. Hypoxia increases the expression of stem-cell markers and promotes clonogenicity in glioblastoma neurospheres. The American journal of pathology. 2010;177:1491–1502. - PMC - PubMed
    1. Bleau AM, Hambardzumyan D, Ozawa T, Fomchenko EI, Huse JT, Brennan CW, Holland EC. PTEN/PI3K/Akt pathway regulates the side population phenotype and ABCG2 activity in glioma tumor stem-like cells. Cell stem cell. 2009;4:226–235. - PMC - PubMed
    1. Bowman RL, Wang Q, Carro A, Verhaak RG, Squatrito M. GioVis data protal for visualization and analysis of brain tumor expression datasets. Neuro-oncology. 2017;19:139–141. - PMC - PubMed

Publication types

MeSH terms