. 2017 Dec 7;21(6):725-729.e4.
doi: 10.1016/j.stem.2017.11.002. Epub 2017 Nov 30.

Dye-Independent Methods Reveal Elevated Mitochondrial Mass in Hematopoietic Stem Cells

Affiliations

Dye-Independent Methods Reveal Elevated Mitochondrial Mass in Hematopoietic Stem Cells

Mariana Justino de Almeida et al. Cell Stem Cell. .

Abstract

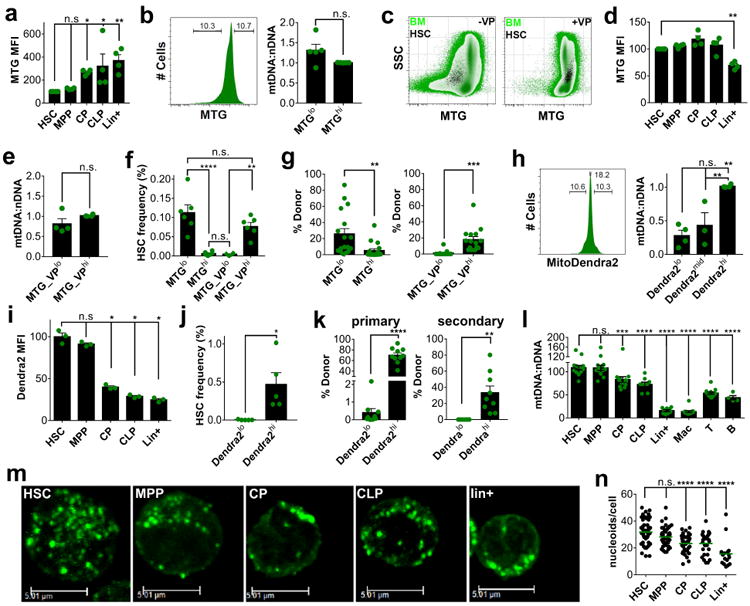
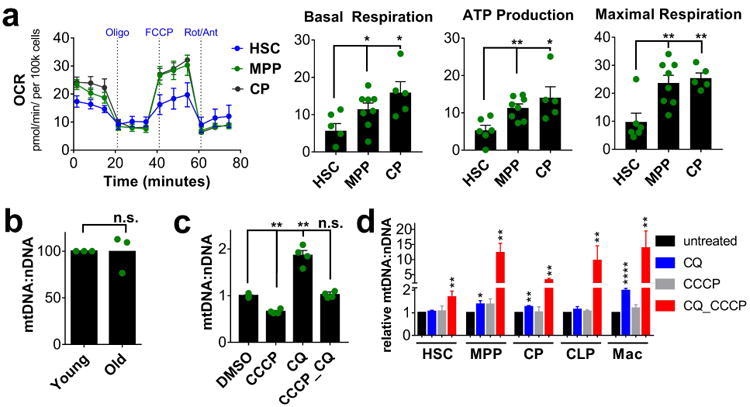
Hematopoietic stem cells (HSCs) produce most cellular energy through glycolysis rather than through mitochondrial respiration. Consistent with this notion, mitochondrial mass has been reported to be low in HSCs. However, we found that staining with MitoTracker Green, a commonly used dye to measure mitochondrial content, leads to artefactually low fluorescence specifically in HSCs because of dye efflux. Using mtDNA quantification, enumeration of mitochondrial nucleoids, and fluorescence intensity of a genetically encoded mitochondrial reporter, we unequivocally show here that HSCs and multipotential progenitors (MPPs) have higher mitochondrial mass than lineage-committed progenitors and mature cells. Despite similar mitochondrial mass, respiratory capacity of MPPs exceeds that of HSCs. Furthermore, although elevated mitophagy has been invoked to explain low mitochondrial mass in HSCs, we observed that mitochondrial turnover capacity is comparatively low in HSCs. We propose that the role of mitochondria in HSC biology may have to be revisited in light of these findings.

Keywords: efflux; hematopoiesis; hematopoietic stem cells; mitochondria; mitochondrial respiration; mitochondrial turnover; mitotracker.


Figures

Figure 1
Figure 1. High mitochondrial mass in HSCs
a. MTG MFI of mouse BM hematopoietic populations normalized to HSCs (mean ± s.e.m., n=4). b. Fluorescence histogram (left) of mouse BM stained with MTG and relative mtDNA:nDNA ratio (right) within the 10% MTGlo and MTGhi fractions normalized to MTGhi cells (mean ± s.e.m., n=5). c. Flow cytometric profile of mouse BM (green) and HSCs (black) stained with MTG in the absence (left) or presence (right) of VP. d. MTG MFI of mouse BM hematopoietic populations in the presence of VP normalized to HSCs (mean ± s.e.m., n=4). e. Relative mtDNA:nDNA ratio within the 10% MTG_VPlo and MTG_VPhi BM fractions stained in the presence of VP, normalized to MTGhi (mean ± s.e.m., n=4). f. HSC frequency within the 10% MTGlo and MTGhi mouse BM fractions stained with MTG in the absence or presence of VP (mean ± s.e.m., n=6). g. Donor contribution of BM MTGlo and MTGhi fractions stained in the absence (left) or presence (right) of VP in the PB of recipients 16 weeks after competitive transplantation (mean ± s.e.m., n>15 recipients pooled from three independent transplants). h. Fluorescence histogram of BM (left) from mitoDendra2 mice and relative mtDNA:nDNA ratio (right) within the 10% Dendra2lo, Dendra2mid and Dendra2hi fractions normalized to Dendra2hi (mean ± s.e.m., n>3). i. Dendra2 MFI of BM populations of mitoDendra2 mice normalized to HSCs (mean ± s.e.m., n=3). j. HSC frequency within the 10% Dendra2lo and Dendra2hi BM fractions of mitoDendra2 mice (mean ± s.e.m., n=5). k. Donor contribution of BM Dendra2lo and Dendra2hi fractions in the PB of recipients 16 weeks after competitive transplantation (left) or serial transplantation (right) (mean ± s.e.m, n≥9 recipients pooled from two independent transplants). l. Relative mtDNA:nDNA ratio in mouse BM hematopoietic populations (mean ± s.e.m., n≥4) normalized to HSCs. m. Representative images of mitochondrial nucleoids visualized with immunostaining for Tfam in mouse BM hematopoietic populations (scale bar, 5.01μM). n. Quantification of mitochondrial nucleoids (mean, n≥17 cells pooled from three independent experiments, scale bar 5.01μm). *p<0.05, **p<0.01, ***p<0.001, ****p<0.0001, n.s.- not significant. See also Figures S1 and S2.
Figure 2
Figure 2. Metabolism and mitochondrial turnover
a. Real time analysis (left) of mitochondrial oxygen consumption (OCR) during mitochondrial stress test and quantitative analysis (right) of basal respiration, ATP production and maximal respiration in HSCs (LSKCD48-), MPPs (LSKCD48+) and CPs (mean ± s.e.m., n=5). b. Relative mtDNA:nDNA ratio in HSCs from young and old mice normalized to young (mean ± s.e.m., n=3) c. Effect of mitophagy inducer CCCP and autophagy inhibitor CQ on the relative mtDNA:nDNA ratio of 3T3 and d. hematopoietic populations normalized to untreated (mean ± s.e.m., n˃3). *p<0.05, **p<0.01, ***p<0.001, ****p<0.0001, n.s.- not significant.

References

    1. Anso E, Weinberg SE, Diebold LP, Thompson BJ, Malinge S, Schumacker PT, Liu X, Zhang Y, Shao Z, Steadman M, et al. The mitochondrial respiratory chain is essential for haematopoietic stem cell function. Nat Cell Biol. 2017;19:614–625. - PMC - PubMed
    1. Bejarano-Garcia JA, Millan-Ucles A, Rosado IV, Sanchez-Abarca LI, Caballero-Velazquez T, Duran-Galvan MJ, Perez-Simon JA, Piruat JI. Sensitivity of hematopoietic stem cells to mitochondrial dysfunction by SdhD gene deletion. Cell Death Dis. 2016;7:e2516. - PMC - PubMed
    1. Chen M, Sandoval H, Wang J. Selective mitochondrial autophagy during erythroid maturation. Autophagy. 2008;4:926–928. - PMC - PubMed
    1. Doulatov S, Notta F, Laurenti E, Dick JE. Hematopoiesis: a human perspective. Cell Stem Cell. 2012;10:120–136. - PubMed
    1. Goodell MA, Rosenzweig M, Kim H, Marks DF, DeMaria M, Paradis G, Grupp SA, Sieff CA, Mulligan RC, Johnson RP. Dye efflux studies suggest that hematopoietic stem cells expressing low or undetectable levels of CD34 antigen exist in multiple species. Nat Med. 1997;3:1337–1345. - PubMed

Substances