. 2018 Mar 1;12(2):026015.
doi: 10.1088/1752-7163/aa9eef.

Volatile fingerprinting of human respiratory viruses from cell culture

Affiliations

Volatile fingerprinting of human respiratory viruses from cell culture

Giorgia Purcaro et al. J Breath Res. .

Abstract

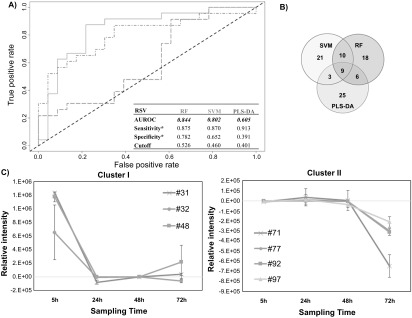
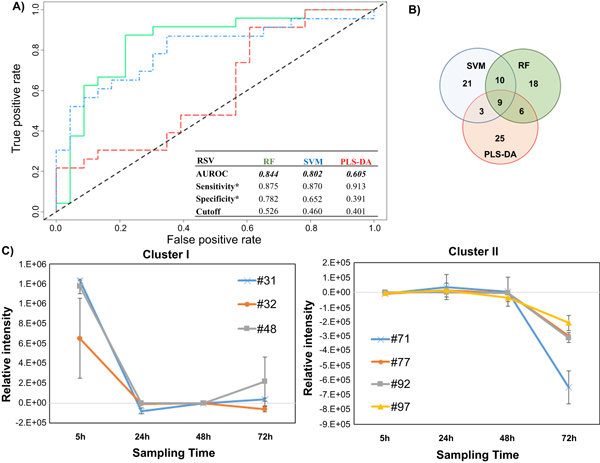
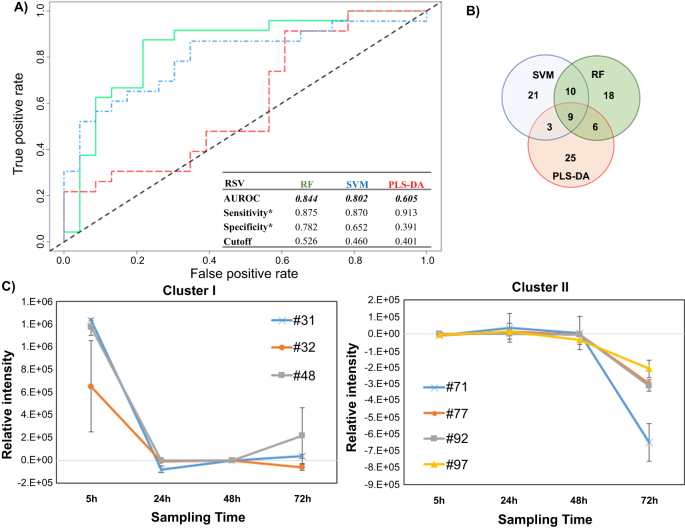
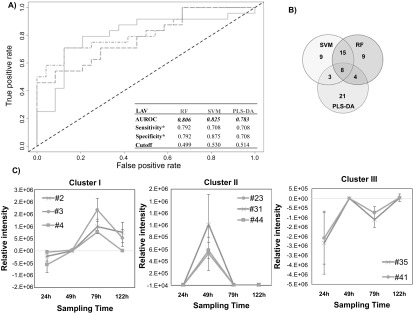
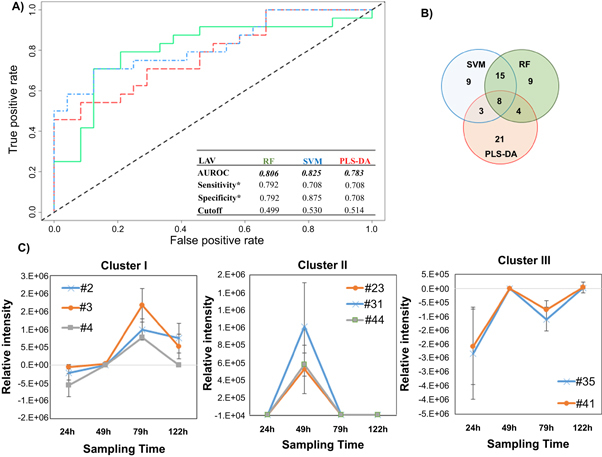
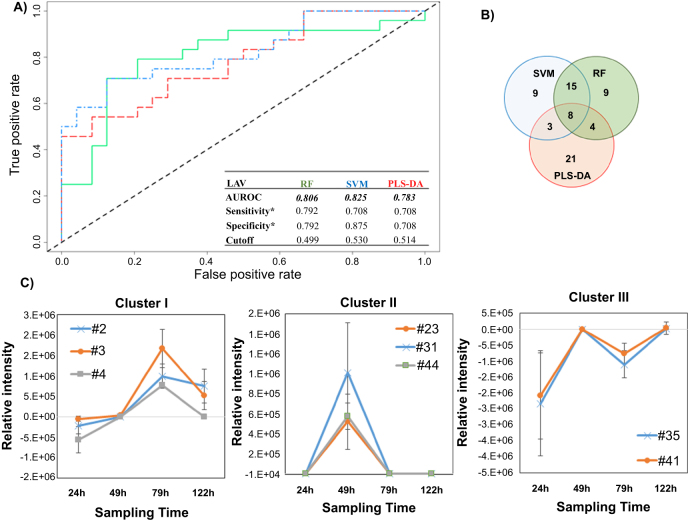
Volatile metabolites are currently under investigation as potential biomarkers for the detection and identification of pathogenic microorganisms, including bacteria, fungi, and viruses. Unlike bacteria and fungi, which produce distinct volatile metabolic signatures associated with innate differences in both primary and secondary metabolic processes, viruses are wholly reliant on the metabolic machinery of infected cells for replication and propagation. In the present study, the ability of volatile metabolites to discriminate between respiratory cells infected and uninfected with virus, in vitro, was investigated. Two important respiratory viruses, namely respiratory syncytial virus (RSV) and influenza A virus (IAV), were evaluated. Data were analyzed using three different machine learning algorithms (random forest (RF), linear support vector machines (linear SVM), and partial least squares-discriminant analysis (PLS-DA)), with volatile metabolites identified from a training set used to predict sample classifications in a validation set. The discriminatory performances of RF, linear SVM, and PLS-DA were comparable for the comparison of IAV-infected versus uninfected cells, with area under the receiver operating characteristic curves (AUROCs) between 0.78 and 0.82, while RF and linear SVM demonstrated superior performance in the classification of RSV-infected versus uninfected cells (AUROCs between 0.80 and 0.84) relative to PLS-DA (0.61). A subset of discriminatory features were assigned putative compound identifications, with an overabundance of hydrocarbons observed in both RSV- and IAV-infected cell cultures relative to uninfected controls. This finding is consistent with increased oxidative stress, a process associated with viral infection of respiratory cells.


Figures

Figure 1.
Figure 1.
Differential production of volatile metabolites by RSV-infected and uninfected HEp-2 cells. (A) ROC curve for the discrimination between infected and uninfected cells using random forest (RF, green), support vector machines with a linear kernel (linear SVM, blue), and partial least-squares discriminant analysis (PLS-DA, red). *Optimal sensitivity and specificity of each statistical model are calculated at the given class prediction cutoff (ranging from 0 to 1). (B) Venn Diagram of the top 20% of features selected as the most discriminatory between RSV-infected and uninfected cells using RF, SVM, and PLS-DA algorithms. (C) Differences in the composition of headspace volatile molecules as a function of sampling time (5, 24, 48, and 72 h), for two sample clusters identified via k-means clustering. The remaining cluster reported in supplementary figure 2. # features codification as in table 1.
Figure 1.
Figure 1.
Differential production of volatile metabolites by RSV-infected and uninfected HEp-2 cells. (A) ROC curve for the discrimination between infected and uninfected cells using random forest (RF, green), support vector machines with a linear kernel (linear SVM, blue), and partial least-squares discriminant analysis (PLS-DA, red). *Optimal sensitivity and specificity of each statistical model are calculated at the given class prediction cutoff (ranging from 0 to 1). (B) Venn Diagram of the top 20% of features selected as the most discriminatory between RSV-infected and uninfected cells using RF, SVM, and PLS-DA algorithms. (C) Differences in the composition of headspace volatile molecules as a function of sampling time (5, 24, 48, and 72 h), for two sample clusters identified via k-means clustering. The remaining cluster reported in supplementary figure 2. # features codification as in table 1.
Figure 2.
Figure 2.
Differential production of volatile metabolites by IAV-infected and uninfected MLE-Kd cells. (A) ROC curve for the discrimination between infected and uninfected cells using random forest (RF, green line), support vector machines with a linear kernel (linear SVM, blue line), and partial least-squares discriminant analysis (PLS-DA, red line). *Optimal sensitivity and specificity of each statistical model are calculated at the given class prediction cutoff (ranging from 0 to 1). (B) Venn Diagram of the top 20% features selected as the most discriminatory between IVA-infected cell line and uninfected control using RF. SVM, and PLS-DA algorithm. (C) Most significant clusters obtained by k-Means Clustering analysis of the difference between infected and uninfected cell cultures. Remaining cluster is reported in supplementary figure 4. # features codification as in table 1.
Figure 2.
Figure 2.
Differential production of volatile metabolites by IAV-infected and uninfected MLE-Kd cells. (A) ROC curve for the discrimination between infected and uninfected cells using random forest (RF, green line), support vector machines with a linear kernel (linear SVM, blue line), and partial least-squares discriminant analysis (PLS-DA, red line). *Optimal sensitivity and specificity of each statistical model are calculated at the given class prediction cutoff (ranging from 0 to 1). (B) Venn Diagram of the top 20% features selected as the most discriminatory between IVA-infected cell line and uninfected control using RF. SVM, and PLS-DA algorithm. (C) Most significant clusters obtained by k-Means Clustering analysis of the difference between infected and uninfected cell cultures. Remaining cluster is reported in supplementary figure 4. # features codification as in table 1.

References

    1. Price T, Schuchat A, Rothwell C J. Health, United States, 2016: With Chartbook on Long-term Trends in Health in Americans. Hyattsville, MD: National Center for Health Statistics; 2017. (DHHS Publication No 2017-1232) - PubMed
    1. UNICEF . Levels and Trends in Child Mortality. New York: UNICEF; 2015. pp. pp 1–30.
    1. United States Centers for Disease Control and Prevention National Action Plan for Combating Antibiotic-Resistant Bacteria. 2015:1-63.
    1. World Health Organization . Global Action Plan on Antimicrobial Resistance. Geneva: WHO Press; 2015. pp. pp 1–28.
    1. CDC Antibiotic resistance threats in the United States, 2013. Current. 2013;114:1-114.

Publication types

Substances