. 2018 Jan;24(1):39-49.
doi: 10.1038/nm.4447. Epub 2017 Dec 4.

Thyroid hormone inhibits lung fibrosis in mice by improving epithelial mitochondrial function

Affiliations

Thyroid hormone inhibits lung fibrosis in mice by improving epithelial mitochondrial function

Guoying Yu et al. Nat Med. 2018 Jan.

Abstract

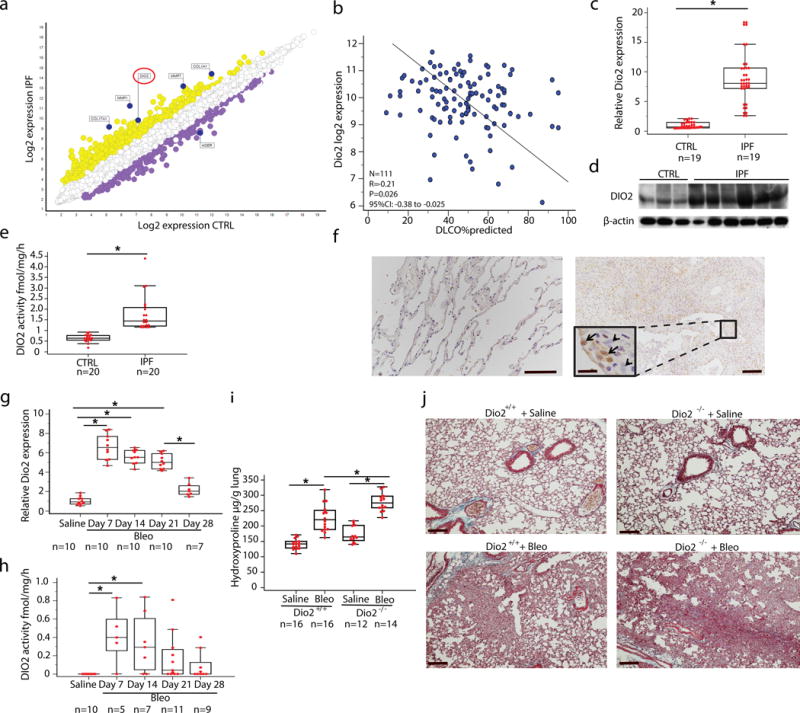
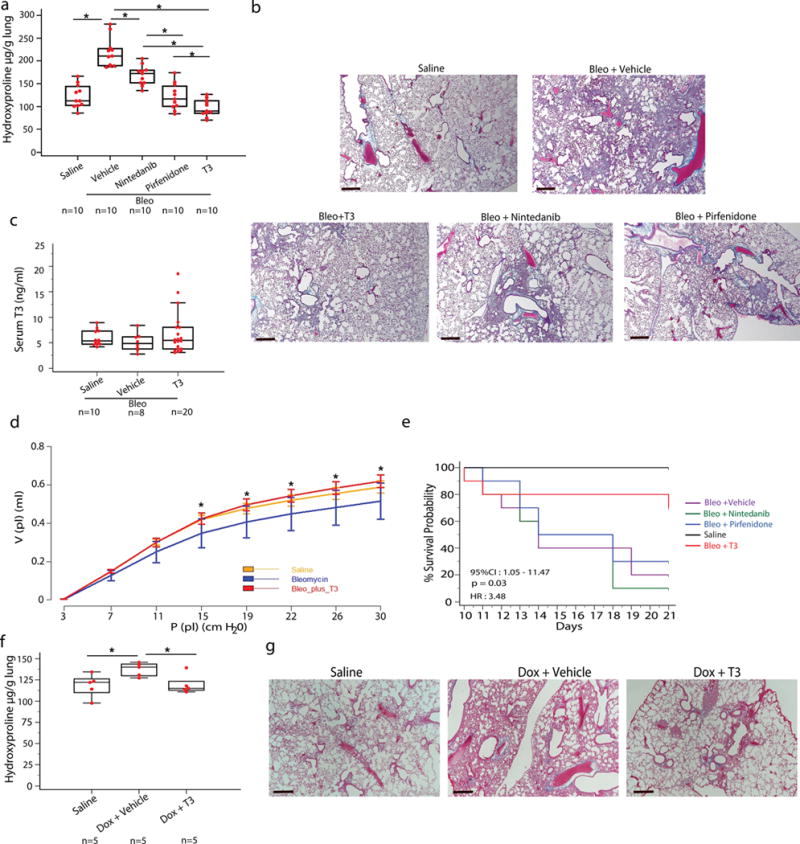
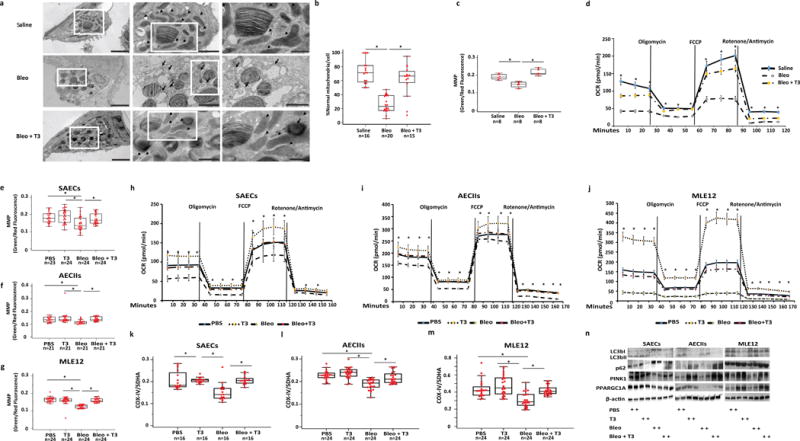
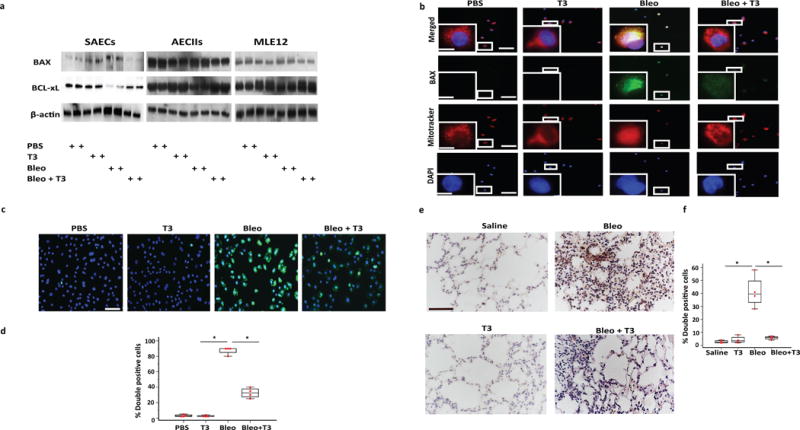
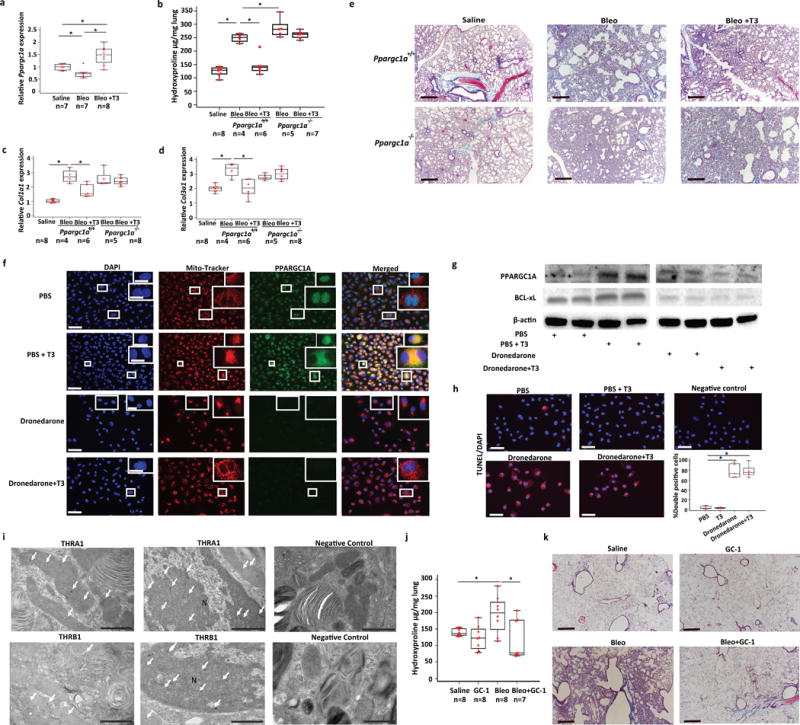
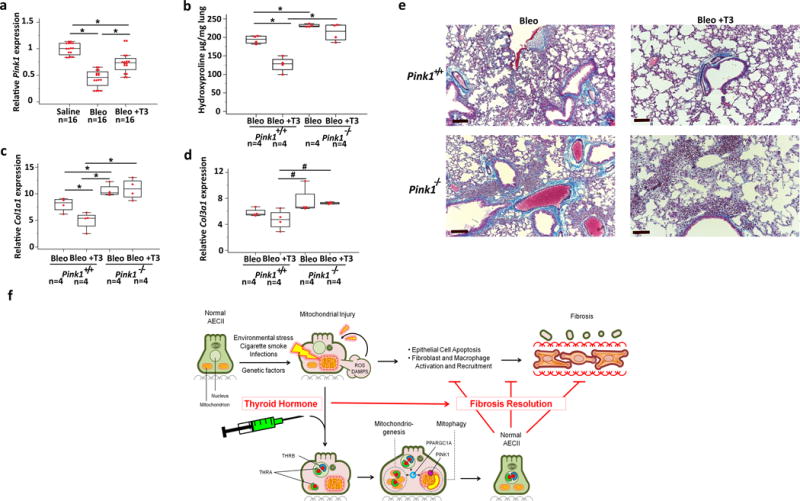
Thyroid hormone (TH) is critical for the maintenance of cellular homeostasis during stress responses, but its role in lung fibrosis is unknown. Here we found that the activity and expression of iodothyronine deiodinase 2 (DIO2), an enzyme that activates TH, were higher in lungs from patients with idiopathic pulmonary fibrosis than in control individuals and were correlated with disease severity. We also found that Dio2-knockout mice exhibited enhanced bleomycin-induced lung fibrosis. Aerosolized TH delivery increased survival and resolved fibrosis in two models of pulmonary fibrosis in mice (intratracheal bleomycin and inducible TGF-β1). Sobetirome, a TH mimetic, also blunted bleomycin-induced lung fibrosis. After bleomycin-induced injury, TH promoted mitochondrial biogenesis, improved mitochondrial bioenergetics and attenuated mitochondria-regulated apoptosis in alveolar epithelial cells both in vivo and in vitro. TH did not blunt fibrosis in Ppargc1a- or Pink1-knockout mice, suggesting dependence on these pathways. We conclude that the antifibrotic properties of TH are associated with protection of alveolar epithelial cells and restoration of mitochondrial function and that TH may thus represent a potential therapy for pulmonary fibrosis.


Conflict of interest statement

Competing financial interests

All other authors declare no additional competing interests.

Figures

Figure 1
Figure 1
DIO2 is higher in lungs of patients with IPF compared to normal histology controls and its inhibition enhances bleomycin induced lung fibrosis. (a) Microarray gene expression scatterplot comparing the log2 expression values of all genes in subjects with IPF (n = 123, y axis) and control (n = 96, x axis). Yellow indicates upregulated genes whereas purple indicates downregulated genes, between IPF and controls. (b) Correlation of tissue DIO2 log2 gene expression with diffusion capacity for carbon monoxide, Pearson Correlation, *P = 0.026. (c) Quantitative RT-PCR analysis of the DIO2 mRNA expression (means+ SEM) in lungs of patients with IPF (n = 17) and normal histology controls (n = 17), *P < 0.001 (d) Immunoblot of IPF whole lung lysates (n = 6) showing DIO2 protein levels compared to control lungs (n = 3). Immunoblot gels were cropped. Uncropped images of the immunoblot gels are in Supplementary Fig 4. (e) DIO2 activity in lung homogenates from subjects with IPF compared to controls. Data are presented as box-and-whisker plots with horizontal bars representing means+ SEM of DIO2 activity fmol/mg/h, *P < 0.0001, (f) Immunohistochemistry analysis of representative lung tissue samples (n = 4) showing DIO2 expression in IPF lungs (right panel) compared to controls (left panel). Black arrows point to alveolar epithelial cells surrounding the fibrotic interstitium, black arrowheads indicate fibroblast-like cells. Boxed region is shown enlarged as inset on the left. Scale bars, 100 μm, inset, 20 μm. (g) Quantitative RT-PCR analysis of DIO2 relative expression (means+ SEM) at different time-points following disease progression in the bleomycin model of lung fibrosis, *P < 0.001 (h) DIO2 activity at different time-points following challenge with bleomycin. Data are presented as box-and-whisker plots with horizontal bars representing means of DIO2 activity fmol/mg/h, *P = 0.006. (i) Hydroxyproline content in 9–12 weeks-old, C57/BL6 female, Dio2-knockout mice (Dio2−/−) compared to wild-type (Dio2+/+) littermates, 14 days after intratracheal challenge with bleomycin (Bleo) (1.5U/kg) or equivalent volume of normal saline 0.9%. Data presented as box-and-whisker plots are from one of two independent experiments with similar results with horizontal bars representing mean hydroxyproline content per lung set (μg/gr) + SEM, *P < 0.001. (j) Masson’s Trichrome staining of representative lung sections (n = 3) from each group of treated mice. Scale bars, 100 μm. The statistical tests used were Mann-Whitney U-test for independent samples (d) (z=7.5), (f) (z=5.4) and one-way ANOVA with Student–Newman-Keuls post-hoc test for pairwise comparisons, (h) (F=75.5, df=46) (i) (F=4.3, df=41) (j) (F=55.1, df=57).
Figure 2
Figure 2
Aerosolized T3 blunts established fibrosis in two murine models of lung fibrosis. (a) Effects of aerosolized T3, nintedanib or pirfenidone on lung hydroxyproline content. Data presented as box-and-whisker plots are from one of two independent experiments with similar results with horizontal bars representing mean hydroxyproline content per lung set (μg/gr) + SEM, *P < 0,001. (b) Masson’s Trichrome staining of representative lung sections (n = 5) from each group of treated mice. Scale bars, 50 μm. (c) Aerosolized T3 administration effects on T3 serum levels. Data are presented as box-and-whisker plots with horizontal bars representing mean T3 serum levels (ng/ml) + SEM, P = 0.7. (d) Pressure–volume-loops (PV-loops) of mice (n = 5/group) treated with aerosolized T3 following intratracheal challenge with bleomycin or normal saline, P < 0.001. (e) Kaplan-Meier plot survival plots of mice treated with aerosolized T3, pirfenidone, nintedanib or equivalent volume of vehicle following intratracheal challenge with double dose of bleomycin or normal saline, n = 10 mice/group. (f) T3 effects on hydroxyproline content in mice in the following groups: Saline – transgene not induced, Dox+vehicle - transgene induced animals treated with vehicle, DOX+T3 – transgene induced and animals treated with aerosolized T3. Data are presented as box-and-whisker plots with horizontal bars representing mean hydroxyproline content per lung set (μg/gr) + SEM, *P = 0.035. (g) Masson’s Trichrome staining of representative lung sections (n = 5) in the triple transgenic (CC10-rtTA-tTS-TGF-β1) in the groups from f. Scale bars, 50 μm. The statistical test used was one-way ANOVA with Student-Newman-Keuls post-hoc test for pairwise comparisons, (a) (F=38.6, df=54), (c) (F=0.6, df=56), (d) (F=11.9, df=44), (f) (F=4.5, df=14)
Figure 3
Figure 3
TH treatment restores bleomycin-induced mitochondrial abnormalities in alveolar epithelial cells. (a) Representative transmission electron microscopy (TEM) images (n = 16, 19 and 13, respectively) of AECIIs from mice treated with saline (upper panel), bleomycin (3.0U/kg) (middle panel) or bleomycin + aerosolized T3 (40μg/kg) (lower panel). Black arrows indicate damaged and swollen mitochondria with severely disrupted electron-lucent cristae, arrow heads indicate normal appearing mitochondria. Boxed regions are shown enlarged in the next column. Scale bars, 2 μM (left panels), 1 um (middle panels), 500 nm (right panels). (b) Quantitative analysis of the percentage of normal mitochondria per cell/group. Bars represent mean score + SEM, *P < 0,001. (c) Mitochondrial function in AECIIs cultured from animals treated with saline, bleomycin or bleomycin + T3. Data are presented as box-and-whisker plots with horizontal bars representing mean MMP levels (green/red fluorescence ratio) + SEM, *P < 0,001. (d) Oxygen consumption rate (OCR, pmol/min) was measured under basal conditions followed by addition of oligomycin, FCCP, rotenone and antimycin as indicated, *P < 0.001). (eg) Green/red fluorescence ratio as a readout of MMP in primary human small airway epithelial cells (SAECs) (e), primary mouse AECIIs (f) and mouse lung epithelial cells (MLE12) (g) exposed to bleomycin or PBS and then treated with T3 or vehicle. Data are presented as box-and-whisker plots with horizontal bars representing mean MMP levels + SEM, *P < 0.001, P = 0.003 and P < 0.001, respectively). (hj) Oxygen consumption rate (OCR, pmol/min) of the category of cells indicated in eg as measured under basal conditions followed by addition of oligomycin (0.25μM), FCCP (1 μM), as well as rotenone and antimycin (1 μM), as indicated. (km) Effects of in vitro T3 treatment on mitochondrial biogenesis in the same category cells indicated in eg as measured by the levels of Cytochrome c oxidase subunit IV (COX-IV) and Succinate Dehydrogenase Complex Flavoprotein subunit A (SDHA). Data are presented as box-and-whisker plots with horizontal bars representing mean COX-IV/SDHA ratio + SEM, *P < 0.001. (n) Immunoblot analysis of markers of autophagy (LC3BI, II, p62, PINK1) and mitochondrial biogenesis (PPARGCA1) in the same category of cells indicated in eg. Immunoblot gels were cropped and uncropped images of the immunoblot gels are in Supplementary Figure 4. The statistical test used was One-way ANOVA with Student-Newman-Keuls post-hoc test for pairwise comparisons (b) (F=34.5, df=50), (c) (F=38.6, df=23) (d) (F=91.4, df=42), (e) (F=7.04, df=94) (f) (F=5.15, df=83) (g), (F=35.3, df=95), (k) (F=39.6, df=88), (l) (F=30.1, df=74), (m) (F= 74.6, df= 87).
Figure 4
Figure 4
TH attenuates mitochondria-regulated apoptosis in lung epithelial cells. (a) Immunoblot analysis of markers of mitochondria-cell apoptosis (BAX, BCL-xL). Each lane represents a biological replicate and 2 experiments were done in each case. Immunoblot gels were cropped, and uncropped images of the immunoblot gels are in Supplementary Fig 4. (b) Immunofluorescence analysis for Mito-Tracker (red cationic dye that stains active mitochondria) and BAX (green) in SAECs after bleomycin or PBS exposure and treatment with or without T3. Localization of BAX with mito-tracker is indicated in yellow. Boxed regions are shown enlarged at lower left panels. Scale bars, 50μm, insets: 10 μm. (c,d) Immunofluorescence (c) and quantitative analysis (d) of double positive SAECs (TUNEL/DAPI). Data are presented as box-and-whisker plots with horizontal bars representing mean % percentage of double positive cells + SEM. One-way ANOVA (F=366.7, df=15) with Student-Newman-Keuls post-hoc test for pairwise comparisons, *P < 0.001. (e,f) Immunohistochemistry (e) and quantitative analysis (f) of TUNEL-positive cells in lung samples derived from mice challenged bleomycin or saline and then treated with T3 or vehicle at days 10–20. Data are presented as box-and-whisker plots with horizontal bars representing mean % percentage of double positive cells + SEM, *P < 0.001. Scale bars, 100μm. The statistical test used was one-way ANOVA (F=33.3, df=15) with Student-Newman-Keuls post-hoc test for pairwise comparisons.
Figure 5
Figure 5
Anti-fibrotic effects of TH are mediated through PPARGC1A. (a) Quantitative RT-PCR analysis for Ppargc1a mRNA levels in the indicated treatment groups (means+ SEM), *P < 0.001. (b) Lung hydroxyproline content, and quantitative RT-PCR analysis of collagen type 1, alpha 1 (Col1a1) (c) and type 3, alpha 1 (Col3a1) (d) mRNA levels in Ppargc1a-deficient (Ppargc1a−/−) mice or wild-type littermates (Ppargc1a +/+) treated with aerosolized T3 following intratracheal challenge with bleomycin or equivalent volume of normal saline. Data presented are from one of two independent experiments with similar results and are expressed as mean hydroxyproline content per lung (μg/gr lung) set + SEM, *P < 0.001. (e) Masson’s Trichrome staining of representative lung sections (n = 3) from each group of mice indicated. Scale bars, 50 μm. (f) Immunofluorescence analysis for Mito-Tracker (red cationic dye that stains active mitochondria) and PPARGC1A (green) in A549 cells after pre-incubation with dronedarone for 24 hr or saline and treatment with or without T3. Colocalization of PPARGC1A with Mito-Tracker is denoted in yellow. Boxed regions are shown enlarged at upper right panels. Scale bars, 50μm, insets 10 μm. (g) Immunoblot of PPARGC1A in A549 cell lysates from cells treated as described for f (n = 2/group). Immunoblot gels were cropped and uncropped images of the immunoblot gels are in Supplementary Fig 4. (h) Immunofluorescence (left and upper right) and quantitative analysis (lower right) of double positive A549 cells (TUNEL/DAPI) after treatment as described in f. Quantitative data are presented as box-and-whisker plots with horizontal bars representing mean %percentage of double positive cells + SEM, *P < 0.001. (i) Representative TEM images of mouse lung sections (n = 5) stained with immunogold technique for expression of THRA1 (black dots-white arrows-upper panel) and THRB (black dots-white arrows-lower panel) inside morphologically normal mitochondria as well as nuclei (N) of primary AECIIs. Negative control was stained with secondary antibody only. (j) Lung hydroxyproline content in mice challenged with saline, bleomycin or bleomycin + sobiterome. Data are presented as box-and-whisker plots with horizontal bars representing mean hydroxyproline content per lung set (μg/gr) + SEM, *P = 0.01. (k) Masson’s Trichrome staining of representative lung sections (n = 3) from each group of mice indicated. The statistical test used was one-way ANOVA with Student-Newman-Keuls post-hoc test for pairwise comparisons (a) (F=14.5, df=21), (b) (F=54.8, df=29), (c) (F=25.2, df=30), (d) (F=12.5, df=30), (f) (F=96.7, df=19), (j) (F=4.3, df=23).
Figure 6
Figure 6
PINK1 is required for the antifibrotic effects of TH. (a) Quantitative RT-PCR analysis for Pink1 mRNA levels in wild-type littermates intratracheally challenged with saline, bleomycin or aerosolized T3 following bleomycin. (means+ SEM), *P < 0.001. (b) Collagen deposition assessed by hydroxyproline content in Pink1-deficient (Pink1−/−) mice or wild-type littermates (Pink1+/+) treated with aerosolized T3 following intratracheal challenge with bleomycin vs. controls. Data presented are from one of two independent experiments with similar results and are expressed as mean hydroxyproline content per lung set (μg/gr lung) + SEM, n = 4 mice/group, *P < 0.001. (c,d) Quantitative RT-PCR analysis of collagen type 1, alpha 1 (Col1a1) and type 3, alpha 1 (Col3a1) mRNA levels in a similar group of mice indicated in b (means+ SEM), *P < 0.001 and #P = 0.03. (e) Masson’s Trichrome staining of representative lung sections (n = 3) from each group of treated mice indicated. Scale bars, 100μm. The statistical test used was one-way ANOVA with Student-Newman-Keuls post-hoc test for pairwise comparisons (a) (F=46, df=47), (b) (F=29.9, df=15), (c) (F=12.9, df=15), (d) (F=4.2, df=15) (f) Schematic diagram of a model of the anti-fibrotic effect of TH via its restoration of mitochondrial homeostasis and function in alveolar type II epithelial cells (AECIIs). Injury of AECIIs leads to mitochondrial dysfunction and release of reactive oxygen species (ROS) and damage-associated molecular patterns (DAMPs) including mitochondrial DNA. TH supplementation modifies fibrosis through an epithelial protective effect via its binding to its receptor (THRA1, THRB) and its promotion of the expression of positive regulators of mitochondrial metabolism (PPARGC1A) and mitophagy (PINK1), resulting in restoration of normal mitochondrial function, rescue from mitochondria-regulated apoptosis and fibrosis resolution.

Comment in

References

    1. Travis WD, et al. An official American Thoracic Society/European Respiratory Society statement: Update of the international multidisciplinary classification of the idiopathic interstitial pneumonias. American journal of respiratory and critical care medicine. 2013;188:733–748. - PMC - PubMed
    1. Sgalla G, Biffi A, Richeldi L. Idiopathic pulmonary fibrosis: Diagnosis, epidemiology and natural history. Respirology. 2016;21:427–437. - PubMed
    1. Richeldi L, Collard HR, Jones MG. Idiopathic pulmonary fibrosis. Lancet. 2017;389:1941–1952. - PubMed
    1. Bagnato G, Harari S. Cellular interactions in the pathogenesis of interstitial lung diseases. Eur Respir Rev. 2015;24:102–114. - PMC - PubMed
    1. Kusko RL, et al. Integrated Genomics Reveals Convergent Transcriptomic Networks Underlying Chronic Obstructive Pulmonary Disease and Idiopathic Pulmonary Fibrosis. American journal of respiratory and critical care medicine. 2016;194:948–960. - PMC - PubMed

Publication types

Substances