. 2018 Jan;24(1):29-38.
doi: 10.1038/nm.4443. Epub 2017 Dec 4.

Amyloid-β plaques enhance Alzheimer's brain tau-seeded pathologies by facilitating neuritic plaque tau aggregation

Affiliations

Amyloid-β plaques enhance Alzheimer's brain tau-seeded pathologies by facilitating neuritic plaque tau aggregation

Zhuohao He et al. Nat Med. 2018 Jan.

Abstract

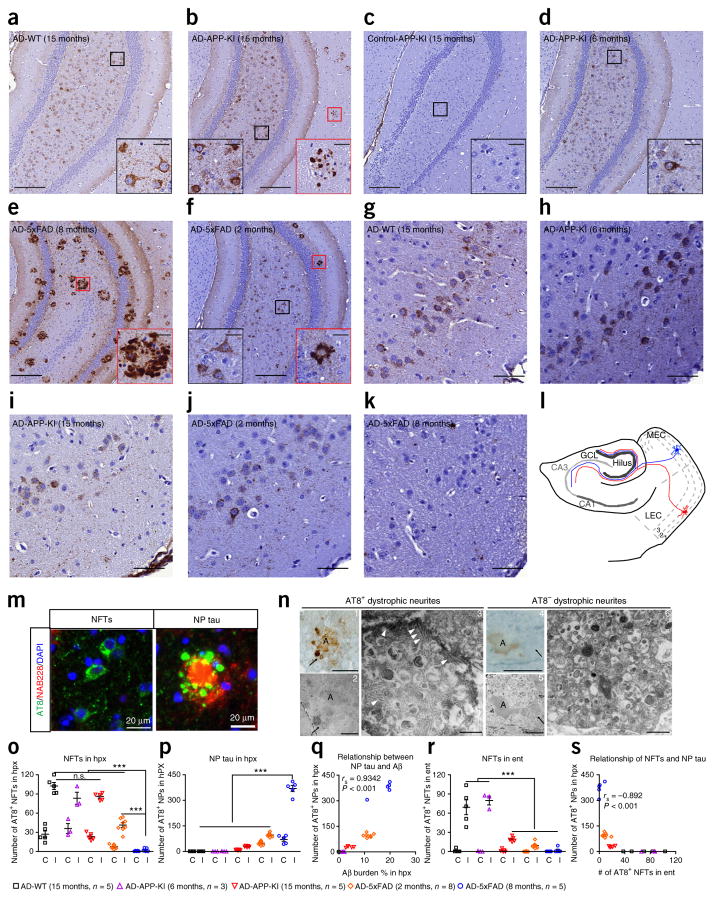
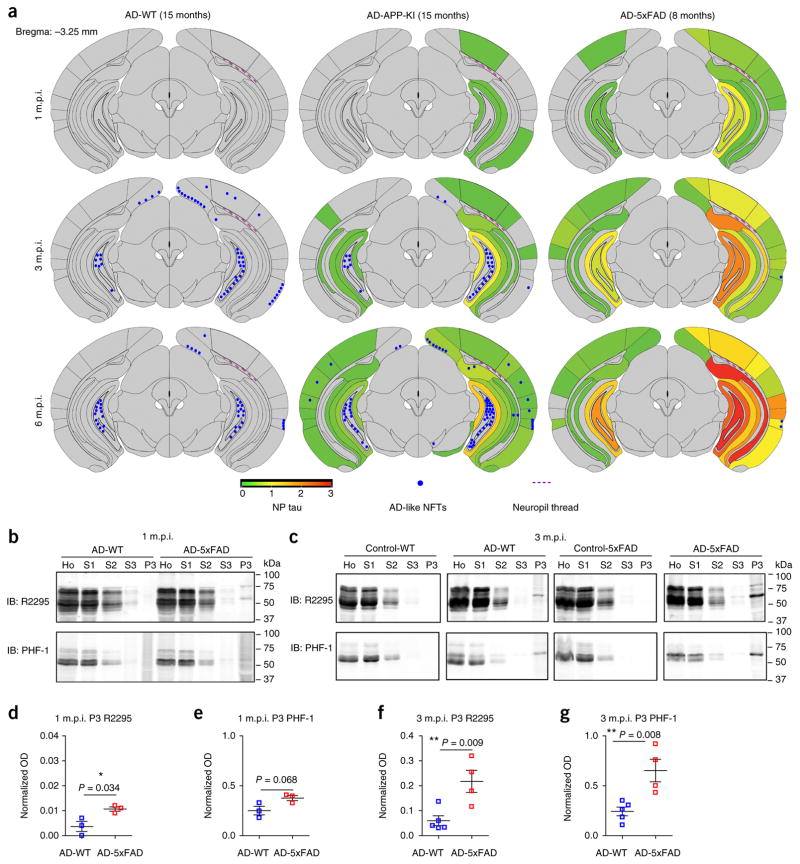
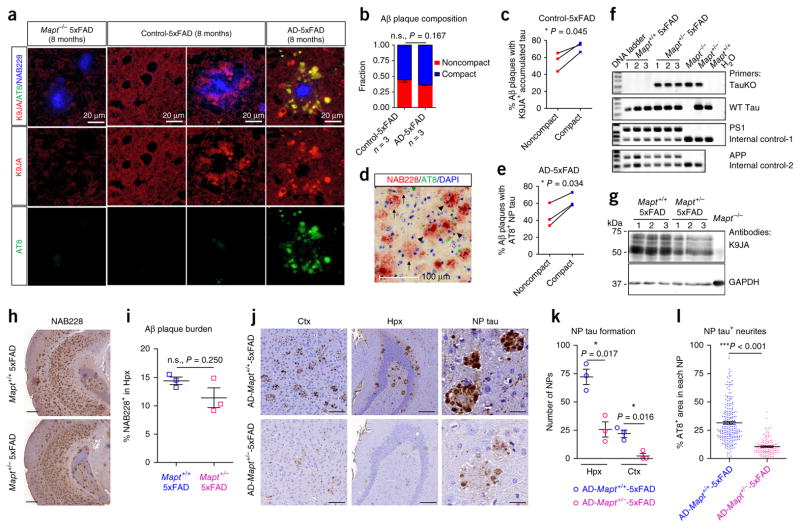
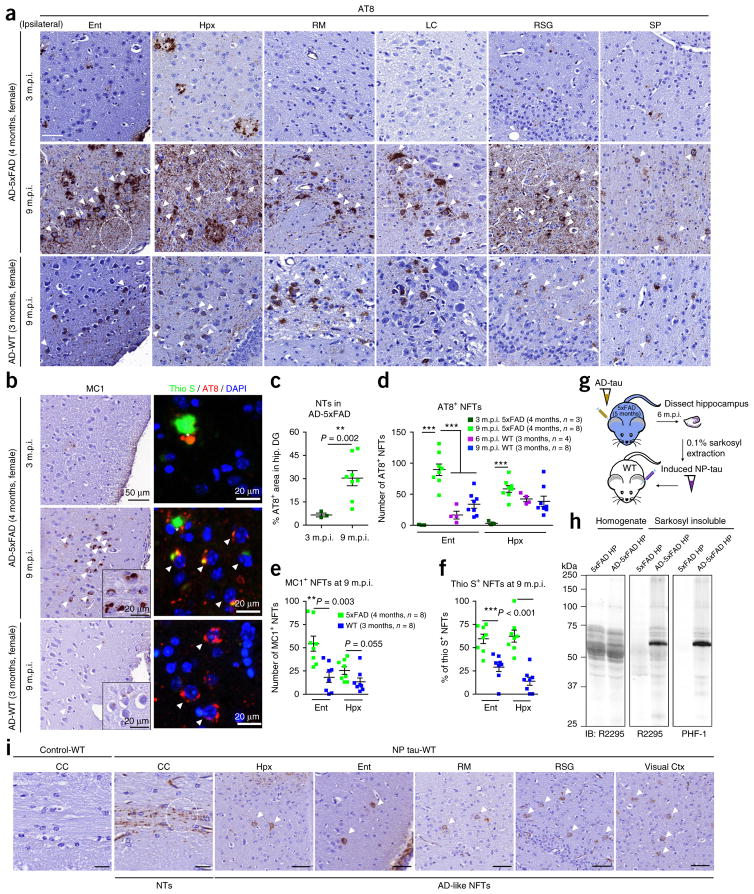
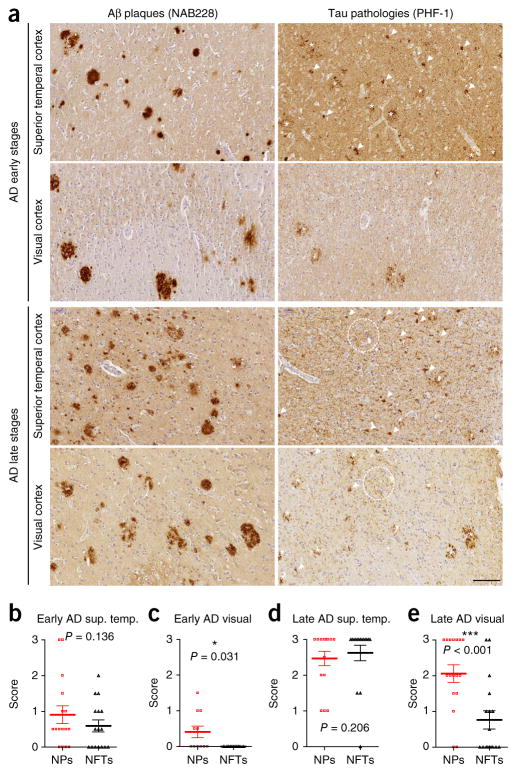
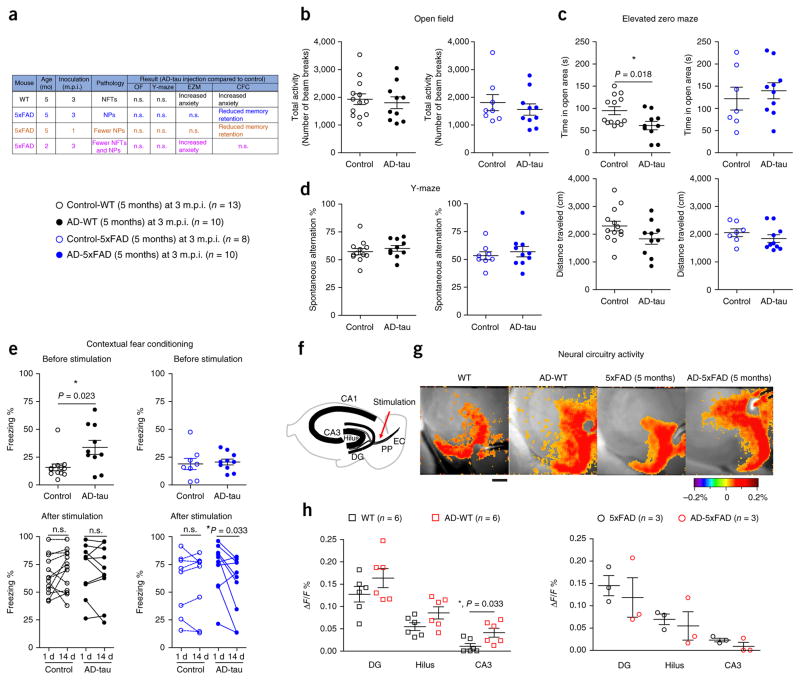
Alzheimer's disease (AD) is characterized by extracellular amyloid-β (Aβ) plaques and intracellular tau inclusions. However, the exact mechanistic link between these two AD lesions remains enigmatic. Through injection of human AD-brain-derived pathological tau (AD-tau) into Aβ plaque-bearing mouse models that do not overexpress tau, we recapitulated the formation of three major types of AD-relevant tau pathologies: tau aggregates in dystrophic neurites surrounding Aβ plaques (NP tau), AD-like neurofibrillary tangles (NFTs) and neuropil threads (NTs). These distinct tau pathologies have different temporal onsets and functional consequences on neural activity and behavior. Notably, we found that Aβ plaques created a unique environment that facilitated the rapid amplification of proteopathic AD-tau seeds into large tau aggregates, initially appearing as NP tau, which was followed by the formation and spread of NFTs and NTs, likely through secondary seeding events. Our study provides insights into a new multistep mechanism underlying Aβ plaque-associated tau pathogenesis.


Conflict of interest statement

COMPETING FINANCIAL INTERESTS

The authors declare no competing financial interests.

Figures

Figure 1
Figure 1
Aβ plaques facilitate AD-tau induction of NP tau, rather than NFTs, at early seeding stages. (af) Representative immunostaining of pathological tau using the antibody AT8 in the ipsilateral ventral hippocampus dentate gyrus regions of 15-month-old WT (n = 5) (a), 15-month-old APP-KI (n = 5) (b), 6-month-old APP-KI (n = 3) (d), 8-month-old 5xFAD (n = 5) (e) and 2-month-old 5xFAD (n = 8) (f) mice at 3 m.p.i. with AD-tau and of 15-month-old APP-KI mice at 6 m.p.i. with age-matched control human brain lysate (n = 3) (c). Scale bars, 200 μm. Insets show a higher magnification of the corresponding areas in red (NP tau) and black (NFTs) boxes. Inset scale bar, 25 μm. (gk) Immunostaining of the ipsilateral entorhinal cortex with AT8 for the mice used in a, b and df. Scale bar, 50 μm. (l) Schematic showing the perforant pathway and illustrating how Aβ plaques facilitate aggregation of tau as NP tau in the dystrophic axons of the hippocampus in the area where AD-tau is injected. This leads to fewer pathological tau seeds available to induce formation of NFT aggregates in the connected somas located in entorhinal cortex. GCL, granule cell layer; MEC, medial entorhinal cortex; LEC, lateral entorhinal cortex. The number indicates the cortical layers, and red and blue cells depict two representative neurons. (m) Double labeling of Aβ (red) and tau (green) pathologies with NAB228 and AT8 monoclonal antibodies, respectively, in APP-KI (15 months) mice at 3 m.p.i. with AD-tau. DAPI (blue) stains nucleus. Scale bar, 20 μm. (n) Immunoelectron microscopy images of AT8+ (images 1–3) and AT8 (images 4–6) dystrophic neurites around Aβ plaques. Images 1 and 4 are bright-field microscopy images, images 2 and 5 are corresponding low magnifications and images 3 and 6 are corresponding high magnifications. White arrowheads indicate examples of the fibrillar tau pathologies, and black arrows indicate the same dystrophic neurite throughout images 1–3 or 4–6. The letter A marks Aβ plaques. Scale bars in images 1 and 4, 25 μm; images 2 and 5, 10 μm; images 3 and 6, 500 nm. (o,p,r) The AT8+ NFTs (o) and NP tau (p) in the hippocampus (hpx) and the NFTs in the entorhinal cortex (ent) (r) of the AD-tau-injected mouse cohorts represented in ak were systematically quantified on both the ipsilateral (I) and contralateral (C) sides. One-way ANOVA with Tukey’s multiple-comparisons test was performed; **P < 0.01, ***P < 0.001; n.s., nonsignificant. (q,s) Positive correlation between Aβ burden and the induction of NP tau (Spearman correlation; rs = 0.9342, P < 0.001) (q) and inverse correlation between NP tau in the ipsilateral hippocampus and NFTs in the ipsilateral entorhinal cortex (Spearman correlation; rs = −0.892, P < 0.001) (s) for the mice represented in af. Data are presented as mean ± s.e.m. in o, p and r. The total protein amounts in AD and control brain lysates injected into each mouse were similar.
Figure 2
Figure 2
NP tau aggregates faster and spreads more widely than NFT tau. (a) Semiquantitative analysis of AD-like NFT and NP tau pathologies based on AT8 immunostaining of brains from AD-WT (15 months), AD-APP-KI (15 months) and AD-5xFAD (8 months) mice at 1, 3 and 6 m.p.i. Representative coronal planes containing the ventral hippocampus are shown for each cohort, and seven additional coronal planes at 0.98, −0.22, −1.22, −2.18, −2.92, −4.48 and −5.52 with respect to bregma (coordinates in mm) are shown in Supplementary Figure 5a. Heat map colors represent the extent of NP tau pathology (gray (0), no pathology; red (3), maximum pathology). Average scores from each cohort of mice are presented. (b,c) Immunoblots after sequential extractions of hippocampus from WT and 5xFAD (8 months) mice with AD-tau or control injection at 1 m.p.i. (b) and 3 m.p.i. (c). Equal proportions of Ho, homogenate; S1, high-salt supernatant; S2, 1% Triton X-100 supernatant; S3, 1% sarkosyl supernatant; P3, 20-fold enrichment of 1% sarkosyl pellet relative to Ho were analyzed. (d,e) Quantification of P3 fractions immunoblotted with R2295 antibody selective for mouse tau (d) and PHF-1 antibody for hyperphosphorylated tau (e) at 1 m.p.i. as shown in b. Three pairs of mice were quantified. (f,g) Quantification of the P3 fractions immunoblotted with R2295 (f) and PHF-1 (g) at 3 m.p.i. as shown in c. Five AD-WT and four AD-5xFAD mice were quantified. Optical density (OD) was normalized to that for the homogenate fraction from each corresponding mouse. A two-tailed t-test was performed; *P ≤ 0.05, **P ≤ 0.01. Data are presented as mean ± s.e.m. in dg.
Figure 3
Figure 3
Mislocalized tau in periplaque dystrophic axons is critical for AD-tau-induced NP tau aggregation. (a) Representative images of endogenous tau (red) detected by antibody K9JA in regions with or without Aβ plaques (blue) from 5xFAD mice with no endogenous tau ((Mapt−/− 5xFAD) (8 months)) or 5xFAD mice (8 months) injected with human control brain lysate or AD-tau at 3 m.p.i. Pathological tau (green) was detected by antibody AT8. Results from one out of three mice per group are shown. (b) Similar amounts of noncompact and compact plaques were present in control-5xFAD mice, and this ratio was not significantly altered in AD-5xFAD mice. (c) Proportion of each type of Aβ plaque surrounded by K9JA-labeled endogenous tau in control-5xFAD mice. Three mice were quantified. (d,e) Representative image (d) and proportion of each type (e) of Aβ plaque (red) surrounded by induced AT8-labeled NP tau (green) in AD-5xFAD mice. DAPI (blue) stains nucleus. In d, arrows indicate noncompact plaques and arrowheads indicate compact plaques. Scale bar in d, 100 μm. Quantifications in b, c and e were performed from the ipsilateral caudal hippocampal region of 5xFAD (8 months) mice injected with AD-tau or control at 3 m.p.i.; three mice per group were quantified. (fi) Characterization of Mapt+/− 5xFAD mice (n = 3 per group). (f) PCR of genomic DNA confirming the genotype of Mapt+/− 5xFAD mice. The primers used for genotyping are indicated on the right. (g) Western blotting showing that endogenous mouse tau is reduced in Mapt+/− 5xFAD mice as compared to Mapt+/+ 5xFAD mice. (h) Representative NAB228 immunostaining; scale bar, 400 μm. (i) Quantification of brain slices containing caudal hippocampus showing the Aβ plaque burden in 8-month-old 5xFAD mice with or without tau reduction. Two-tailed t-tests were performed; *P ≤ 0.05. (j,k) Representative AT8 immunostaining (j) and quantification (k) of NP tau in both retrosplenial cortex (ctx) and hippocampus on the ipsilateral side of AD-tau-injected 8-month-old Mapt+/+ 5xFAD and Mapt+/− 5xFAD mice at 1 m.p.i. (n = 3 per group). A dashed circle in j indicates a single NP. Scale bars in j: retrosplenial cortex, 100 μm; hippocampus, 200 μm; NP tau, 25 μm. (l) Quantification of NP-tau-positive neurites as a percentage of AT8 staining within each NP, as represented in the right panels in j. Over 100 NP tau from three mice per group were examined. A two-tailed t-test was performed; *P ≤ 0.05, ***P ≤ 0.001. Data are presented as mean ± s.e.m. in b, i, k and l.
Figure 4
Figure 4
NP tau triggers the formation of NFTs and NTs through secondary seeding events at later seeding stages. (a) Representative images showing tau pathologies as revealed by AT8 labeling in different brain regions on the ipsilateral sides of female AD-5xFAD (4 months) and AD-WT (3 months) mice from 3 to 9 m.p.i. of AD-tau. Three mice were analyzed at 3 m.p.i. and eight mice were analyzed at 9 m.p.i. Scale bar, 50 μm. RM, retromammillary nucleus; LC, locus coeruleus; RSG, retrosplenial granular cortex; SP, septal nucleus. (b) Representative images showing NFTs in AD-5xFAD (4 months) and AD-WT (3 months) mice detected by MC1 and thioflavin S (thio S). Thioflavin S–labeled β-sheet protein structure is stained in green, AT8-labelled pathological tau is stained in red and DAPI-labeled cell nucleus is stained in blue. Inserts are images with higher magnification. In a, b and i, white arrowheads indicate NFTs, white circles indicate NTs and asterisks indicate NP tau. (c) Quantification of AT8-labeled NTs as a percentage of the area occupied in the hippocampal dentate gyrus (DG) region from AD-5xFAD (4 months) mice at 3 and 9 m.p.i., showing abundant NTs in AD-tau-injected 5xFAD mice at later time points. (d,e) Quantification of AT8-labeled (d) and MC1-labeled (e) NFTs in entorhinal cortex and hippocampus from the AD-WT and AD-5xFAD mice shown in a and b. (f) The maturation of AD-like NFTs was determined by the percentage of AT8-labeled AD-like NFTs with thioflavin S co-labeling at 9 m.p.i. in AD-5xFAD (4 months) and AD-WT (3 months) mice. The quantification results shown in cf were from ipsilateral regions. A two-tailed t-test was performed; *P ≤ 0.05, **P ≤ 0.01. The size of each group in af is indicated in d. (g) Hippocampal tissues from AD-5xFAD (5 months) mice at 6 m.p.i. were extracted to obtain NP tau, which was reinjected into the hippocampus of WT mice to test its ability to induce NFTs and NTs in vivo. (h) Immunoblot showing that the induced pathological mouse tau in NP tau is present in the 0.1% sarkosyl–insoluble fraction. Equal proportions of Ho and 20-fold enrichment of 0.1% sarkosyl pellet relative to homogenate were analyzed with mouse-tau-specific antibody R2295 and hyperphosphorylated-tau-specific antibody PHF-1. Control lysates were extracted in the same way from the hippocampi of noninjected age-matched 5xFAD mice. (i) Representative images from three mice per group showing that AT8-labeled NTs and NFTs are present in multiple brain regions of WT mice injected with NP tau but are absent from those injected with control lysates at 3 m.p.i. Similar amounts of total protein in control and NP tau lysates were injected into each mouse. CC, corpus callosum. Scale bars in CC, 20 μm; in all others, 50μm. Data are presented as mean ± s.e.m. in cf.
Figure 5
Figure 5
NP tau appears earlier than NFTs in human AD brain. (a) Representative immunostaining with PHF-1 and NAB228 antibodies in superior temporal cortex and visual cortex on adjacent brain sections of one individual with AD from a set of 16 cases with early stages of AD pathology and of one individual with AD from a set of 17 cases with late stages of AD pathology, as determined using the most recent National Institute on Aging–Alzheimer’s Association (NIA-AA) guidelines for the neuropathological staging of AD plaque and tangle pathology,. White arrowheads indicate NFTs, dashed white circles indicate NTs and the asterisks indicate NP tau. Scale bar, 100 μm. (be) A semiquantitative analysis of the pathologies of NP tau and NFTs in superior temporal cortex (sup. temp.) at early (b) and late (d) AD stages as well as in visual cortex (visual) at early (c) and late (e) AD stages. A two-tailed paired t-test was performed; *P ≤ 0.05, ***P ≤ 0.001. Data are presented as mean ± s.e.m. in be.
Figure 6
Figure 6
The induced tau pathologies elicit effects on neural circuit activity and mouse behaviors. Mice with exclusively NFTs (AD-WT (5 months)) and exclusively NP tau (AD-5xFAD (5 months)) were tested for both behavioral and neural circuitry changes after 3 m.p.i. of AD-tau. (a) Brief summary of the behavioral results from all cohorts of mice presented here and in Supplementary Figure 9. OF, open field; EZM, elevated Z-maze; CFC, contextual fear conditioning. (b) Open field test showing no locomotor deficit in any of the mice. (c) Elevated zero maze results showing an anxiety-like behavior deficit in AD-WT (5 months) mice. (d) Spontaneous alteration behavior in the Y-maze reflecting short-term memory of the tested mice. Two-tailed t-tests were performed in bd; *P ≤ 0.05, **P ≤ 0.01. (e) Contextual fear conditioning was performed to assess the basal anxiety level and long-term memory of the mice. The percentage of time each mouse exhibited freezing behavior during the test period was recorded as ‘Freezing %’. The response changes for each individual mouse from 1 to 14 d post-stimulation reflect the remote memory retention of the tested mice. Two-way ANOVA with time as a repeated measure was performed; AD-5xFAD (5 months): time (P = 0.047, F = 4.649, degrees of freedom (DF) = 1), AD-tau treatment (P = 0.618, F = 0.259, DF = 1) and interaction (P = 0.061, F = 4.054, DF = 1). This was followed by a two-tailed paired t-test. Each group contained 8–13 mice, and each mouse is indicated as a dot in the graphs. (f) Diagram showing the hippocampal regions in which voltage-sensitive dye fluorescence was recorded on the brain slices. PP, perforant pathway; EC, entorhinal cortex. (g) Representative pseudocolored images of neural activity recorded from WT (n = 6), AD-WT (n = 6), 5xFAD (n = 3) and AD-5xFAD (n = 3) mice depicting the change in membrane potential measured as the relative time-resolved fluorescence of a voltage-sensitive dye loaded into hippocampal slices prepared from WT and 5xFAD mice with or without AD-tau injection. Scale bar, 300 μm. (h) Quantification of the membrane potential changes in sequential hippocampal regions activated by stimulation of the perforant pathway: dentate gyrus, hilus and area CA3 in the mice injected with AD-tau or control. Data shown in the graphs are from 3–6 mice, as indicated. Data for two to three brain slices per mouse were recorded and averaged to produce a single value for each mouse. Two-way ANOVA with region as a repeated measure was performed; WT mice: region (P < 0.0001, F = 29.93, DF = 2), AD-tau treatment (P = 0.0045, F = 11.17, DF = 1) and interaction (P = 0.9635, F = 0.03729, DF = 2). This was followed by a t-test with Welch’s correction; *P ≤ 0.05. Data are presented as mean ± s.e.m. in be and h.

References

    1. Hardy JA, Higgins GA. Alzheimer’s disease: the amyloid cascade hypothesis. Science. 1992;256:184–185. - PubMed
    1. Gómez-Isla T, et al. Neuronal loss correlates with but exceeds neurofibrillary tangles in Alzheimer’s disease. Ann Neurol. 1997;41:17–24. - PubMed
    1. Bennett DA, Schneider JA, Wilson RS, Bienias JL, Arnold SE. Neurofibrillary tangles mediate the association of amyloid load with clinical Alzheimer disease and level of cognitive function. Arch Neurol. 2004;61:378–384. - PubMed
    1. Braak H, Thal DR, Ghebremedhin E, Del Tredici K. Stages of the pathologic process in Alzheimer disease: age categories from 1 to 100 years. J Neuropathol Exp Neurol. 2011;70:960–969. - PubMed
    1. Schöll M, et al. PET imaging of tau deposition in the aging human brain. Neuron. 2016;89:971–982. - PMC - PubMed

Publication types