

Analysing increasing trends of Guillain-Barré Syndrome (GBS) and dengue cases in Hong Kong using meteorological data
- PMID: 29200423
- PMCID: PMC5714337
- DOI: 10.1371/journal.pone.0187830
Analysing increasing trends of Guillain-Barré Syndrome (GBS) and dengue cases in Hong Kong using meteorological data
Abstract
Background: Guillain-Barré Syndrome (GBS) is a severe paralytic neuropathy associated with virus infections such as Zika virus and Chikungunya virus. There were also case reports of dengue fever preceding GBS. With the aim to understand the mechanisms of GBS and dengue outbreaks, this ecological study investigates the relationships between GBS, dengue, meteorological factors in Hong Kong and global climatic factors from January 2000 to June 2016.
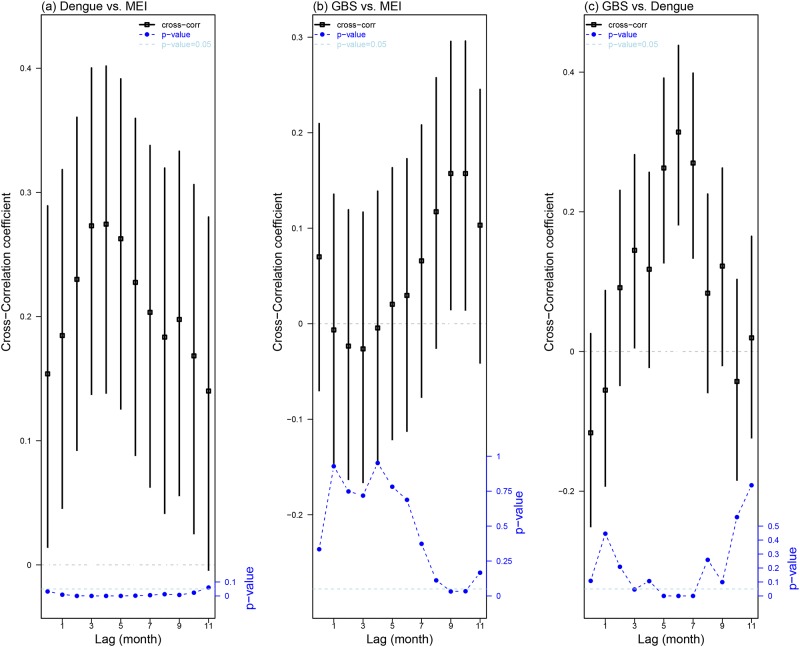
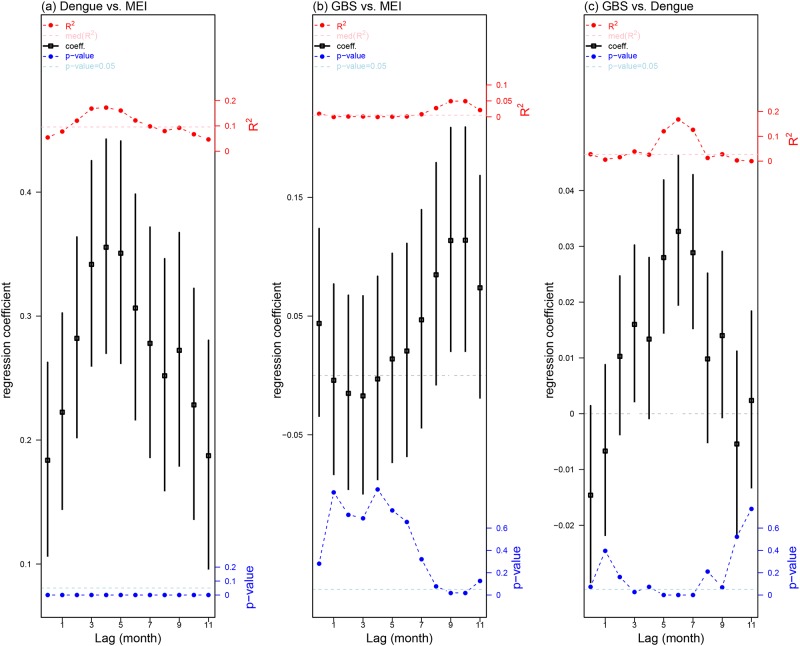
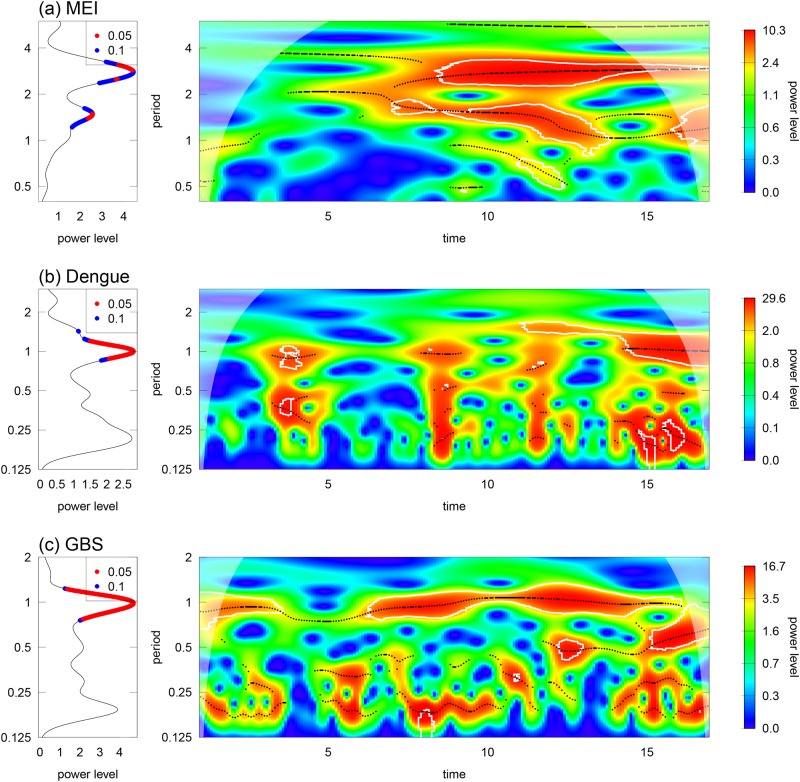
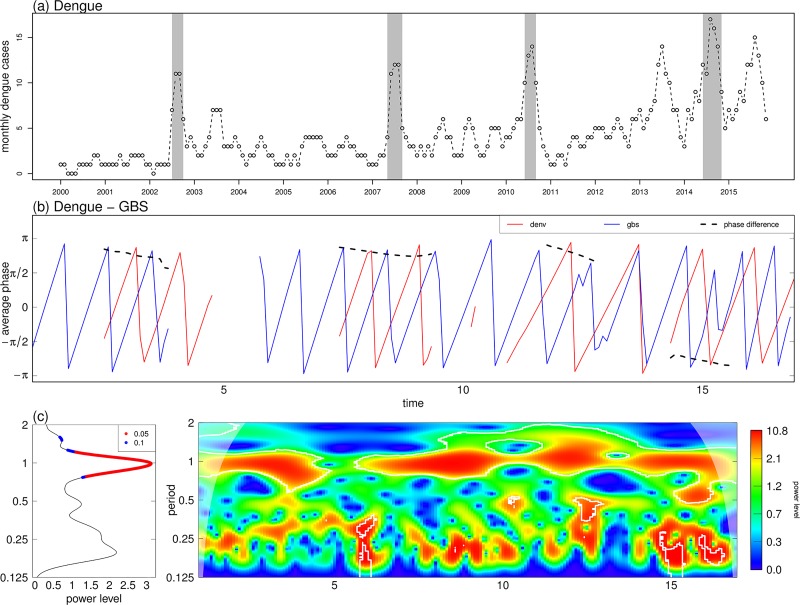
Methods: The correlations between GBS, dengue, Multivariate El Niño Southern Oscillation Index (MEI) and local meteorological data were explored by Spearman's Rank correlations and cross-correlations. Three Poisson regression models were fitted to identify non-linear associations among GBS, dengue and MEI. Cross wavelet analyses were applied to infer potential non-stationary oscillating associations among GBS, dengue and MEI.
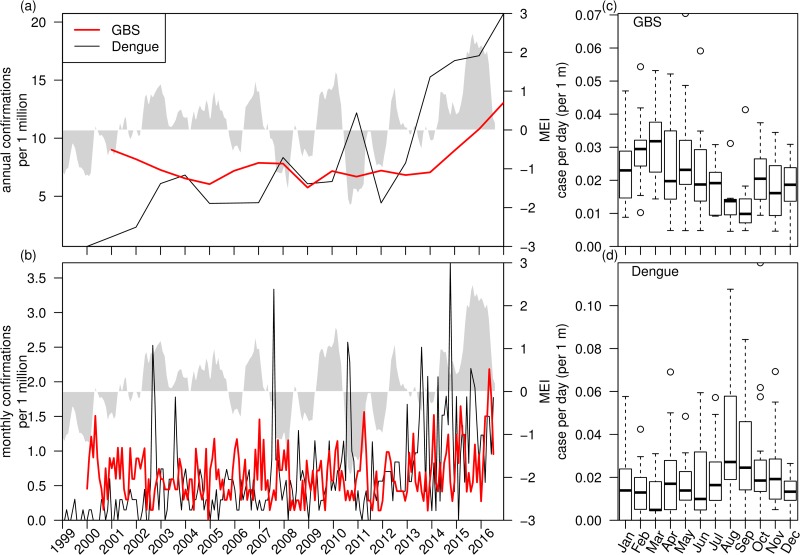
Findings and conclusion: We report a substantial increasing of local GBS and dengue cases (mainly imported) in recent year in Hong Kong. The seasonalities of GBS and dengue are different, in particular, GBS is low while dengue is high in the summer. We found weak but significant correlations between GBS and local meteorological factors. MEI could explain over 17% of dengue's variations based on Poisson regression analyses. We report a possible non-stationary oscillating association between dengue fever and GBS cases in Hong Kong. This study has led to an improved understanding about the timing and ecological relationships between MEI, GBS and dengue.
Conflict of interest statement
Figures
Similar articles
-
Guillain-Barré Syndrome During Ongoing Zika Virus Transmission - Puerto Rico, January 1-July 31, 2016.MMWR Morb Mortal Wkly Rep. 2016 Sep 2;65(34):910-4. doi: 10.15585/mmwr.mm6534e1. MMWR Morb Mortal Wkly Rep. 2016. PMID: 27584942
-
Guillain-Barré Syndrome outbreak associated with Zika virus infection in French Polynesia: a case-control study.Lancet. 2016 Apr 9;387(10027):1531-1539. doi: 10.1016/S0140-6736(16)00562-6. Epub 2016 Mar 2. Lancet. 2016. PMID: 26948433 Free PMC article.
-
Zika virus infection and Guillain-Barré syndrome: a review focused on clinical and electrophysiological subtypes.J Neurol Neurosurg Psychiatry. 2017 Mar;88(3):266-271. doi: 10.1136/jnnp-2016-314310. Epub 2016 Oct 31. J Neurol Neurosurg Psychiatry. 2017. PMID: 27799296 Review.
-
Characterization of adult patients with Guillain-Barré syndrome during the arboviral infection outbreaks in Honduras.J Neurol Sci. 2021 Aug 15;427:117551. doi: 10.1016/j.jns.2021.117551. Epub 2021 Jun 21. J Neurol Sci. 2021. PMID: 34171744
-
Guillain-Barré syndrome and Zika virus outbreaks.Curr Opin Neurol. 2017 Oct;30(5):500-507. doi: 10.1097/WCO.0000000000000471. Curr Opin Neurol. 2017. PMID: 28617719 Review.
Cited by
-
Collaboration between meteorology and public health: Predicting the dengue epidemic in Guangzhou, China, by meteorological parameters.Front Cell Infect Microbiol. 2022 Aug 9;12:881745. doi: 10.3389/fcimb.2022.881745. eCollection 2022. Front Cell Infect Microbiol. 2022. PMID: 36017372 Free PMC article.
-
Understanding risk communication for prevention and control of vector-borne diseases: A mixed-method study in Curaçao.PLoS Negl Trop Dis. 2020 Apr 13;14(4):e0008136. doi: 10.1371/journal.pntd.0008136. eCollection 2020 Apr. PLoS Negl Trop Dis. 2020. PMID: 32282848 Free PMC article.
-
Seasonality in the incidence of anti-GQ1b antibody syndrome-A territory-wide study.Brain Behav. 2021 Oct;11(10):e2337. doi: 10.1002/brb3.2337. Epub 2021 Sep 6. Brain Behav. 2021. PMID: 34487633 Free PMC article.
-
Predict the incidence of Guillain Barré Syndrome and arbovirus infection in Mexico, 2014-2019.PLOS Glob Public Health. 2022 Mar 25;2(3):e0000137. doi: 10.1371/journal.pgph.0000137. eCollection 2022. PLOS Glob Public Health. 2022. PMID: 36962143 Free PMC article.
-
Large-scale Lassa fever outbreaks in Nigeria: quantifying the association between disease reproduction number and local rainfall.Epidemiol Infect. 2020 Jan 10;148:e4. doi: 10.1017/S0950268819002267. Epidemiol Infect. 2020. PMID: 31918780 Free PMC article.
References
-
- Willison HJ, Jacobs BC, van Doorn PA. Guillain-Barre syndrome. Lancet. 2016;388:717–27. doi: 10.1016/S0140-6736(16)00339-1 - DOI - PubMed
-
- Wakerley BR, Yuki N. Infectious and noninfectious triggers in Guillain-Barre syndrome. Expert Rev Clin Immunol. 2013;9:627–39. doi: 10.1586/1744666X.2013.811119 - DOI - PubMed
-
- de Oliveira WK, Carmo EH, Henriques CM, Coelho G, Vazquez E, Cortez-Escalante J, et al. Zika Virus Infection and Associated Neurologic Disorders in Brazil. N Engl J Med. 2017; 376:1591–1593. doi: 10.1056/NEJMc1608612 - DOI - PMC - PubMed
-
- Pettersson JH, Eldholm V, Seligman SJ, Lundkvist A, Falconar AK, Gaunt MW, et al. How Did Zika Virus Emerge in the Pacific Islands and Latin America? MBio. 2016;7(5). pii:e01239–16. doi: 10.1128/mBio.01239-16 - DOI - PMC - PubMed
-
- Cao-Lormeau VM, Blake A, Mons S, Lastere S, Roche C, Vanhomwegen J, et al. Guillain-Barre Syndrome outbreak associated with Zika virus infection in French Polynesia: a case-control study. Lancet. 2016; 387:1531–9. doi: 10.1016/S0140-6736(16)00562-6 - DOI - PMC - PubMed
MeSH terms
LinkOut - more resources
Full Text Sources
Other Literature Sources
Medical
