

A unique plasma microRNA profile defines type 2 diabetes progression
- PMID: 29200427
- PMCID: PMC5714331
- DOI: 10.1371/journal.pone.0188980
A unique plasma microRNA profile defines type 2 diabetes progression
Abstract
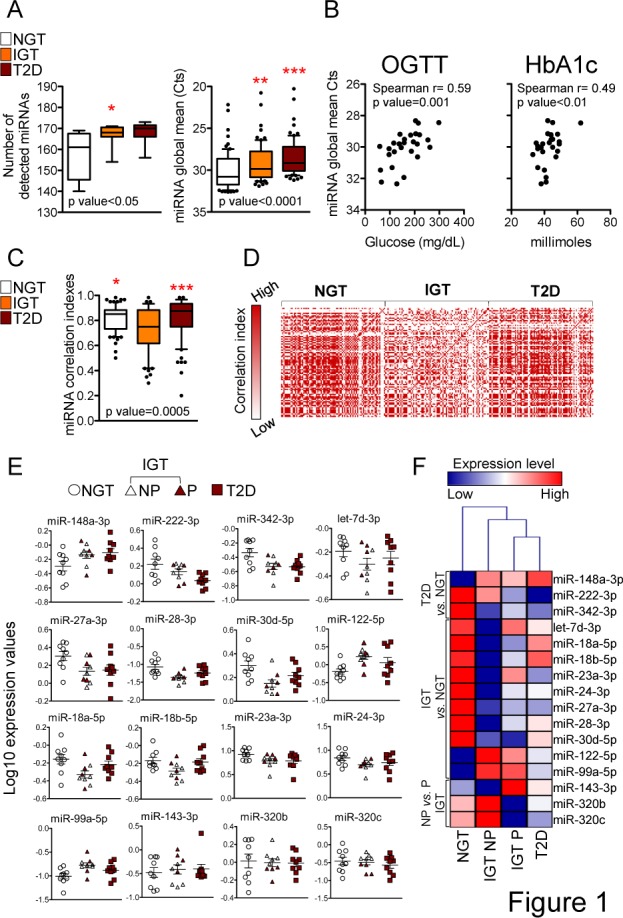
A major unmet medical need to better manage Type 2 Diabetes (T2D) is the accurate disease prediction in subjects who show glucose dysmetabolism, but are not yet diagnosed as diabetic. We investigated the possibility to predict/monitor the progression to T2D in these subjects by retrospectively quantifying blood circulating microRNAs in plasma of subjects with i) normal glucose tolerance (NGT, n = 9); ii) impaired glucose tolerance (IGT, n = 9), divided into non-progressors (NP, n = 5) and progressors (P, n = 4) based on subsequent diabetes occurrence, and iii) newly diagnosed T2D (n = 9). We found that impaired glucose tolerance associated with a global increase of plasma circulating microRNAs. While miR-148 and miR-222 were specifically modulated in diabetic subjects and correlated with parameters of glucose tolerance, the most accentuated microRNA dysregulation was found in NP IGT subjects, with increased level of miR-122, miR-99 and decreased level of let-7d, miR-18a, miR-18b, miR-23a, miR-27a, miR-28 and miR-30d in comparison with either NGT or T2D. Interestingly, several of these microRNAs significantly correlated with parameters of cholesterol metabolism. In conclusion, we observed the major perturbation of plasma circulating microRNA in NP pre-diabetic subjects and identified a unique microRNA profile that may become helpful in predicting diabetic development.
Conflict of interest statement
Figures

Similar articles
-
Significance of serum microRNAs in pre-diabetes and newly diagnosed type 2 diabetes: a clinical study.Acta Diabetol. 2011 Mar;48(1):61-9. doi: 10.1007/s00592-010-0226-0. Epub 2010 Sep 21. Acta Diabetol. 2011. PMID: 20857148
-
Progression from optimal blood glucose and pre-diabetes to type 2 diabetes in a high risk population with or without hypertension in Isfahan, Iran.Diabetes Res Clin Pract. 2015 Jun;108(3):414-22. doi: 10.1016/j.diabres.2015.03.002. Epub 2015 Mar 13. Diabetes Res Clin Pract. 2015. PMID: 25814432
-
Dysregulated miR-103 and miR-143 expression in peripheral blood mononuclear cells from induced prediabetes and type 2 diabetes rats.Gene. 2015 Nov 1;572(1):95-100. doi: 10.1016/j.gene.2015.07.015. Epub 2015 Jul 8. Gene. 2015. PMID: 26164754
-
miRNAs as biomarkers for diagnosis of type 2 diabetes: A systematic review.J Diabetes. 2021 Oct;13(10):792-816. doi: 10.1111/1753-0407.13166. Epub 2021 Mar 21. J Diabetes. 2021. PMID: 33576054
-
Circulating microRNA as a diagnostic marker in populations with type 2 diabetes mellitus and diabetic complications.J Chin Med Assoc. 2015 Apr;78(4):204-11. doi: 10.1016/j.jcma.2014.11.002. Epub 2014 Dec 16. J Chin Med Assoc. 2015. PMID: 25529478 Review.
Cited by
-
MicroRNAs as Biomarkers for Coronary Artery Disease Related to Type 2 Diabetes Mellitus-From Pathogenesis to Potential Clinical Application.Int J Mol Sci. 2022 Dec 29;24(1):616. doi: 10.3390/ijms24010616. Int J Mol Sci. 2022. PMID: 36614057 Free PMC article. Review.
-
MicroRNA-423 may regulate diabetic vasculopathy.Clin Exp Med. 2019 Nov;19(4):469-477. doi: 10.1007/s10238-019-00573-8. Epub 2019 Aug 17. Clin Exp Med. 2019. PMID: 31422516
-
Sex Differences in Plasma MicroRNA Biomarkers of Early and Complicated Diabetes Mellitus in Israeli Arab and Jewish Patients.Noncoding RNA. 2019 Apr 5;5(2):32. doi: 10.3390/ncrna5020032. Noncoding RNA. 2019. PMID: 30959814 Free PMC article.
-
Anti-inflammatory effects of kawakawa (Piper excelsum): An integrative mRNA-miRNA approach.Food Sci Nutr. 2024 Sep 10;12(11):8858-8869. doi: 10.1002/fsn3.4450. eCollection 2024 Nov. Food Sci Nutr. 2024. PMID: 39619950 Free PMC article.
-
Milk Exosomal microRNAs: Postnatal Promoters of β Cell Proliferation but Potential Inducers of β Cell De-Differentiation in Adult Life.Int J Mol Sci. 2022 Sep 29;23(19):11503. doi: 10.3390/ijms231911503. Int J Mol Sci. 2022. PMID: 36232796 Free PMC article. Review.
References
-
- Lindstrom J, Tuomilehto J. The diabetes risk score: a practical tool to predict type 2 diabetes risk. Diabetes Care. 2003;26(3):725–31. . - PubMed
-
- Franciosi M, De Berardis G, Rossi MC, Sacco M, Belfiglio M, Pellegrini F, et al. Use of the diabetes risk score for opportunistic screening of undiagnosed diabetes and impaired glucose tolerance: the IGLOO (Impaired Glucose Tolerance and Long-Term Outcomes Observational) study. Diabetes Care. 2005;28(5):1187–94. . - PubMed
-
- Maynard JD, Rohrscheib M, Way JF, Nguyen CM, Ediger MN. Noninvasive type 2 diabetes screening: superior sensitivity to fasting plasma glucose and A1C. Diabetes Care. 2007;30(5):1120–4. doi: 10.2337/dc06-2377 . - DOI - PubMed
-
- American Diabetes A. Diagnosis and classification of diabetes mellitus. Diabetes Care. 2006;29 Suppl 1:S43–8. . - PubMed
-
- Reid G, Kirschner MB, van Zandwijk N. Circulating microRNAs: Association with disease and potential use as biomarkers. Crit Rev Oncol Hematol. 2011;80(2):193–208. Epub 2010/12/15. doi: 10.1016/j.critrevonc.2010.11.004 . - DOI - PubMed
Publication types
MeSH terms
Substances
LinkOut - more resources
Full Text Sources
Other Literature Sources
Medical
Miscellaneous
