. 2017 Dec 4;12(12):e0188003.
doi: 10.1371/journal.pone.0188003. eCollection 2017.

A model of individualized canonical microcircuits supporting cognitive operations

Affiliations

A model of individualized canonical microcircuits supporting cognitive operations

Tim Kunze et al. PLoS One. .

Abstract

Major cognitive functions such as language, memory, and decision-making are thought to rely on distributed networks of a large number of basic elements, called canonical microcircuits. In this theoretical study we propose a novel canonical microcircuit model and find that it supports two basic computational operations: a gating mechanism and working memory. By means of bifurcation analysis we systematically investigate the dynamical behavior of the canonical microcircuit with respect to parameters that govern the local network balance, that is, the relationship between excitation and inhibition, and key intrinsic feedback architectures of canonical microcircuits. We relate the local behavior of the canonical microcircuit to cognitive processing and demonstrate how a network of interacting canonical microcircuits enables the establishment of spatiotemporal sequences in the context of syntax parsing during sentence comprehension. This study provides a framework for using individualized canonical microcircuits for the construction of biologically realistic networks supporting cognitive operations.


Conflict of interest statement

Competing Interests: The authors have declared that no competing interests exist.

Figures

Fig 1
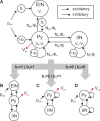
Fig 1. Generalized architecture of the neural mass model.
A) The neural mass model accounts for excitatory interneurons (EIN), inhibitory interneurons (IIN), and pyramidal cells (Py). The architectural parameter b1 controls the deployment of direct and indirect excitatory feedback as well as the input receiving population, whereas the consideration of inhibitory collaterals is governed by the architectural parameter b2. This parameterization allows for a comparative investigation of relevant changes in the dynamical behavior among the three distinct architectures: B) a three-population model, C) a two-population model, and D) a two-population model with recurrent inhibitory feedback of the IIN. The transmitted mean firing rates φ(t) are scaled by connectivity gains Nab between the source population, b, and the targeted population, a, respectively. The membrane potential of the pyramidal cells, Vpy(t) = V2(t)-V3(t), represents the output of the model (indicated by red arrows), detectable, for example, by EEG.
Fig 2
Fig 2. Stimulation principle and categorization of the dynamic response behavior.
A) The model received a rectangular stimulation of varying intensity and duration (green line). The maximum of the mean membrane potential of the pyramidal cell population (blue line) was recorded in three time windows, i.e. prestimulus window, immediate response window, and the asymptotic window (gray shaded areas). To classify the response behavior, these activation values were compared to a threshold of 4mV (red horizontal line, uth) in each window–‘0’ denoting a subthreshold activation and ‘1’ denoting an activation exceeding the threshold. B) The combined evaluation of the activities (e.g., ‘0-1-1’) led to three distinct classes of response behaviors: memory, transfer, and nonresponsive behavior. For the plotted curves we used b1 = 1, b2 = 1, He = 3.25mV, and Hi = 22mV.
Fig 3
Fig 3. Aspects of the models’ responsiveness to afferent stimuli arriving at the EIN of the three population model.
A) Depending on the salience of the applied stimuli in terms of duration and intensity, three distinct response behaviors were observed: (1) a nonresponsive behavior following weak and brief stimulation, where the Py’s membrane potential, VPy, responds only with a small deflection below a firing threshold, see impulse (i), (2) a transfer behavior following a strong and brief stimulation, where VPy exceeds a firing threshold, see impulse (ii), and (3) a memory behavior following longer stimulation of medium intensity, see impulse (iii), for which the system can settle down on a stable state of higher activation. In this state the system is insensitive to further stimuli, or noise, (see impulse (iv)), but can be actively reset through a weak and brief impulse to the IIN, clearing the memory trace, see impulse (v). Please note that this IIN impulse was enlarged by a factor of 20 to improve clarity. B) The response behaviors depend on the salience of the input. A nonresponsive behavior is shown for intensities below 78s-1 (green region). Exceeding this intensity, a longer stimulus is able to reliably evoke the memory behavior (orange region). The shorter the stimulus the more likely the transfer behavior (grey region) becomes, where the stripe-like patterns signify a dependency of the behavior (transfer or memory) on the phase relation between stimulus switch-off time and the intrinsic system oscillation. For the plotted curves we used b1 = 1, b2 = 1, He = 3.25mV, and Hi = 22mV.
Fig 4
Fig 4. Dynamics of the distinct response behaviors in a projection of the state space.
A) The S-shaped fixed point curve features stable (solid line) and unstable (dashed line) fixed points for varying input strengths to the EIN. Two fold bifurcations (saddle-node and saddle-saddle) and a subcritical Hopf bifurcation were identified. B-D) Projections of the response behaviors in the bifurcation diagrams with inlets illustrating state space trajectories and the respective time courses: nonresponsive (B), transfer (C), and memory (D) behavior. Note that VPy(t) = V2(t)-V3(t). Color-coding distinguishes prestimulus (red), response (blue), and asymptotic (green) mean membrane potentials.
Fig 5
Fig 5. Dynamic function map for the indirect excitatory feedback architecture (see Fig 1B).
Collection of characteristic fingerprints for varying excitatory (He) and inhibitory (Hi) synaptic gains. Colors code the observed response behaviors: nonresponsive (bright green, anthracite and cyan regions), transfer (grey regions), and memory (orange and rose regions). The local network balance controls the dominance of the behaviors and tunes the criticality of the system. See S4 Fig for a duplication of this figure, extended by explanatory state space diagrams.
Fig 6
Fig 6. Two parameter bifurcation plot of the three-population model.
A) The plot characterizes the existing bifurcations (with respect to pext) at pext = 0 for the indirect excitatory feedback architecture and tracks them through the parameter space spanned by the excitatory and inhibitory synaptic gains He and Hi. The background is colored light red for oscillating behavior in the low state at pext = 0s-1, light blue for non-oscillatory behavior and monostability, and dark blue for no oscillations and bistability. Brown marks at the axis denote default parameter values for He and Hi. The region between the upper (cyan line) and lower (blue line) fold bifurcations and the Hopf bifurcation (purple/orange curve) exhibits bistability, where memory behavior is possible and He and Hi tune robustness and sensitivity of the system. Signs + and–indicate whether the particular fold bifurcation is located at positive or negative values relative to the working point. The solid purple line denotes the supercritical Hopf bifurcation branch. The dashed orange line denotes the subcritical Hopf bifurcation branch, which is important for the transfer behavior of the system. Together, the branches mark the border between dominant regions of memory and transfer behavior (compare S4 Fig). B)-G) Bifurcation diagrams characterizing stable and unstable fixed points for a broad range of input values.
Fig 7
Fig 7. Dynamic function map for the direct excitatory feedback architecture (see Fig 1C).
Collection of characteristic fingerprints for varying excitatory (He) and inhibitory (Hi) synaptic gains. Colors code the observed response behaviors: nonresponsive (bright green and anthracite), transfer (grey), and memory (orange). The variety of observed behaviors is reduced compared to the three-population case (Fig 5). However, all three main types are observable. See S5 Fig for a duplication of this figure, extended by explanatory state space diagrams.
Fig 8
Fig 8. Two parameter bifurcation plot of the two-population model.
The plot characterizes the existing bifurcations at pext = 0s-1 for the direct excitatory feedback architecture and tracks them through the parameter space spanned by the excitatory and inhibitory synaptic gains He and Hi. The region between the upper (cyan line) and lower (blue line) fold bifurcation branch limits the region where a bistable fixed point curve is obtained. However, the subcritical Hopf bifurcation (purple line) renders parts of the fixed point curve instable and prevents an actual bistability at pext = 0s-1.This suppresses a memory behavior in favor of a transfer behavior (see Fig 7).
Fig 9
Fig 9. Dynamic function map for the two-population model with disinhibition (see Fig 1D).
Collection of characteristic fingerprints for varying excitatory (He) and inhibitory (Hi) synaptic gains. Color-coded are the observed response behaviors: nonresponsive (bright green and anthracite), transfer (grey), and memory (orange). The variety of observed behaviors is reduced compared to the three-population case (Fig 5). However, all three main types are observable. See S6 Fig for a duplication of this figure, extended by explanatory state space diagrams.
Fig 10
Fig 10. Two parameter bifurcation plot for the two-population model with disinhibition (see Fig 1D).
A) The plot characterizes the existing bifurcations at pext = 0 for the direct excitatory feedback architecture with disinhibition and tracks them through the parameter space spanned by the excitatory and inhibitory synaptic gains He and Hi. The region between the upper (cyan line) and lower (blue line) fold bifurcation limits the parameter range for a bistable fixed point curve. These bifurcation branches ranges reflect the borders of nonresponsive, transfer, and memory behavior in Fig 7). B)-D) The single parameter bifurcation plots show the fixed point curve (VPy) and local bifurcations along pext for distinct values of the local network balance.
Fig 11
Fig 11. Sentence processing network for sentence comprehension.
Afferent word information selectively excites a word-representing canonical microcircuit when the respective word is recognized in primary auditory areas. The activated microcircuit, for example representing the word ‘I’ and belonging to the subject module (S), pre-activates words in the connected verb-module (V) and, together with the selective afferent word information, activates another microcircuit (‘eat’). Now, words both in the module of verb-modifiers (V mod.) and in the module of objects (O) are differentially pre-activated by weighted connections. Contextual information is proposed to guide this input-driven structure-building process by modulating the excitability of a targeted microcircuit, such as, in our case, through inhibition.
Fig 12
Fig 12. Neural representation of a perceived sentence by a distributed network of six interacting canonical microcircuits.
A) The network topology features modules (dashed rectangles) containing the six relevant word-representing canonical microcircuits (solid colored rectangles), which are interconnected through excitatory and inhibitory connections of individual strength (B). The line colors consistently reflect the respective words in all panels. C) The interpretation for which the phrase ‘with the club’ refers to an adjective phrase, is guided by contextual information (e.g. knowing that there is a thief bearing a club) which inhibits the module of verb-modifiers. D) For the second interpretation, interpreting ‘with the club’ as an adverbial phrase, contextual information is low and the verb-modifying module remains activated. E, F) In case the local network balance of the microcircuits is biased in favor of inhibitory influences, an accurate structure building fails for both interpretations (E & F) and will lead to misinterpretations, i.e. defective word activation traces (top plots), or memory loss, i.e. no lasting activation trace at all (bottom plots).

Similar articles

Cited by

References

    1. Friederici AD, Singer W. Grounding language processing on basic neurophysiological principles. Trends in cognitive sciences. 2015;19(6):329–38. Epub 2015/04/22. doi: 10.1016/j.tics.2015.03.012 . - DOI - PubMed
    1. Miller KD. Canonical computations of cerebral cortex. Current opinion in neurobiology. 2016;37:75–84. Epub 2016/02/13. doi: 10.1016/j.conb.2016.01.008 ; PubMed Central PMCID: PMCPmc4944655. - DOI - PMC - PubMed
    1. Treves A. Frontal latching networks: a possible neural basis for infinite recursion. Cognitive neuropsychology. 2005;22(3):276–91. Epub 2005/01/01. doi: 10.1080/02643290442000329 . - DOI - PubMed
    1. Mountcastle VB. Modality and topographic properties of single neurons of cat's somatic sensory cortex. Journal of neurophysiology. 1957;20(4):408–34. Epub 1957/07/01. . - PubMed
    1. Lubke J, Feldmeyer D. Excitatory signal flow and connectivity in a cortical column: focus on barrel cortex. Brain structure & function. 2007;212(1):3–17. Epub 2007/08/25. doi: 10.1007/s00429-007-0144-2 . - DOI - PubMed

LinkOut - more resources