Review
. 2017;20(1):5.
doi: 10.1007/s41114-017-0007-y. Epub 2017 Nov 13.

Dynamical boson stars

Affiliations
Review

Dynamical boson stars

Steven L Liebling et al. Living Rev Relativ. 2017.

Abstract

The idea of stable, localized bundles of energy has strong appeal as a model for particles. In the 1950s, John Wheeler envisioned such bundles as smooth configurations of electromagnetic energy that he called geons, but none were found. Instead, particle-like solutions were found in the late 1960s with the addition of a scalar field, and these were given the name boson stars. Since then, boson stars find use in a wide variety of models as sources of dark matter, as black hole mimickers, in simple models of binary systems, and as a tool in finding black holes in higher dimensions with only a single Killing vector. We discuss important varieties of boson stars, their dynamic properties, and some of their uses, concentrating on recent efforts.

Keywords: Boson stars; Numerical relativity; Solitons.


Figures
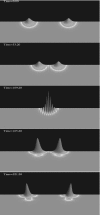
Fig. 1
Fig. 1
Demonstration of the solitonic nature of the (mini-)boson star. Shown are snapshots of the magnitude squared of the complex scalar field for a head-on collision of two identical mini-boson stars. The interacting stars display an interference pattern as they pass through each other, recovering their individual identities after the collision. However, note that the BSs have a larger amplitude after their interaction and so are not true solitons. The collision can therefore be considered inelastic. Reprinted with permission from Choi et al. (2009). See also Lai (2004) (e.g., Figure 5.12)
Fig. 2
Fig. 2
Profiles characterizing static, spherically symmetric boson stars with a few different values of the central scalar field (top left). Reprinted with permission from Lai (2004)
Fig. 3
Fig. 3
Left: The mass of the boson star as a function of the central value of the scalar field in adimensional units σc=4πGϕc. Right: Maximum mass as a function of Λ (squares) and the asymptotic Λ relation of Eq. (52) (solid curve). Reprinted with permission from Colpi et al. (1986); copyright by APS
Fig. 4
Fig. 4
The compactness of a stable boson star (black solid line) as a function of the adimensional self-interaction parameter Λλ/4πGm2. The compactness is shown for the most massive stable star (the most compact BS is unstable). This compactness asymptotes for Λ to the value indicated by the red, dashed line. Also shown for comparison is the compactness of a Schwarzschild BH (green dot-dashed line), and the maximum compactness of a non-spinning neutron star (blue dotted line). Reprinted with permission from Amaro-Seoane et al. (2010); copyright by IOP
Fig. 5
Fig. 5
The mass (solid) and the number of particles (dashed) versus central scalar value for charged boson stars with four values of e~ as defined in Sect. 3.3. The mostly-vertical lines crossing the four plots indicate the solution for each case with the maximum mass (solid) and maximum particle number (dashed). Reprinted with permission from Jetzer and van der Bij (1989); copyright by Elsevier
Fig. 6
Fig. 6
Top: Total mass (in units of MPlanck2/m) and fundamental frequency of an oscillaton as a function of the central value of the scalar field ϕ1(r=0). The maximum mass is Mmax=0.607MPlanck2/m. Bottom: Plot of the total mass versus the radius at which grr achieves its maximum. Reprinted with permission from Alcubierre et al. (2003); copyright by IOP
Fig. 7
Fig. 7
The scalar field in cylindrical coordinates ϕ(ρ,z) for two rotating boson-star solutions: (left) k=1 and (right) k=2. The two solutions have roughly comparable amplitudes in scalar field. Note the toroidal shape. Reprinted with permission from Lai (2004)
Fig. 8
Fig. 8
Initial data of a mixed fermion–boson star with fixed total mass MT=1.4. The numbers of fermions, NF, and bosons, N (denoted NB in the figure, but just N in this text), in terms of the central density, ρc, are plotted. The position of the maximum of N (and correspondingly the minimum of NF) represents the critical point, with a maximum value N/NF=12%, which separates the stable and the unstable solutions. The two configurations marked, one on each side of the maximum/minimum, correspond to N/NF10%. Reprinted with permission from Valdez-Alvarado et al. (2013); copyright by APS
Fig. 9
Fig. 9
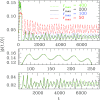
Left: The maximum of the central value of each of the two scalar fields constituting the multi-state BS for the fraction η=3, where ηN(2)/N(1) defines the relative “amount” of each state. Right: The frequencies associated with each of the two states of the multi-state BS. At t=2000, there is a flip in which the excited state (black solid) decays and the scalar field in the ground state (red dashed) becomes excited. Discussed in Sect. 3.7. Reprinted with permission from Bernal et al. (2010); copyright by APS
Fig. 10
Fig. 10
Comparison of Proca solutions with boson stars. The ADM mass of spherical Proca solutions (solid) and scalar BS solutions (dashed) are shown versus oscillation frequency. Here, the mass is expressed in terms of the field mass, μ. Although the profiles are qualitatively similar, notice that the maximum mass of the Proca solutions is almost twice that of BSs. Reprinted with permission from Sanchis-Gual et al. (2017); copyright by APS
Fig. 11
Fig. 11
Domain of existence for hairy black holes. The ADM mass of the solutions versus the oscillation frequency of the scalar field frequency. Solutions for a range of values of q interpolating between Kerr (q=0) and BSs (q=1) all with azimuthal quantum number m=1. For 0<q<1, solutions describe rotating BHs surrounded by a scalar cloud, constituting scalar hair for the BH. Reprinted with permission from Herdeiro and Radu (2015a); copyright by IOP
Fig. 12
Fig. 12
Oscillation frequencies of various boson stars are plotted against their mass. Also shown are the oscillation frequencies of unstable BSs obtained from the fully nonlinear evolution of the dynamical system. Unstable BSs are observed maintaining a constant frequency as they approach a stable star configuration. Reprinted with permission from Seidel and Suen (1990); copyright by APS
Fig. 13
Fig. 13
The instability time scale of an excited boson star (the first excitation) to one of three end states: (i) decay to the ground state, (ii) collapse to a black hole, or (iii) dispersal. Reprinted with permission from Balakrishna et al. (1998); copyright by APS
Fig. 14
Fig. 14
Very long evolutions of a perturbed, slightly sub-critical, boson star with differing outer boundaries. The central magnitude of the scalar field is shown. At early times (t<250 and the middle frame), the boson star demonstrates near-critical behavior with small-amplitude oscillations about an unstable solution. For late times (t>250), the solution appears converged for the largest two outer boundaries and suggests that sub-critical boson stars are not dispersing. Instead, they execute large amplitude oscillations about low-density boson stars. Reprinted with permission from Lai and Choptuik (2007)
Fig. 15
Fig. 15
The evolution of r2ρ (where ρ is the energy density of the complex scalar field) with massive field (left) and massless (right). In the massive case, much of the scalar field collapses and a perturbed boson star is formed at the center, settling down by gravitational cooling. In the massless case, the scalar field bounces through the origin and then disperses without forming any compact object. Reprinted with permission from Seidel and Suen (1994); copyright by APS
Fig. 16
Fig. 16
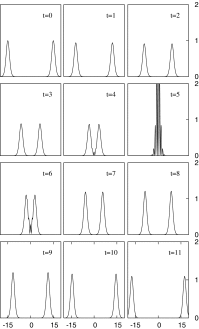
Collision of identical boson stars with large kinetic energy in the Newtonian limit. The total energy (i.e., the sum of kinetic, gravitational and self-interaction) is positive and the collision displays solitonic behavior. Contrast this with the gravity-dominated collision displayed in Fig. 17. Reprinted with permission from Bernal and Guzmán (2006a); copyright by APS
Fig. 17
Fig. 17
Collision of identical boson stars with small kinetic energy in the Newtonian limit. The total energy is dominated by the gravitational energy and is therefore negative. The collision leads to the formation of a single, gravitationally bound object, oscillating with large perturbations. This contrasts with the large kinetic energy case (and therefore positive total energy) displayed in Fig. 16. Reprinted with permission from Bernal and Guzmán (2006a); copyright by APS
Fig. 18
Fig. 18
The position of the center of one BS in a head-on binary as a function of time for (i) [B-B] identical BSs, (ii) [B-poB] opposite phase pair, and (iii) [B-aB] a boson–anti-boson pair. A simple argument is made which qualitatively matches these numerical results, as discussed in Sect. 4.2. Also shown is the expected trajectory from a simple Newtonian two-body estimate. Reprinted with permission from Palenzuela et al. (2007); copyright by APS
Fig. 19
Fig. 19
The position of the center of one BS within an orbiting binary as a function of time for the two cases: (i) [B-B] identical BSs and (ii) [B-poB] opposite phase pair. Notice that the orbits are essentially identical at early times (and large separations), but that they start to deviate from each other on closer approach. This is consistent with the internal structure of each member of the binary being irrelevant at large separations. Reprinted with permission from Palenzuela et al. (2008); copyright by APS
Fig. 20
Fig. 20
Snapshots in time of the Noether charge density in the z=0 plane for head-on binary collisions of compact solitonic boson stars. Each row corresponds to a different boson-boson and boson-anti-boson case studied with a phase shift θ as described by Eq. (90). The collision of the stars occurs approximately at t=28. The result of the boson–boson merger is a single boson star except in the case with θ=π. The stars in the boson–anti-boson case annihilate each other during the merger. Reprinted with permission from Bezares et al. (2017); copyright by APS
Fig. 21
Fig. 21
ADM mass (top panel), angular momentum Jz (middle panel), and Noether charge (bottom panel) as functions of time for the orbital binary collisions of compact solitonic boson stars with different tangential boost velocities. During the coalescence, approximately 5% of the mass and Noether charge is radiated, as well as most of the angular momentum. Reprinted with permission from Bezares et al. (2017); copyright by APS
Fig. 22
Fig. 22
Computed images as might be expected from the EHT for: (left) a Kerr black hole and (right) a fast spinning boson star with accretion according to certain assumptions. The similarity in images indicates that ruling out a BS candidate in images of Sgr A* may prove difficult. Reprinted with permission from Vincent et al. (2016); copyright by IOP
Fig. 23
Fig. 23
Gravitational waves, represented by the l=m=2 mode of the Newman-Penrose scalar, Ψ4, emitted during the head-on collision of two solitonic BSs. For all configurations, the final object is massive enough to promptly collapse to a BH. However, for the boson–boson and boson–anti-boson configurations the late inspiral signatures differ significantly from the corresponding binary black-hole signal. Reprinted with permission from Cardoso et al. (2016); copyright by the authors
Fig. 24
Fig. 24
Evolution of a boson star (solid line) perturbed by a shell of scalar field (dashed line). Shown is the mass density M/r for each contribution. By t100 the real scalar field pulse has departed the central region and perturbed the boson star into an unstable, compact configuration. Contrast the t=0 frame with that of t=97.5 and note the increase in compaction. This unstable BS survives until t500 only because the initial perturbation has been tuned to one part in 1015 and indicates Type I critical behavior. Reprinted with permission from Lai and Choptuik (2007)
Fig. 25
Fig. 25
Evolutions of the head-on collisions of identical boson stars boosted toward each other with initial Lorentz factors γ as indicated. Time flows downward within each column and the top edge displays the axis of symmetry. The color-scale indicates the value of |ϕ|. In the middle frames one sees the interference pattern characteristic of high kinetic energy BS collisions (as mentioned in Fig. 1). In the last column on the right, the collision produces a BH with apparent horizon indicated by the black oval in the third frame. Reprinted with permission from Choptuik and Pretorius (2010); copyright by APS

Similar articles

Cited by

References

    1. Aad G, et al. Observation of a new particle in the search for the standard model Higgs boson with the ATLAS detector at the LHC. Phys Lett B. 2012;716:1–29. doi: 10.1016/j.physletb.2012.08.020. - DOI
    1. Abbott BP, et al. GW151226: observation of gravitational waves from a 22-solar-mass binary black hole coalescence. Phys Rev Lett. 2016;116:241103. doi: 10.1103/PhysRevLett.116.241103. - DOI - PubMed
    1. Abbott BP, et al. Observation of gravitational waves from a binary black hole merger. Phys Rev Lett. 2016;116:061102. doi: 10.1103/PhysRevLett.116.061102. - DOI - PubMed
    1. Abbott BP, et al. Tests of general relativity with GW150914. Phys Rev Lett. 2016;116:221101. doi: 10.1103/PhysRevLett.116.221101. - DOI - PubMed
    1. Abbott BP, et al. Exploring the sensitivity of next generation gravitational wave detectors. Class Quantum Gravity. 2017;34:044001. doi: 10.1088/1361-6382/aa51f4. - DOI

LinkOut - more resources