

Cell-Based Phenotyping Reveals QTL for Membrane Potential Maintenance Associated with Hypoxia and Salinity Stress Tolerance in Barley
- PMID: 29201033
- PMCID: PMC5696338
- DOI: 10.3389/fpls.2017.01941
Cell-Based Phenotyping Reveals QTL for Membrane Potential Maintenance Associated with Hypoxia and Salinity Stress Tolerance in Barley
Abstract
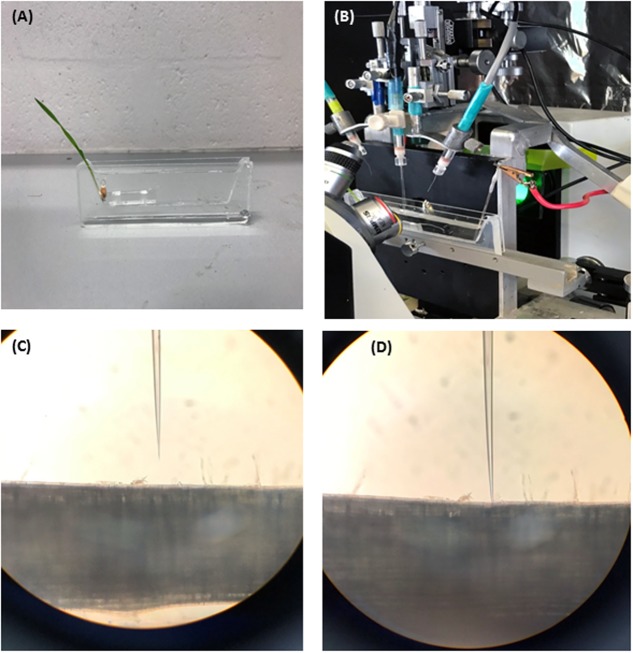
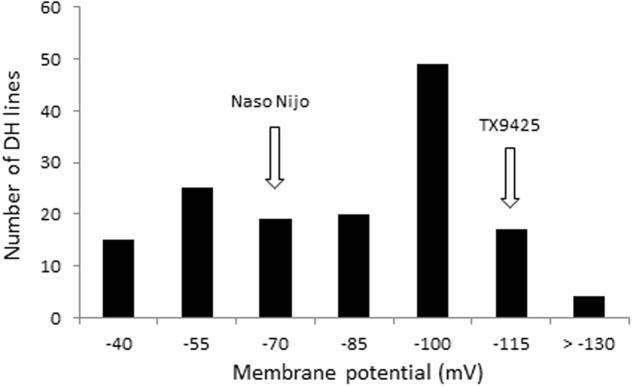
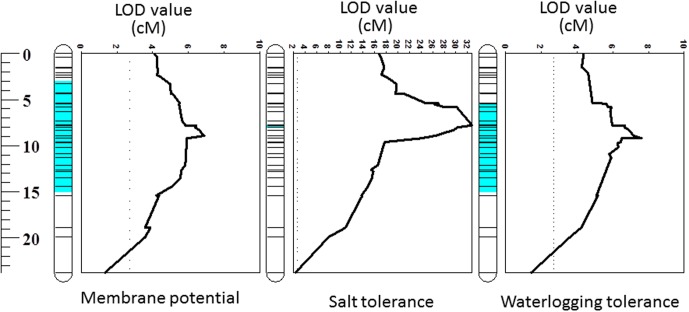
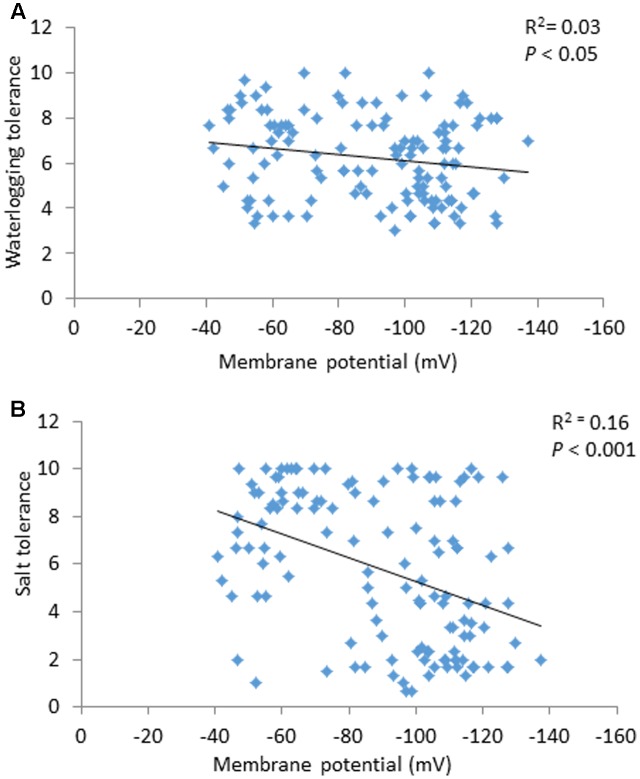
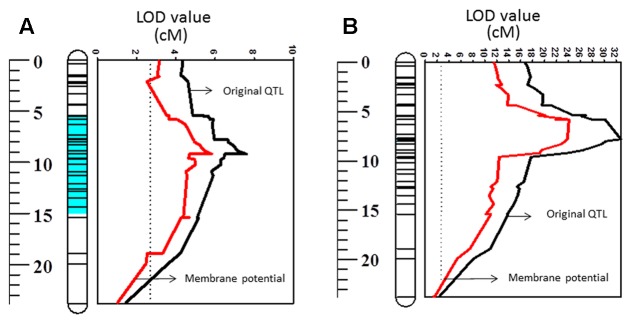
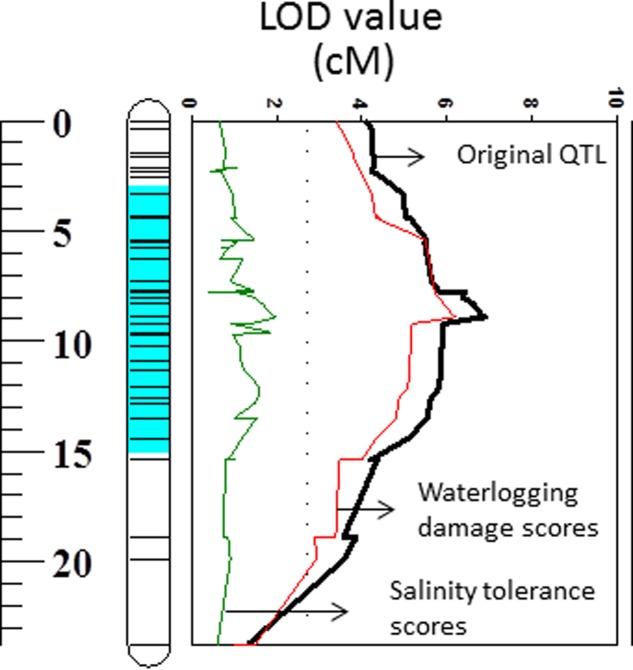
Waterlogging and salinity are two major abiotic stresses that hamper crop production world-wide resulting in multibillion losses. Plant abiotic stress tolerance is conferred by many interrelated mechanisms. Amongst these, the cell's ability to maintain membrane potential (MP) is considered to be amongst the most crucial traits, a positive relationship between the ability of plants to maintain highly negative MP and its tolerance to both salinity and waterlogging stress. However, no attempts have been made to identify quantitative trait loci (QTL) conferring this trait. In this study, the microelectrode MIFE technique was used to measure the plasma membrane potential of epidermal root cells of 150 double haploid (DH) lines of barley (Hordeum vulgare L.) from a cross between a Chinese landrace TX9425 and Japanese malting cultivar Naso Nijo under hypoxic conditions. A major QTL for the MP in the epidermal root cells in hypoxia-exposed plants was identified. This QTL was located on 2H, at a similar position to the QTL for waterlogging and salinity tolerance reported in previous studies. Further analysis confirmed that MP showed a significant contribution to both waterlogging and salinity tolerance. The fact that the QTL for MP was controlled by a single major QTL illustrates the power of the single-cell phenotyping approach and opens prospects for fine mapping this QTL and thus being more effective in marker assisted selection.
Keywords: H+-ATPase; Hordeum vulgare; hypoxia; membrane potential; salinity tolerance; waterlogging tolerance.
Figures
References
-
- Armstrong W., Drew M. (2002). “Root growth and metabolism under oxygen deficiency,” in Plant Roots: The Hidden Half, eds Wasel Y., eshel A., kafkafi U. (New York, NY: Marcel Dekker, Inc.), 729–761.
-
- Arzani A., Ashraf M. (2016). Smart engineering of genetic resources for enhanced salinity tolerance in crop plants. Crit. Rev. Plant Sci. 35 146–189. 10.1080/07352689.2016.1245056 - DOI
-
- Aslam M., Qureshi R., Ahmed N. (1993). A rapid screening technique for salt tolerance in rice (Oryza sativa L.). Plant Soil 150 99–107. 10.1007/BF00779180 - DOI
LinkOut - more resources
Full Text Sources
Other Literature Sources