. 2017 Nov 29:5:e4066.
doi: 10.7717/peerj.4066. eCollection 2017.

An exceptionally preserved armored dinosaur reveals the morphology and allometry of osteoderms and their horny epidermal coverings

Affiliations

An exceptionally preserved armored dinosaur reveals the morphology and allometry of osteoderms and their horny epidermal coverings

Caleb M Brown. PeerJ. .

Abstract

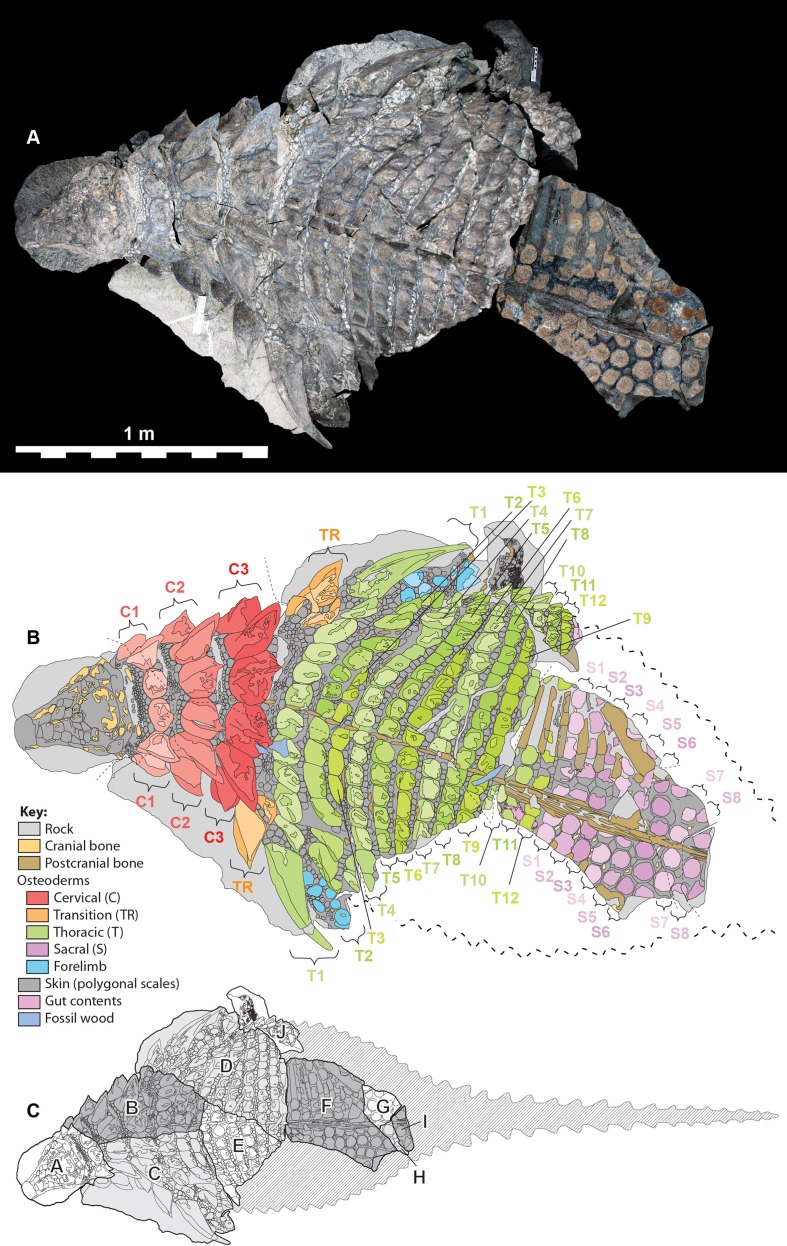
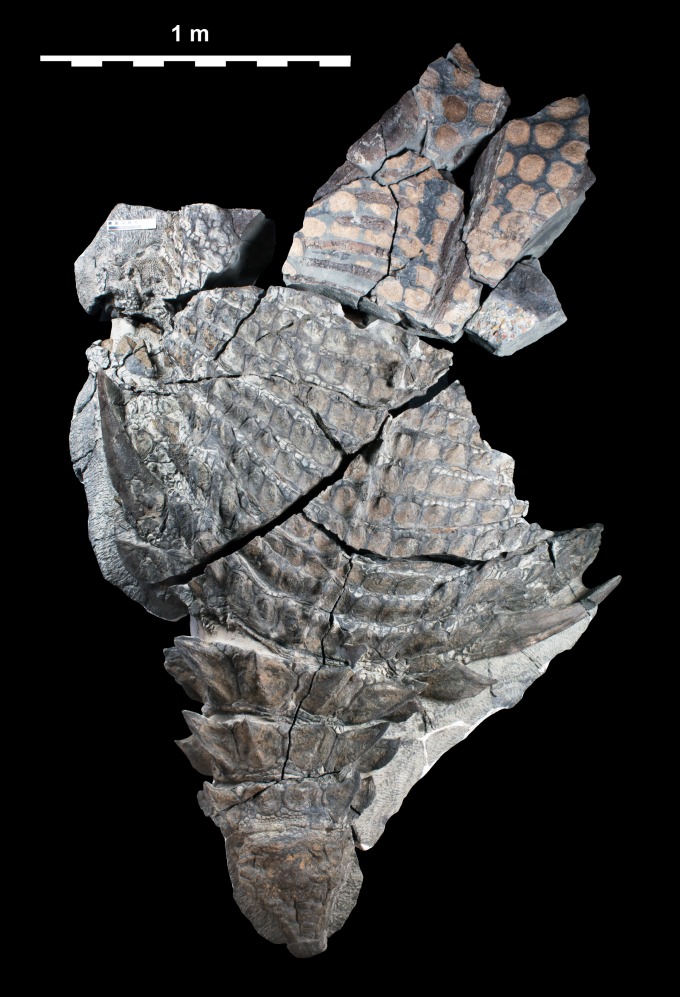
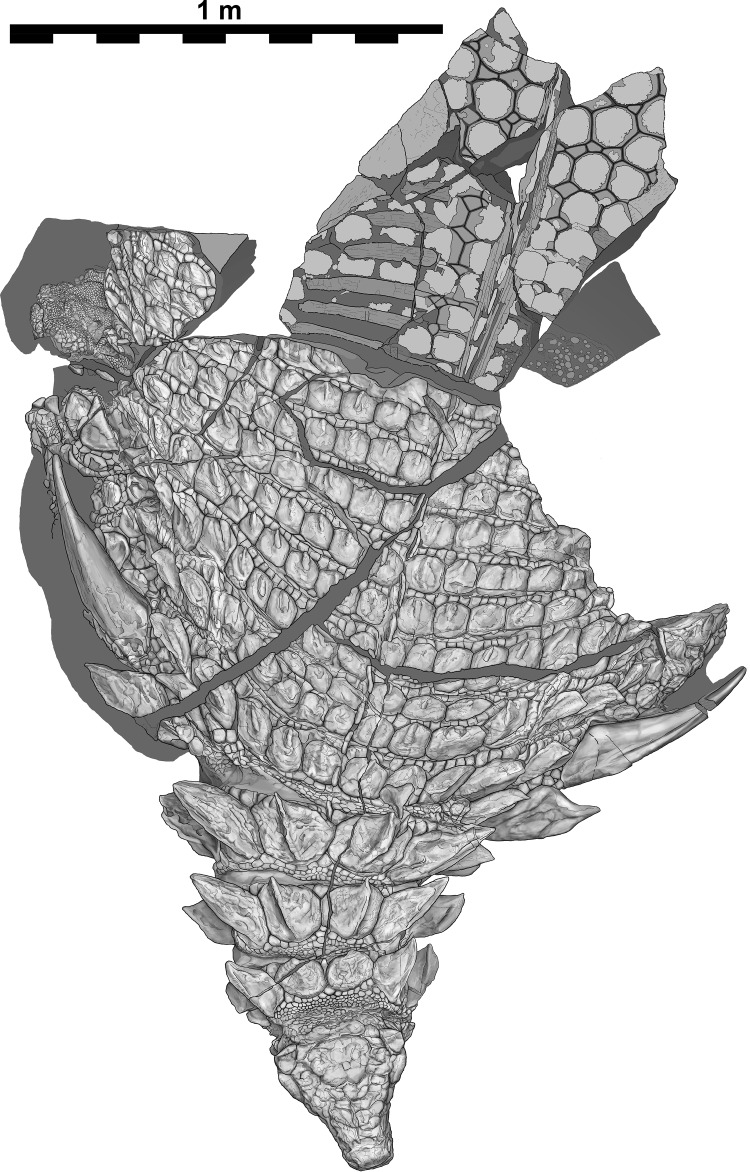
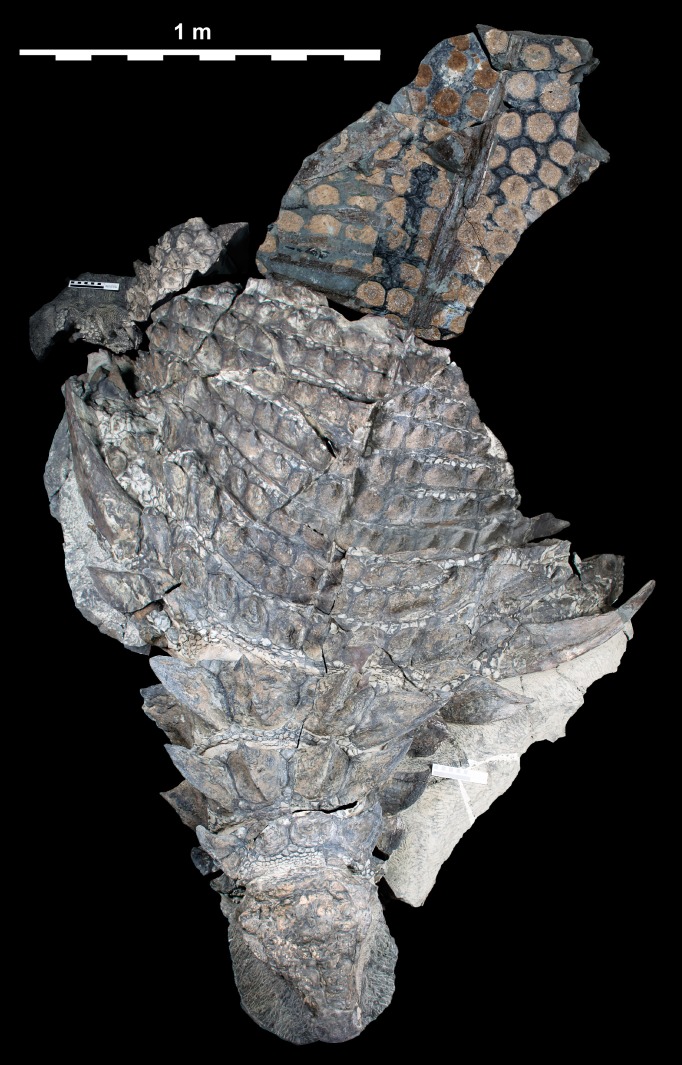
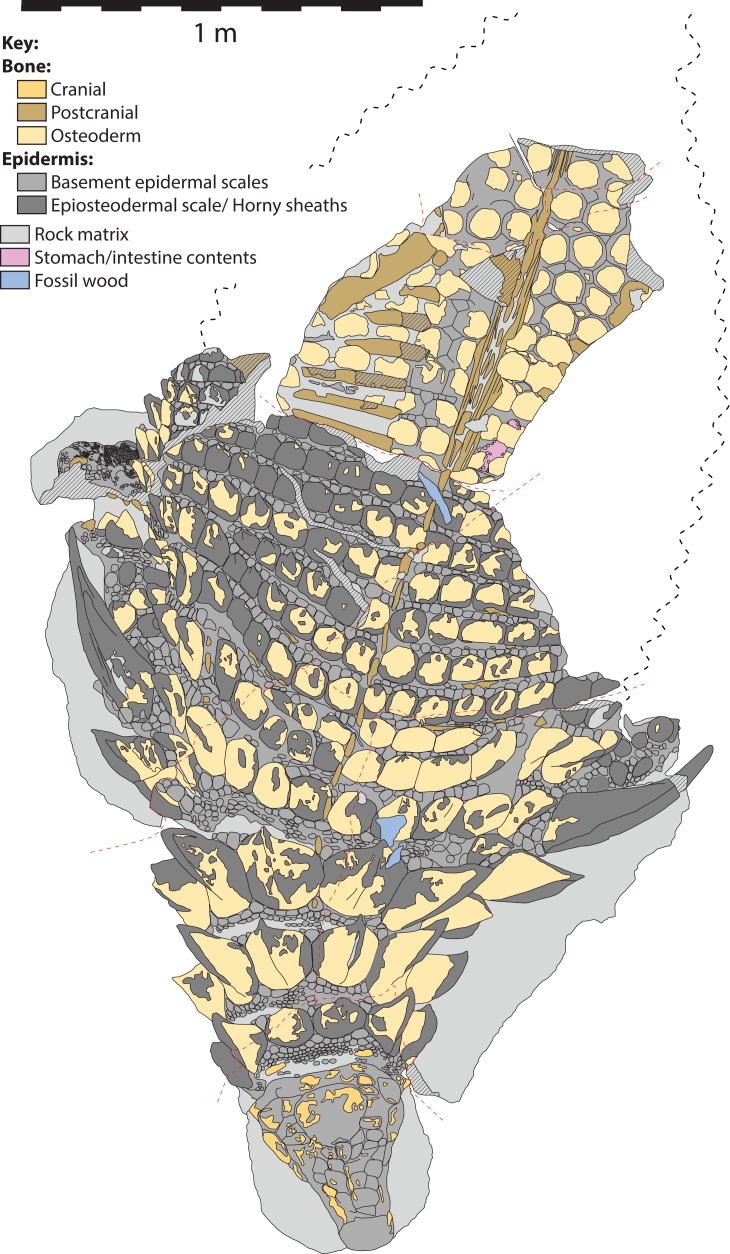
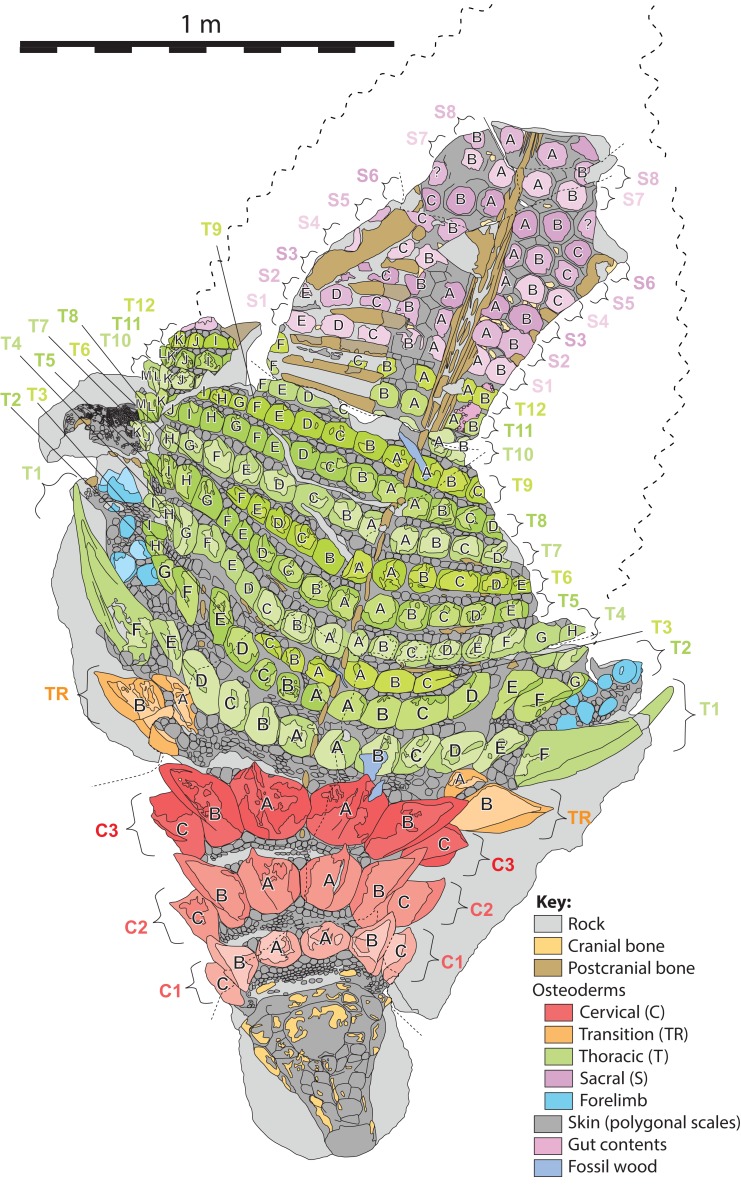
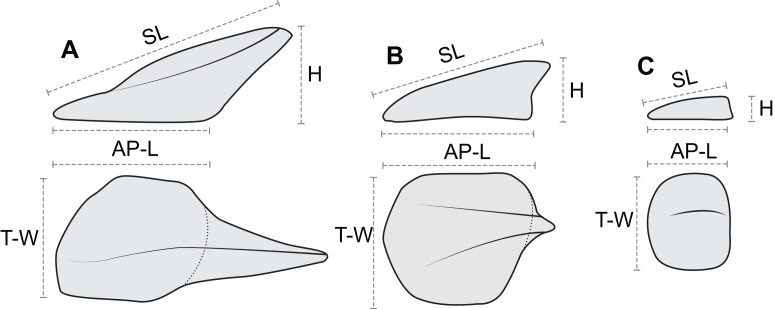
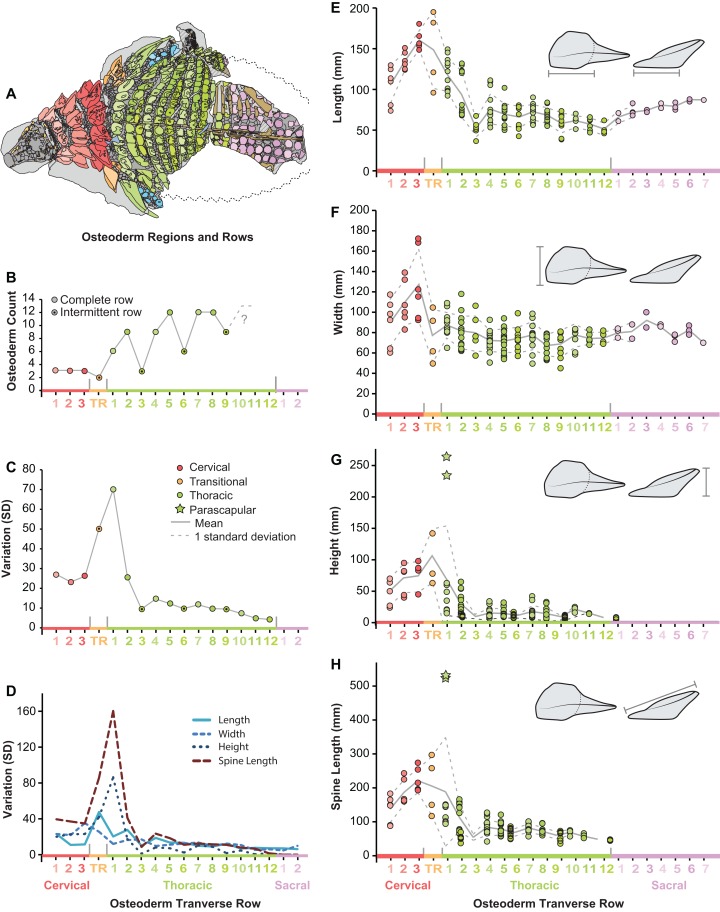
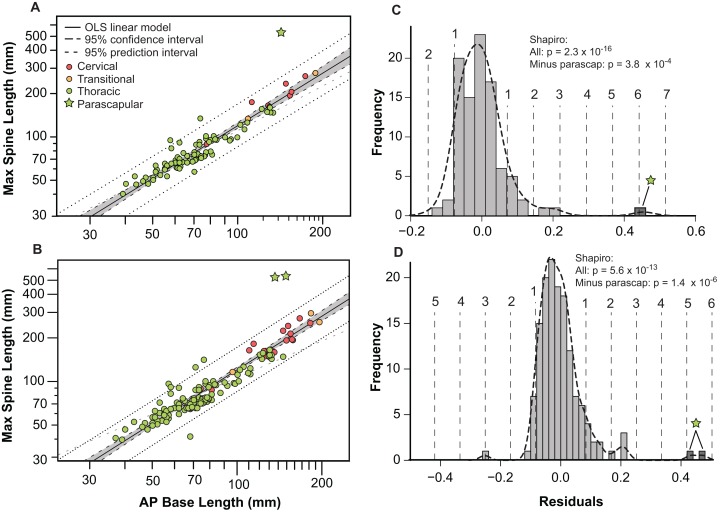
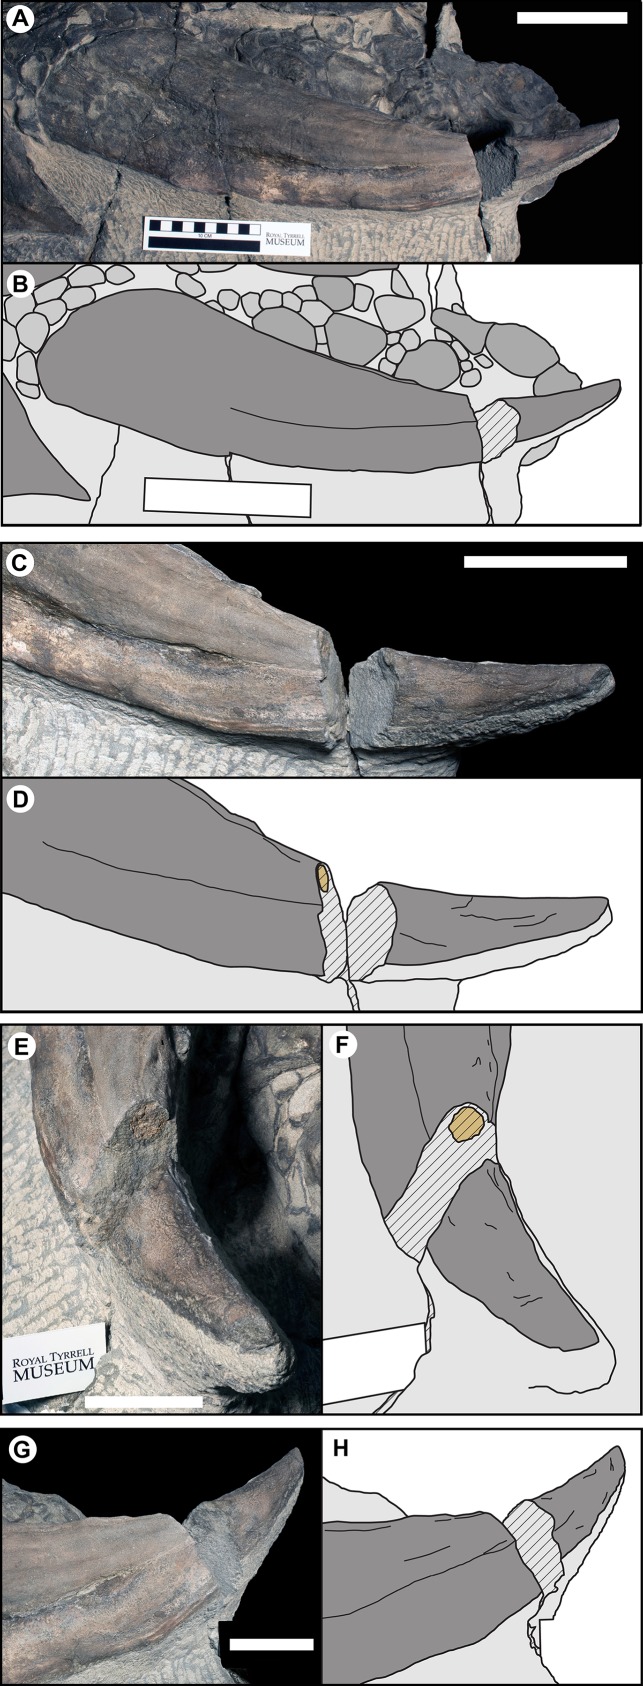
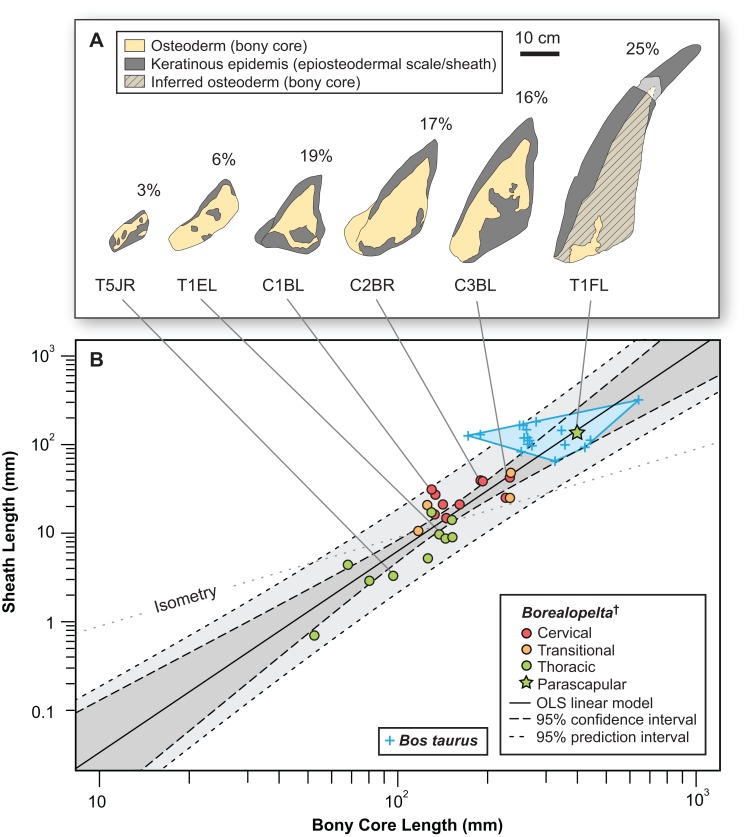
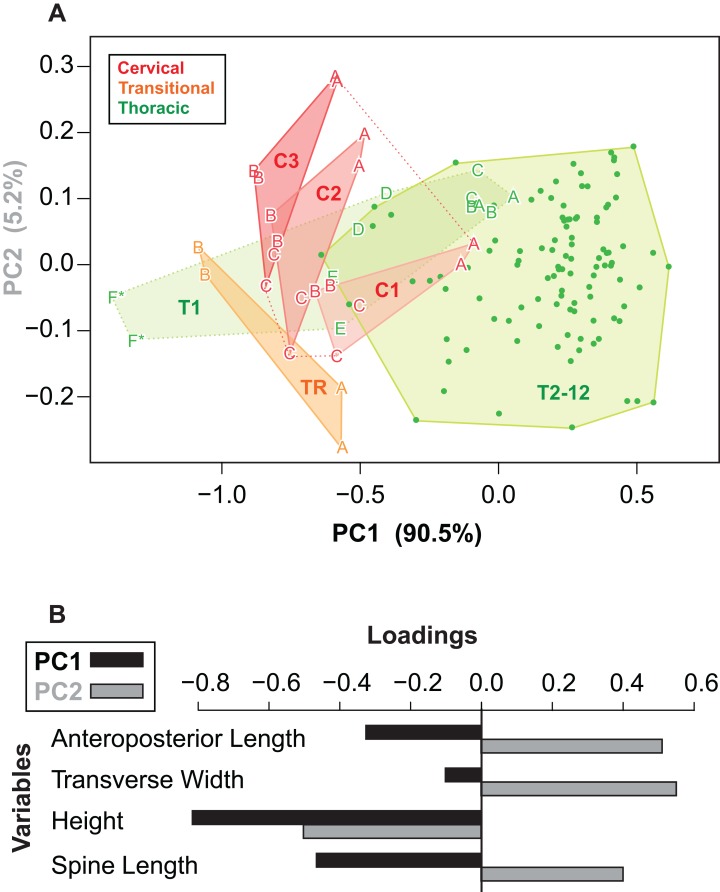
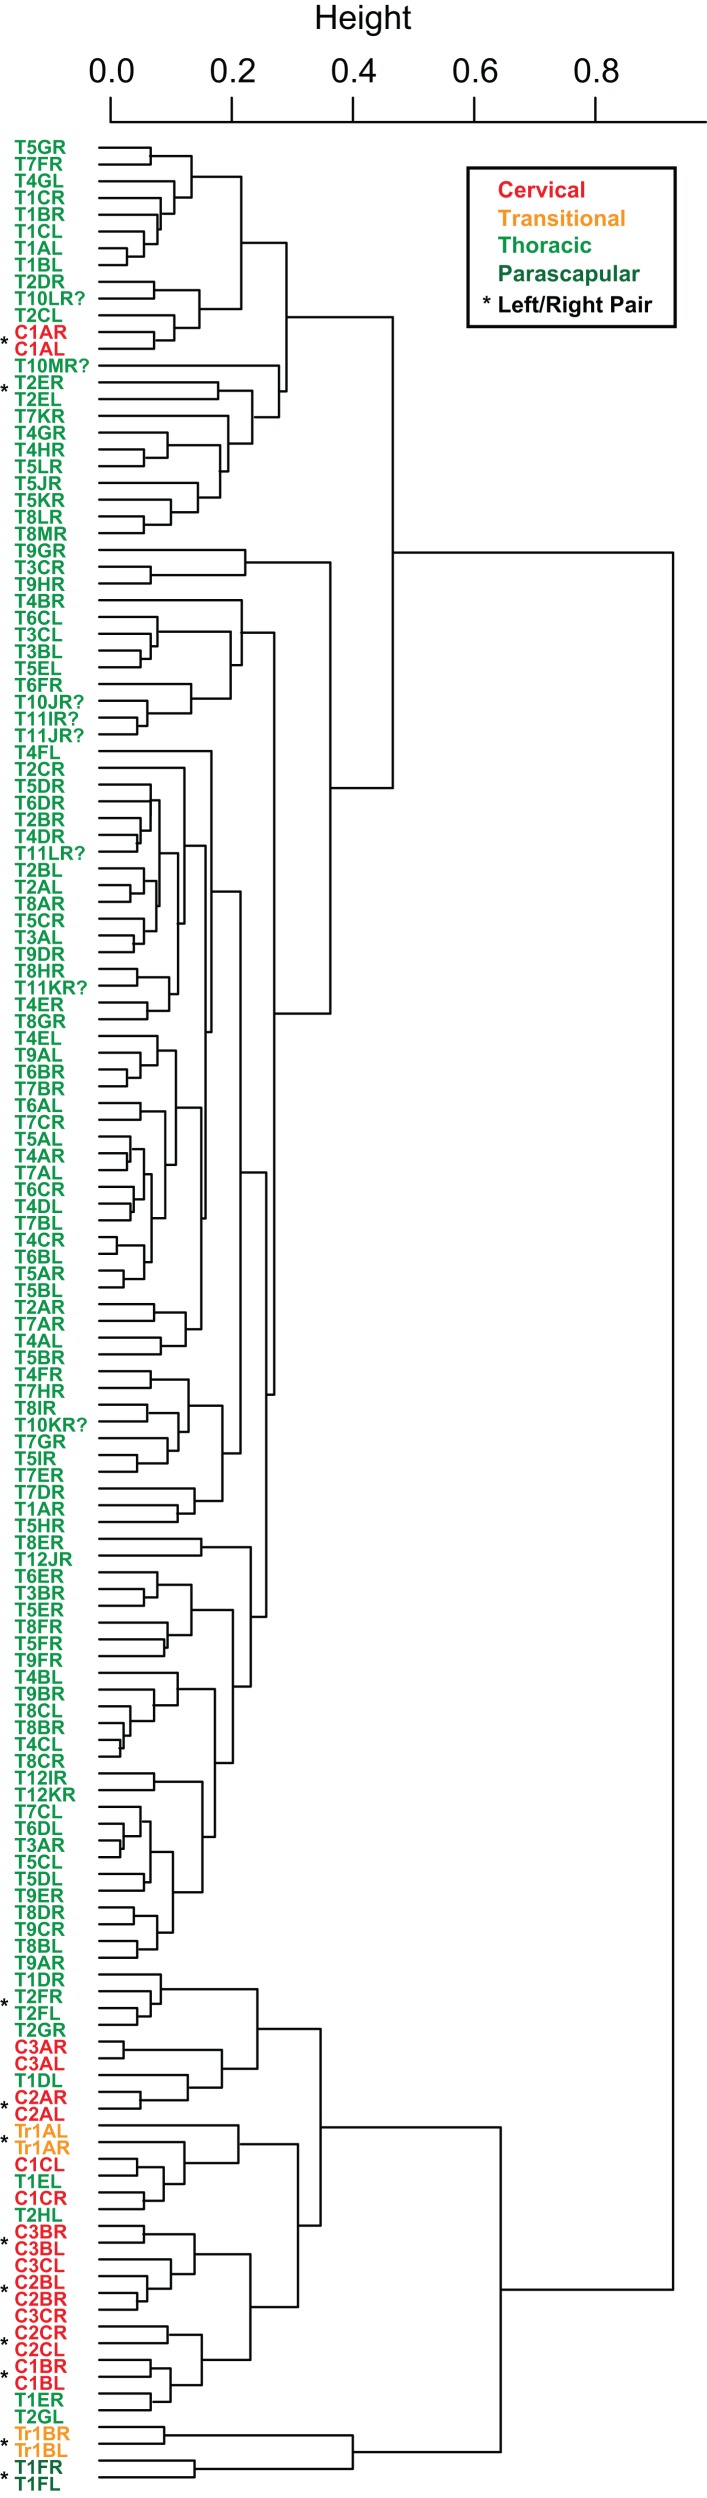
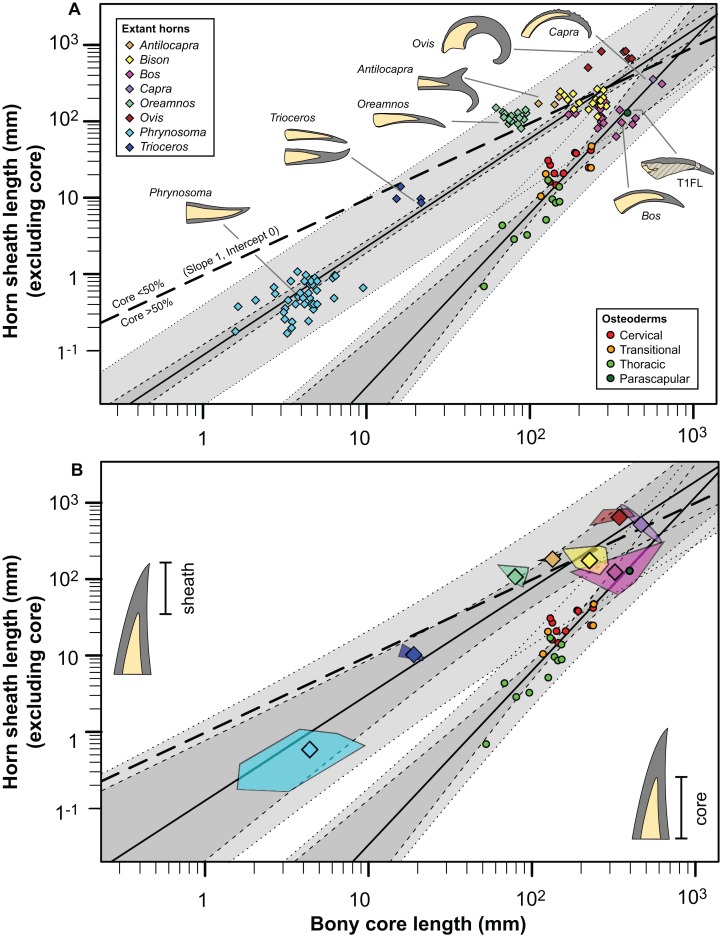
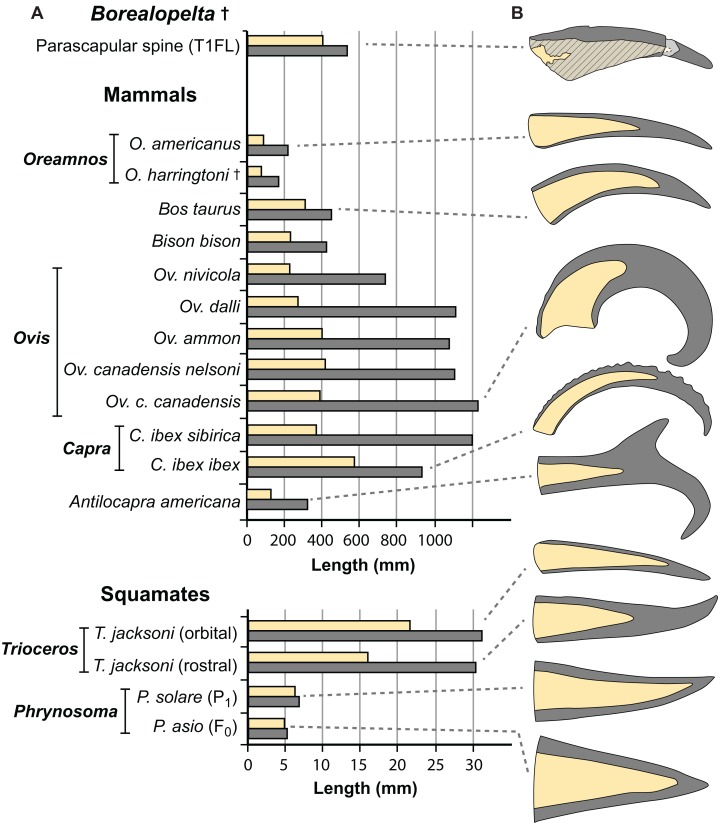
Although the evolution and function of "exaggerated" bony projections in ornithischian dinosaurs has been subject to significant debate recently, our understanding of the structure and morphology of their epidermal keratinized coverings is greatly limited. The holotype of Borealopelta, a new nodosaurid ankylosaur, preserves osteoderms and extensive epidermal structures (dark organic residues), in anatomic position across the entire precaudal length. Contrasting previous specimens, organic epiosteodermal scales, often in the form of horn-like (keratinous) sheaths, cap and exaggerate nearly all osteoderms, allowing for morphometric and allometric analyses of both the bony osteoderms and their horny sheaths. A total of 172 osteoderms were quantified, with osteoderm spine length and height being positively allometric with respect to basal length and width. Despite tight correlations between the different measures amongst all other osteoderms, the large parascapular spines represent consistent outliers. Thickness and relative contribution of the keratinized epiosteodermal scales/sheaths varies greatly by region, ranging from 2% to 6% for posterior thoracics, to ∼25% (1.3×) for the parascapular spines-similar to horn sheaths in some bovid analogues. Relative to the bony cores, the horny portions of the spines are strongly positively allometric (slope = 2.3, CI = 1.8-2.8). Strong allometric scaling, species-specific morphology, and significant keratinous extension of the cervicoscapular spines is consistent with elaboration under socio-sexual selection. This marks the first allometric analysis of ornithischian soft tissues.

Keywords: Allometry; Ankylosauria; Armor; Dinosauria; Epidermis; Keratin; Morphometrics; Ornamentation; Ornithischia; Osteoderm.


Conflict of interest statement

The author declares no competing interests.

Figures

Figure 1
Figure 1. Dorsal view of TMP 2011.033.0001, showing both photocomposite and schematic line drawing.
(A) Photocomposite dorsal view of TMP 2011.033.0001. (B) Schematic line drawing of (A) showing osteoderm regions by color. (C) Inset showing constituent blocks of TMP 2011.033.0001, and their relative position within a body outline in dorsal view. Photocomposite (A), created using separate, orthogonal images of blocks A–C, D, E, F–I, and J and combined digitally to reduce parallax. Blocks F, G, H, and I represent reflected counterpart.
Figure 2
Figure 2. Single dorsal photograph of TMP 2011.033.0001.
Sacral region represents original part—reflected counterpart shown in Fig. 4. Scale equals 1 m.
Figure 3
Figure 3. Interpretive scientific illustration of TMP 2011.033.0001 in dorsal view.
Sacral region represents original part—reflected counterpart shown in Fig. 4. Scale equals 1 m.
Figure 4
Figure 4. Composite dorsal view of TMP 2011.033.0001.
Photocomposite created using separate images of blocks A–C, D, E, F–I, and J (see Fig. 1) and combined digitally to both reduce parallax and remove gaps. Blocks F, G, H and I represent reflected counterpart of sacral part in Fig. 2. Photographs of individual blocks were digitally modified (brightness, contrast, etc.) to removed different lighting conditions, and to illustrate an average composite of the entire specimen. Scale equals 1 m.
Figure 5
Figure 5. Schematic line drawing of TMP 2011.033.0001 in dorsal view, with color coding illustrating different rock and tissue types.
Proportions based on Fig. 4. Scale equals 1 m.
Figure 6
Figure 6. Schematic line drawing of TMP 2011.033.0001 in dorsal view illustrating osteoderm nomenclature scheme.
Colors illustrate osteoderm regions (cervical, transitional, thoracic, sacral, forelimb), and transverse rows (1, 2, 3…), with letter labeling (A, B, C…) indicating position from dorsal midline. Proportions based on Fig. 4. Scale equals 1 m.
Figure 7
Figure 7. Linear osteoderm measurements used in allometric and morphometric analyses.
Schematic drawing illustrating the four linear measurements obtained for representative osteoderms with (A) well-developed spines, (B) moderately developed spine, and (C) medial ridge. AP-L, anteroposterior length; T-W, transverse width; H, height; SL, spine length. AP-L, T-W, and H are mutually orthogonal and rectilinear.
Figure 8
Figure 8. Plots illustrating osteoderm count, variation, and linear measurements across the transverse osteoderm rows.
(A) Line drawing illustrating color coding of osteoderm regions and transverse rows in TMP 2011.033.0001 (see Fig. 6). (B) Osteoderm count for each transverse row. (C) Total variation within each osteoderm row. (D) Variation of each linear metric within each osteoderm row. Raw measures of osteoderm anteroposterior length (AP-L) (E), transverse width (T-W) (F), osteoderm height (H) (G), and total spine length (SL) (H). Stars in (G) and (H) indicate outlying parascapular spine morphs.
Figure 9
Figure 9. Allometry of osteoderms.
Spine length (SL) regressed as a function of anteroposterior basal length (AP-L) for bilaterally averaged (A) and bilaterally independent (B) osteoderms. Colors pertain to osteoderm region (see Fig. 6). Ordinary least squares regression indicated by solid line (Table 1), shaded area indicates 95% CI of the relationship, and dotted lines indicate 95% predication interval of points. Plots (C) and (D) illustrate histograms of the residuals of (A) and (B) (respectively) with vertical dotted lines indicating standard deviations. Stars indicate outlying parascapular spines.
Figure 10
Figure 10. Photographs and line drawing of the left parascapular spine (T1FL) of TMP 2011.033.0001, showing the morphology of the keratinous sheath and bony core.
(A and B) Dorsal view of complete left parascapular spine. (C and D) Close up (dorsal view), showing the distal break in the spine, with bone core proximal and not bone core distal. (E and F) Distal (dorsolateral) view of break, showing proximal cross-section surface with bony core. (G and H) Proximal (dorsomedial) view of break, showing distal cross-section surface without bony core. Color code same as Fig. 3. Scale bars equal 10 cm for (A–D), and 5 cm for (E–H).
Figure 11
Figure 11. Allometry of keratinous sheath as a function of bony core length across the osteoderm series.
(A) Schematic line drawing of representative osteoderms in (B), showing the relative contribution of the keratinous sheath. Numbers above each osteoderm indicate the percentage of the total length formed by keratin only. Spines T1EL, C1BL, C3BL and T1FL reflected. (B) Keratinous-only sheath length (i.e., the portion projecting beyond bony core) regressed as a function of osteoderm bony core length. Ordinary least squares regression indicated by solid line (Table 2), shaded area indicates 95% CI of the relationship, and dotted lines indicate 95% predication interval of points. Colors pertain to osteoderm region (see Fig. 6), and stars indicates parascapular spine. Blue “+” and corresponding convex hull, indicated range of relationship between bony core length and keratinous sheath length in a sample of domestic cattle horns.
Figure 12
Figure 12. Osteoderm morphometrics.
(A) Plot illustrating PC scores for PC1 (90.5% of variation) and PC2 (5.2% of variation) resulting from a principle component analysis of 142 osteoderms (Table 3). Colors reflect osteoderm regions: cervical (red), transitional (orange), thoracic (green). Points for rows C1–T1 are illustrated by letters (see Fig. 4), while T2–T12 are illustrated by dots. Colored areas represent minimum convex hulls for each row/region (T1 separate from T2–T12). “*” Denotes parascapular spines. (B) Loading of variables for principal component analysis in (A).
Figure 13
Figure 13. Cluster analysis of osteoderms.
Cluster dendrogram of nodosaur osteoderms based on PC scores, under “average” (UPGMA) agglomeration method. Colors denote regions while “*” denotes left/right pairs.
Figure 14
Figure 14. Comparison of horn core/sheath size and allometry in nodosaur osteoderms with modern cranial horns.
Keratinous-only sheath length (i.e., the portion projecting beyond bony core) regressed as a function of bony core length, at both the specimen (A) level, and genus mean (B) level. Ordinary least squares regression indicated by solid line (Table 2), light dashed lines indicate 95% CI of the relationship, and dotted lines indicate 95% predication interval of points. Thick dashed line has a slope of 1 and intercept of 0. Diamonds indicate cranial horns, with small (A) representing individual horns, large (B) indicating genus means, and polygons (B) indicating minimum convex hulls. Circles indicate postcranial osteoderms of Borealopelta.
Figure 15
Figure 15. Comparisons of the size of the bony core and keratinous sheath of the parascapular spine of Borealopelta to modern bovid and squamate analogues.
(A) Absolute size of the bone core (horncore or osteoderm) (yellow) and the overlying keratinous/horn sheath (grey) for the parascapular spine of TMP 2011.033.0001 (top) as well as averages for several bovid and squamate taxa (lower). (B) Schematic representations of the relative bony and keratinous components of select spines/horns (adjusted to same size). Data for Oreamnos americanus (n = 6, 20) and Oreamnos harringtoni (n = 10, 13) from Mead & Lawler (1995), Bos (n = 18) from Grigson (1975), Antilocapra (n = 3) and Bison (n = 18) from Borkovic (2013), Ovis nivicola (n = 2), Ovis dalli (n = 2), Ovis ammon (n = 2), Ovis canadensis nelsoni (n = 5), Ovis canadensis canadensis (n = 8), Capra ibex sibirica (n = 4) and Capra ibex ibex (n = 5) from Bubenik (1990), Trioceros (n = 1) from TMP 1990.007.0350, Phrynosoma solare (n = 1) from LACM 123351, and P. asio (n = 1) from WLH 1093.

References

    1. Alberch P, Gould SJ, Oster GF, Wake DB. Size and shape in ontogeny and phylogeny. Paleobiology. 1979;5(3):296–317. doi: 10.1017/s0094837300006588. - DOI
    1. Arbour VM. Estimating impact forces of tail club strikes by ankylosaurid dinosaurs. PLOS ONE. 2009;4(8):e6738. doi: 10.1371/journal.pone.0006738. - DOI - PMC - PubMed
    1. Arbour VM, Burns ME, Bell PR, Currie PJ. Epidermal and dermal integumentary structures of ankylosaurian dinosaurs. Journal of Morphology. 2014;275(1):39–50. doi: 10.1002/jmor.20194. - DOI - PubMed
    1. Arbour VM, Currie PJ. Euoplocephalus tutus and the diversity of ankylosaurid dinosaurs in the Late Cretaceous of Alberta, Canada, and Montana, USA. PLOS ONE. 2013a;8(5):e62421. doi: 10.1371/journal.pone.0062421. - DOI - PMC - PubMed
    1. Arbour VM, Currie PJ. The taxonomic identity of a nearly complete ankylosaurid dinosaur skeleton from the Gobi Desert of Mongolia. Cretaceous Research. 2013b;46:24–30. doi: 10.1016/j.cretres.2013.08.008. - DOI

LinkOut - more resources