

Single Nucleotide Polymorphism Genotyping in Single-Molecule Electronic Circuits
- PMID: 29201610
- PMCID: PMC5700462
- DOI: 10.1002/advs.201700158
Single Nucleotide Polymorphism Genotyping in Single-Molecule Electronic Circuits
Abstract
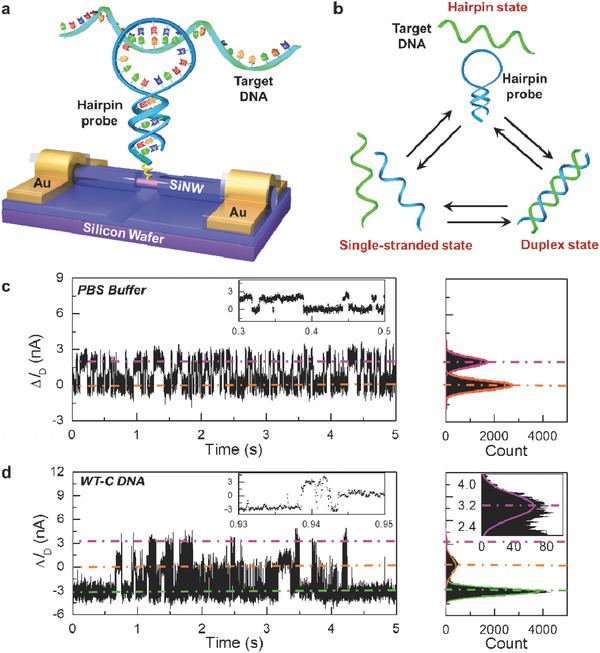
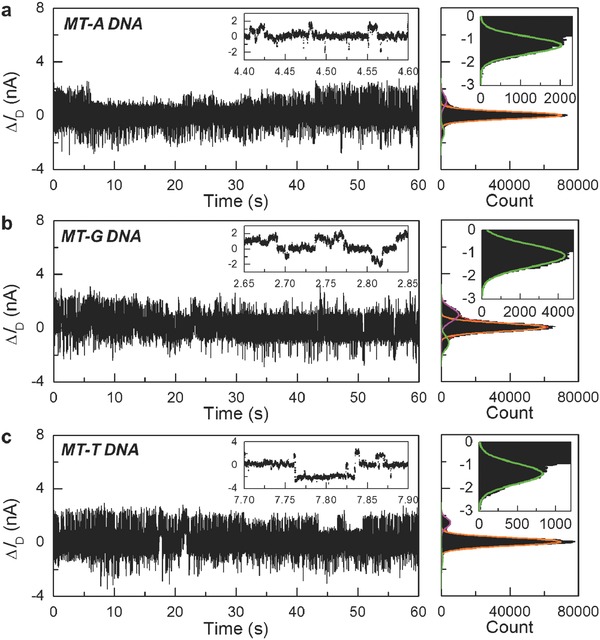
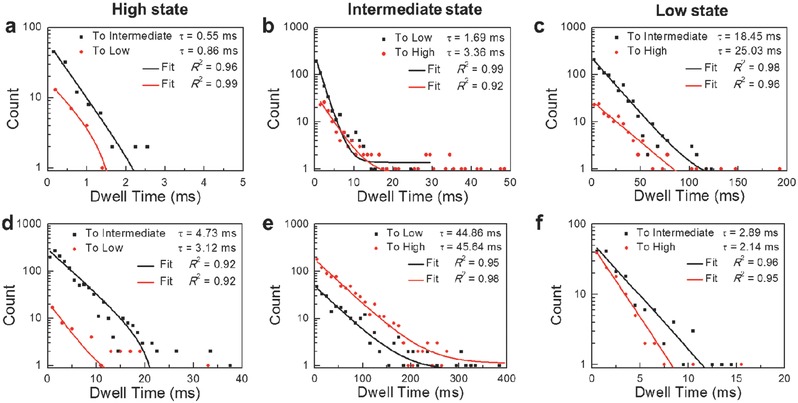
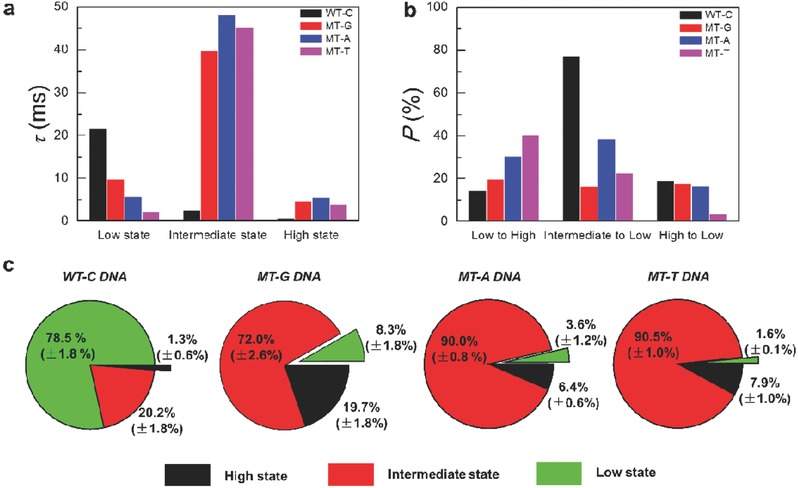
Establishing low-cost, high-throughput, simple, and accurate single nucleotide polymorphism (SNP) genotyping techniques is beneficial for understanding the intrinsic relationship between individual genetic variations and their biological functions on a genomic scale. Here, a straightforward and reliable single-molecule approach is demonstrated for precise SNP authentication by directly measuring the fluctuations in electrical signals in an electronic circuit, which is fabricated from a high-gain field-effect silicon nanowire decorated with a single hairpin DNA, in the presence of different target DNAs. By simply comparing the proportion difference of a probe-target duplex structure throughout the process, this study implements allele-specific and accurate SNP detection. These results are supported by the statistical analyses of different dynamic parameters such as the mean lifetime and the unwinding probability of the duplex conformation. In comparison with conventional polymerase chain reaction and optical methods, this convenient and label-free method is complementary to existing optical methods and also shows several advantages, such as simple operation and no requirement for fluorescent labeling, thus promising a futuristic route toward the next-generation genotyping technique.
Keywords: label‐free detection; silicon nanowires; single nucleotide polymorphism; single‐molecule devices.
Figures
Similar articles
-
Single-Molecule Electrical Detection: A Promising Route toward the Fundamental Limits of Chemistry and Life Science.Acc Chem Res. 2020 Jan 21;53(1):159-169. doi: 10.1021/acs.accounts.9b00347. Epub 2019 Sep 23. Acc Chem Res. 2020. PMID: 31545589
-
Point decoration of silicon nanowires: an approach toward single-molecule electrical detection.Angew Chem Int Ed Engl. 2014 May 12;53(20):5038-43. doi: 10.1002/anie.201309438. Epub 2014 Mar 25. Angew Chem Int Ed Engl. 2014. PMID: 24668898
-
A self-assembled deoxyribonucleic acid concatemer for sensitive detection of single nucleotide polymorphism.Anal Chim Acta. 2013 Dec 4;804:235-9. doi: 10.1016/j.aca.2013.09.055. Epub 2013 Oct 5. Anal Chim Acta. 2013. PMID: 24267087
-
Enabling large-scale pharmacogenetic studies by high-throughput mutation detection and genotyping technologies.Clin Chem. 2001 Feb;47(2):164-72. Clin Chem. 2001. PMID: 11159763 Review.
-
Fluorescent Biosensors Based on Single-Molecule Counting.Acc Chem Res. 2016 Sep 20;49(9):1722-30. doi: 10.1021/acs.accounts.6b00237. Epub 2016 Sep 1. Acc Chem Res. 2016. PMID: 27583695 Review.
Cited by
-
Visualizing single-molecule conformational transition and binding dynamics of intrinsically disordered proteins.Nat Commun. 2023 Aug 25;14(1):5203. doi: 10.1038/s41467-023-41018-x. Nat Commun. 2023. PMID: 37626077 Free PMC article.
-
Detecting DNA and RNA and Differentiating Single-Nucleotide Variations via Field-Effect Transistors.Nano Lett. 2020 Aug 12;20(8):5982-5990. doi: 10.1021/acs.nanolett.0c01971. Epub 2020 Aug 3. Nano Lett. 2020. PMID: 32706969 Free PMC article.
References
-
- a) Rebbeck T. R., Spitz M., Wu X., Nat. Rev. Genet. 2004, 5, 589; - PubMed
- b) Thibodeau S. N., French A. J., McDonnell S. K., Cheville J., Middha S., Tillmans L., Riska S., Baheti S., Larson M. C., Fogarty Z., Zhang Y., Larson N., Nair A., O'Brien D., Wang L., Schaid D. J., Nat. Commun. 2015, 6, 8653. - PMC - PubMed
LinkOut - more resources
Full Text Sources
Other Literature Sources