Review
. 2017 Nov 22:14:19-28.
doi: 10.1016/j.bdq.2017.11.001. eCollection 2017 Dec.

qPCR primer design revisited

Affiliations
Review

qPCR primer design revisited

Stephen Bustin et al. Biomol Detect Quantif. .

Abstract

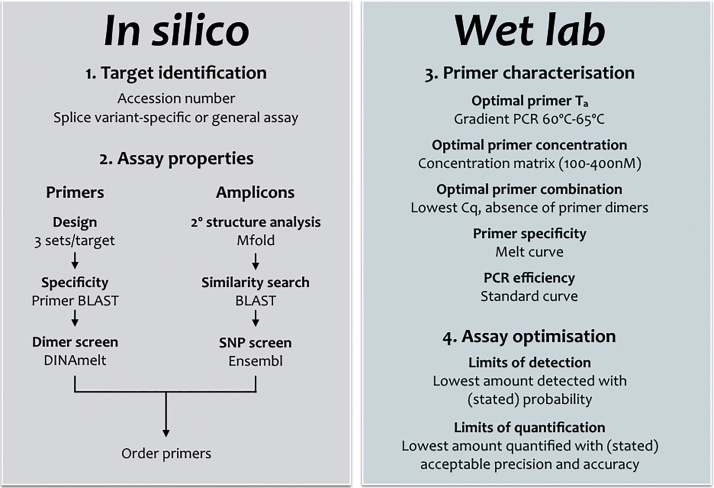
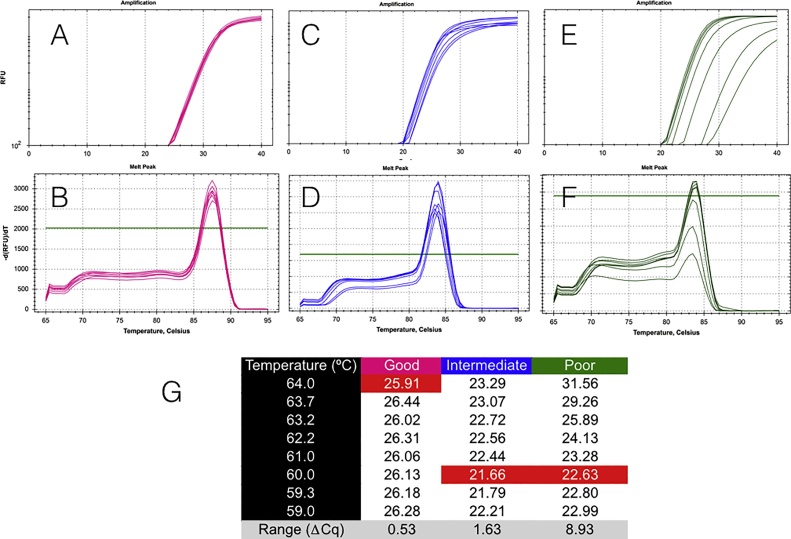
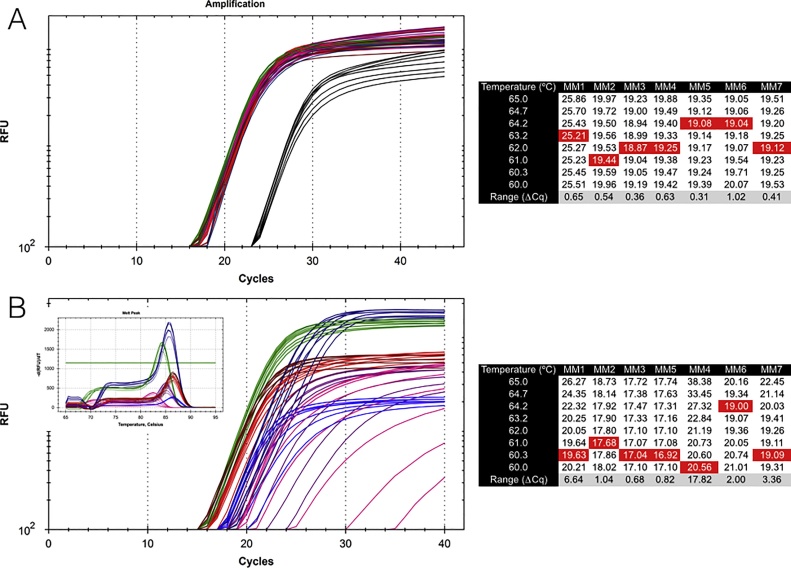
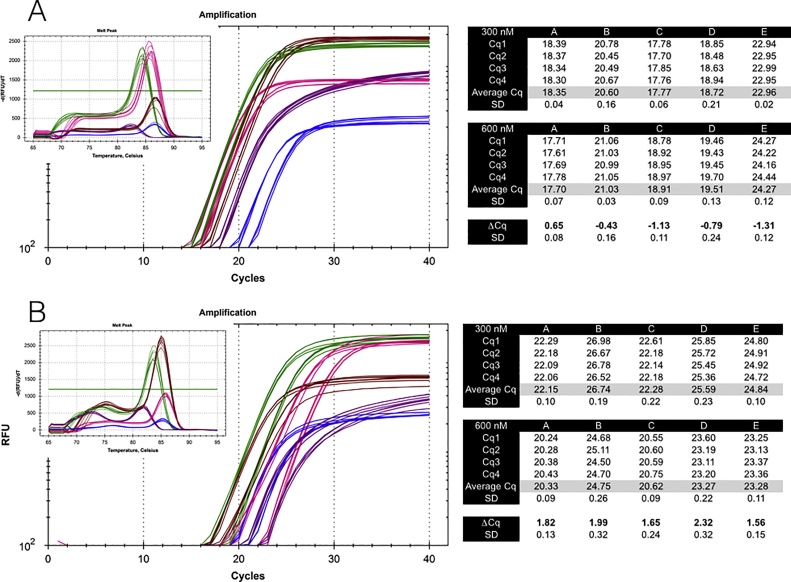
Primers are arguably the single most critical components of any PCR assay, as their properties control the exquisite specificity and sensitivity that make this method uniquely powerful. Consequently, poor design combined with failure to optimise reaction conditions is likely to result in reduced technical precision and false positive or negative detection of amplification targets. Despite the framework provided by the MIQE guidelines and the accessibility of wide-ranging support from peer-reviewed publications, books and online sources as well as commercial companies, the design of many published assays continues to be less than optimal: primers often lack intended specificity, can form dimers, compete with template secondary structures at the primer binding sites or hybridise only within a narrow temperature range. We present an overview of the main steps in the primer design workflow, with data that illustrate some of the unexpected variability that often occurs when theory is translated into practice. We also strongly urge researchers to report as much information about their assays as possible in their publications.

Keywords: Assay design; MIQE; Oligonucleotides; Real-time PCR.


Figures

Fig. 1
Fig. 1
Workflow for PCR primer design. The following web sites are pertinent: PrimerBlast: https://www.ncbi.nlm.nih.gov/tools/primer-blast; DINAmelt: http://unafold.rna.albany.edu/?q=DINAMelt; Mfold: http://unafold.rna.albany.edu/?q=mfold; BLAST: https://blast.ncbi.nlm.nih.gov/Blast.cgi; Ensembl: http://www.ensembl.org/index.html;.
Fig. 2
Fig. 2
Temperature gradient analysis of three assays targeting fungal rRNA genes. Effect of different commercial master mixes on gradient profile. Amplification was carried out in 10 μL using BioRad’s iTaq Universal SYBR Green Supermix (172-5121) with 300 nM final primer concentration on a BioRad CFX instrument, with a three minute 95 °C denaturation step followed by 40 cycles of 5 s at 95 °C and 30 s at 62 °C. (For interpretation of the references to colour in this figure legend, the reader is referred to the web version of this article.) Primers were Asp-F: CTTGGATTTGCTGAAGACTAAC and Asp-R: CTAACTTTCGTTCCCTGATTAATG, amplicon size 76 bp. This assay is robust, with the amplification plots virtually indistinguishable at the eight temperatures tested. B: Melt curve. C. Primers were FS1-F: GAGGATGCTTTTGGTGAG and FS1-R: GAGCTTTACAGAGGATCG, amplicon size 99 bp. This assay is somewhat less robust, recording visible differences in Cq. D: Melt curve. E. Primers were FS2-F: CCCGAGTTGTAATTTGTAG and FS2-R: GAAGGAGCTTTACAGAGG, amplicon size 121 bp. This assay is poor, with significantly higher Cqs at temperatures away from the optimum. F: melt curve. G. Table of the Cqs recorded for the three assays, with the assays recording ΔCqs of 0.53, 1.63 and 8.93, respectively, between optimal (highlighted in red) and least optimal temperatures. Amplification conditions were as described in the legend to Fig. 5.
Fig. 3
Fig. 3
Effect of different commercial master mixes on gradient profile. Amplification reactions were carried out as described in the legend to Fig. 2, except that seven different master mixes were used and annealing was carried out using a temperature gradient from 60 °C–65 °C. A. Primers CA-F: GTTTGGTGTTGAGCAATAC and CA-R: CTACCTGATTTGAGGTCAAA were used to amplify fungal genomic DNA and PCR amplicons were detected with a hydrolysis probe CA-Pr: FAM-ACAATGGCTTAGGTCTAAC-BHQ. All master mixes record similarly robust gradient profiles, although the Cqs from one master mix are lower than those from the rest. The optimal annealing temperatures are highlighted in red and differ between the master mixes. B. A. Primers BAR-1F: CATGCTCCAAAATGCCCTA and BAR-1R: CTTGGTAGCACACCCAAA were used to amplify bacterial genomic DNA and PCR amplicons were detected with SYBR Green chemistry. The quality of the gradient profile depends on the master mix used, although the specificity is not affected, as determined by the melt curves. The optimal annealing temperatures are highlighted in red and differ between the master mixes.
Fig. 4
Fig. 4
Master mix-dependent effects of primer concentration. Amplification was carried using five commercial master mixes and conditions, except for primer concentration, were as described in the legend to Fig. 2. A. Primers CA-F and CA-R were used at either 300 nM or 600 nM final concentration to amplify fungal genomic DNA and PCR amplicons were detected with SYBR Green chemistry. Doubling the primer concentration has a small deleterious effect with most master mixes, with the maximum effect an increase in Cq of 1.3. B. Primers BAR-1F and BAR-1R were used at either 300 nM or 600 nM final concentration to amplify bacterial genomic DNA and PCR amplicons were detected with SYBR Green chemistry. Doubling the primer concentration has an enhancing effect with all master mixes, with the maximum effect a decrease in Cq of 2.3.
Fig. 5
Fig. 5
Comparison of Clostridium difficile assays targeting the toxin gene tcdB. A. Location of the assays. Amplicon A (blue) is 149 bp, amplicon B (green) is 121 bp and amplicon C (black) is 76 bp. The primers for assay A are tcdB-FA: GTCCATCCTGTTTCCCAAGCAA, tcdB-RA: AGCCACACTTATCTATATATGACGTATTGGA, those for assay B are tcdB-FB: CAACTGAACAAGAAATGGCTAGCTT and tcdB-RB: CTCCTTGTCAACTACTATATTTTGAG, those assay C are tcdB-FC: GCGGCAGCTTATCAAGATTT and tcdB-RC: TTCTTAAATCAGCTTCTATCAAATGG. B. Mfold analysis indicates no secondary structure issues at the primer binding sites. C. Amplification plots and melt curves for the PCR amplicons A and B. D. Amplification plots and melt curves for the PCR amplicons B and C. The blue, green and black data were obtained for amplicons A, B or C, respectively. Amplification conditions were as described in the legend to Fig. 2.
Fig. 6
Fig. 6
Effects of different master mixes on amplification. Amplification reactions were carried out as described in the legend to Fig. 2. A. A qPCR assay targeting fungal DNA was used with two sets of forward and reverse primers, which differ mainly at their 3′-ends. The PCR amplicon has no secondary structure issues at the primer binding sites. B. When used with master mix A, the maximum ΔCq between the primer combinations was 4.64, the equivalent of a 25-fold difference in sensitivity. The assays using CA-R recorded the lowest Cqs, whereas those using CA-RB recorded higher Cqs. When used with master mix B, the maximum ΔCq between the primer combinations was 2.98, the equivalent of an 8-fold difference in sensitivity. The assay using CA-F/CA-R recorded the lowest Cqs, with the other three broadly equivalent. C. Melt curves for master mixes A (green) and B (blue) show that the specificity of the assays is the same for all primer combinations.
Fig. 7
Fig. 7
Linearity of a well-designed qPCR assay. Amplification reactions were carried out as described in the legend to Fig. 2. Ten-fold serial dilutions of target DNA were subjected to amplification with the Asp-F and R primers. The variability recorded by the four replicates increases with decreasing target copy number, until the nominal single copy target fails to record a Cq in 4/5 replicates.
Fig. 8
Fig. 8
Comparability of two optimised qPCR assays targeting the same gene HIF-1α (NM_181054.2). Amplification reactions were carried out as described in the legend to Fig. 2, except that annealing was carried out using a temperature gradient from 55 °C–65 °C. A. Exon/intron structure of the gene, with assay 1 (HIF-AF: CCGAGGAAGAACTATGAA and HIF-AR:TGGTTACTGTTGGTATCA) amplifying sequences in exons 5 and 6 and assay 2 (HIF-BF: AAGAACTTTTAGGCCGCTCA and HIF-BR:TGTCCTGTGGTGACTTGTCC) amplifying sequences in exons 7 and 8. B. There are no secondary structures issues at the primer binding sites. C. Both assays are robust, with the 55°–65° gradient recording similar qs of 24.68 ± 0.07 and 24.32 ± 0.12, respectively. Melt curve analysis shows a single peak. D. Standard curves are comparable, showing linearity at least over five orders of magnitude.

References

    1. Bustin S.A. The reproducibility of biomedical research: sleepers awake. Biomol. Detect. Quantif. 2014;2:35–42. - PMC - PubMed
    1. Cankar K., Stebih D., Dreo T., Zel J., Gruden K. Critical points of DNA quantification by real-time PCR-effects of DNA extraction method and sample matrix on quantification of genetically modified organisms. BMC Biotechnol. 2006;6:37. - PMC - PubMed
    1. Raggi C.C., Verderio P., Pazzagli M., Marubini E., Simi L., Pinzani P. An Italian program of external quality control for quantitative assays based on real-time PCR with Taq-Man probes. Clin. Chem. Lab. Med. 2005;43:542–548. - PubMed
    1. Buzard G.S., Baker D., Wolcott M.J., Norwood D.A., Dauphin L.A. Multi-platform comparison of ten commercial master mixes for probe-based real-time polymerase chain reaction detection of bioterrorism threat agents for surge preparedness. Forensic Sci. Int. 2012;223:292–297. - PubMed
    1. Alemayehu S., Feghali K.C., Cowden J., Komisar J., Ockenhouse C.F., Kamau E. Comparative evaluation of published real-time PCR assays for the detection of malaria following MIQE guidelines. Malar. J. 2013;12:277. - PMC - PubMed