. 2017 Nov 16:7:475.
doi: 10.3389/fcimb.2017.00475. eCollection 2017.

Predictable, Tunable Protein Production in Salmonella for Studying Host-Pathogen Interactions

Affiliations

Predictable, Tunable Protein Production in Salmonella for Studying Host-Pathogen Interactions

Kendal G Cooper et al. Front Cell Infect Microbiol. .

Abstract

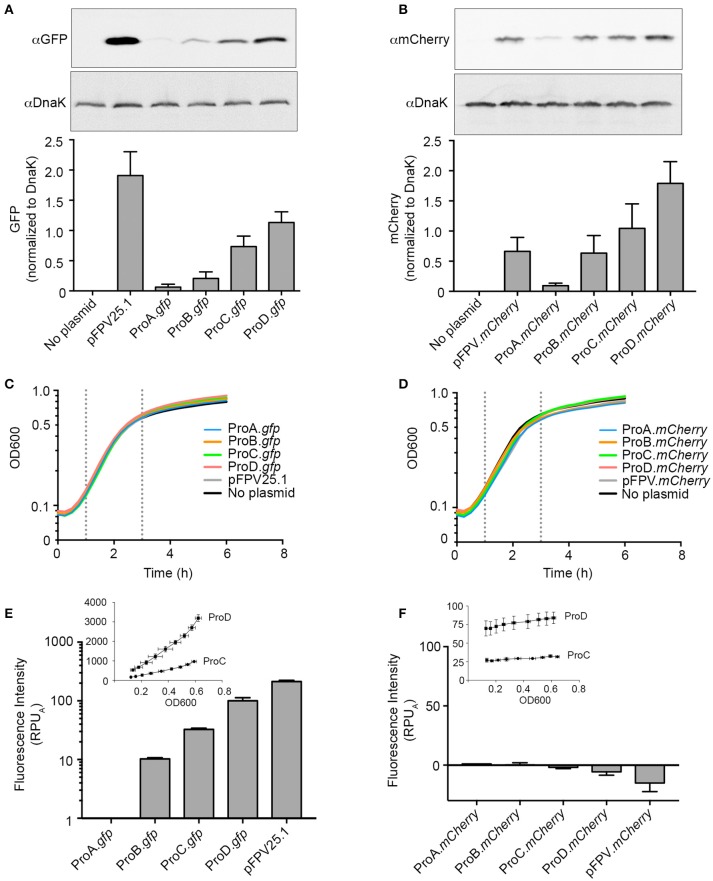
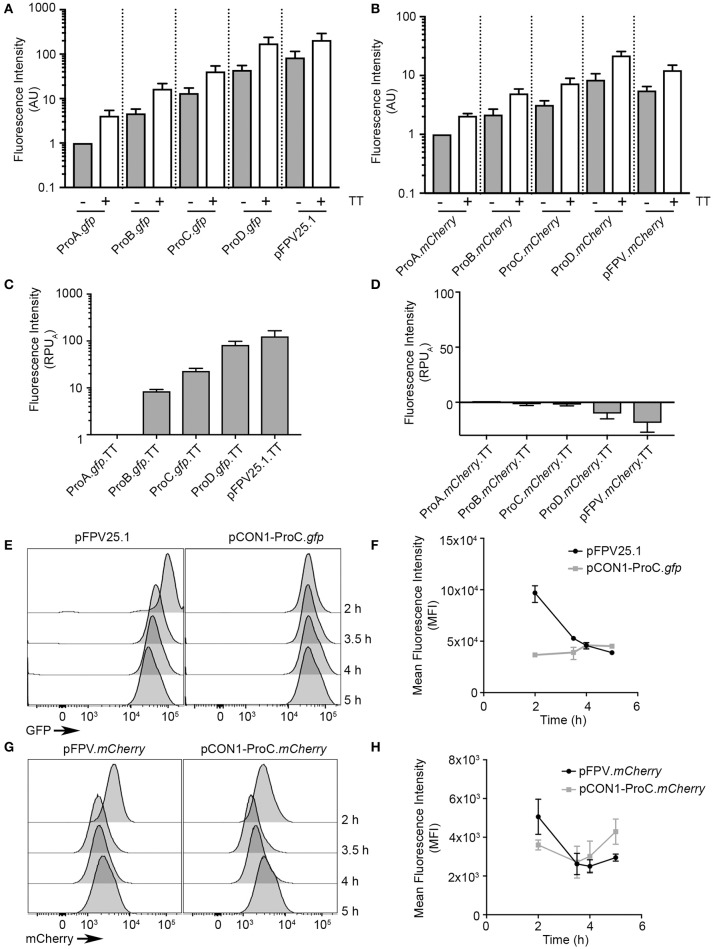
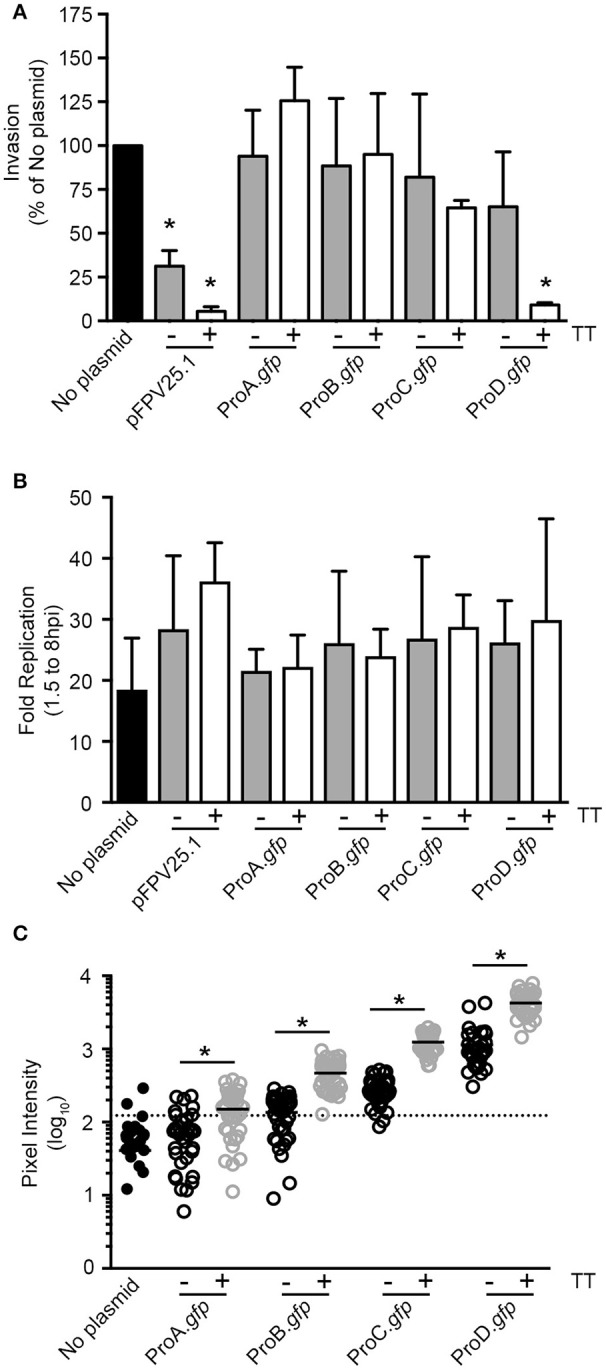
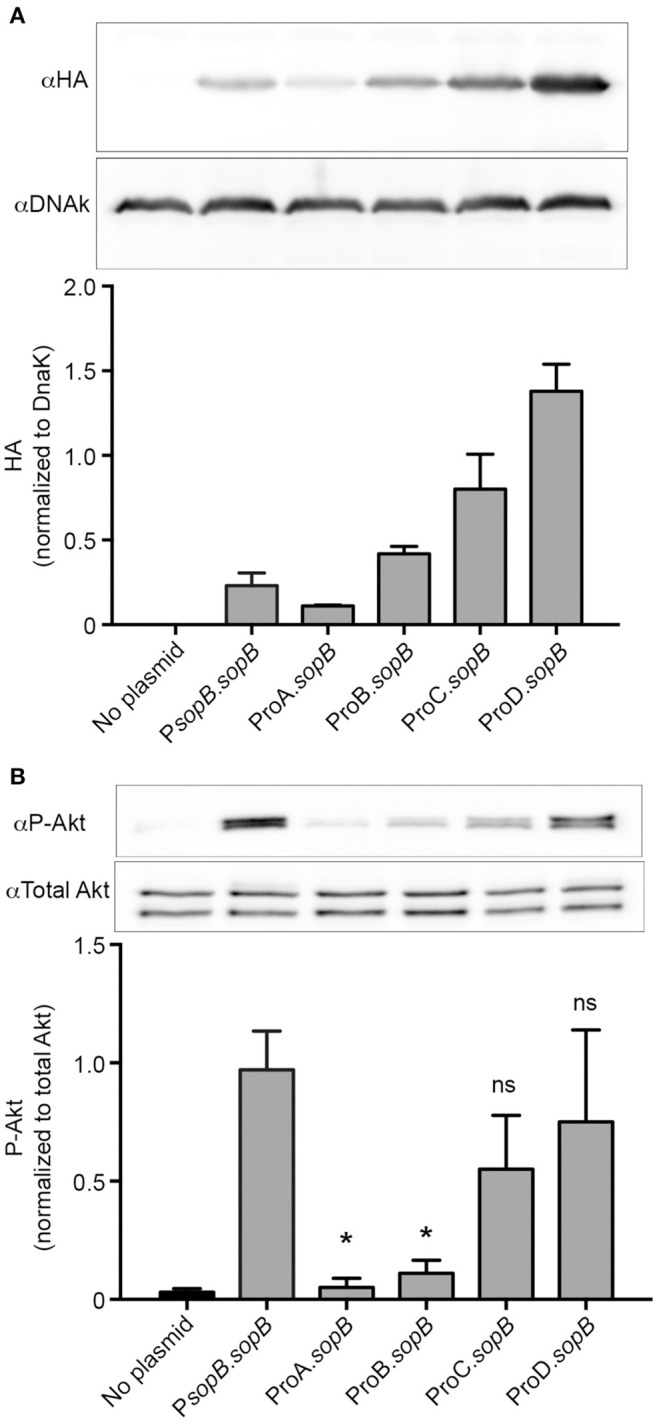
Here we describe the use of synthetic genetic elements to improve the predictability and tunability of episomal protein production in Salmonella. We used a multi-pronged approach, in which a series of variable-strength synthetic promoters were combined with a synthetic transcriptional terminator, and plasmid copy number variation. This yielded a series of plasmids that drive uniform production of fluorescent and endogenous proteins, over a wide dynamic range. We describe several examples where this system is used to fine-tune constitutive expression in Salmonella, providing an efficient means to titrate out toxic effects of protein production.

Keywords: Salmonella; fluorescent protein; intracellular; plasmid; promoter; synthetic biology.


Figures

Figure 1
Figure 1
Evaluating synthetic promoter activity in Salmonella Typhimurium. (A,B) Bacteria harboring the indicated plasmids were grown to late-log phase in LB-Miller broth with aeration. Samples were solubilized and processed for immunoblotting using antibodies to detect GFP (A) or mCherry (B). DnaK was used as a loading control. Representative immunoblots are shown (top panels) along with quantification of three experiments by densitometry analysis (bottom panels). Shown is the ratio of GFP or mCherry signal to DnaK signal (mean ± SD). (C,D) Bacteria were grown in 96-well plates and fluorescence and OD600 measurements were taken every 15 min. Growth curves for strains harboring GFP constructs (C) or mCherry constructs (D). Shown is the mean OD600 of three independent experiments. Log phase is observed between 1 h and 3 h post inoculation (dotted lines). (E,F). Relative promoter units normalized to ProA (RPUA) were calculated using fluorescence of GFP (E) or mCherry (F) at 1.5 and 2.5 h time points. The fluorescence intensity for pCON-ProC.gfp and pCON-ProD.gfp or pCON-ProC.mCherry and pCON-ProD.mCherry during log phase is plotted against OD600 in the insets (Mean ± SD, n = 3).
Figure 2
Figure 2
Optimization of fluorescent protein production using a synthetic transcriptional terminator. Bacteria containing constructs with and without a synthetic transcriptional terminator (TT) were grown in 96-well plates and GFP fluorescence (A) or mCherry fluorescence (B) was measured at 2.5 h of growth (Mean ± SD, n = 3). AU, arbitrary units (C,D) as in Figure 1 relative promoter units were obtained by normalizing to ProA (RPUA) for GFP (C) or mCherry (D) at 1.5 and 2.5 h time points. (E–H) Flow cytometry analysis of bacteria harboring the indicated plasmids. Bacteria were harvested at early log (2 h), late log (3.5 h), early stationary (4 h), and late stationary (5 h) phases. Shown are representative histograms at the indicated time points for GFP constructs (E) or mCherry constructs (G). Fluorescence intensities of GFP (F) and mCherry (H) were plotted at each time point (Mean ± SD, n = 3).
Figure 3
Figure 3
Titration of GFP production in Salmonella can eliminate plasmid associated invasion defects. (A) Invasion assay in HeLa cells. Values were normalized to bacteria containing no plasmid (Mean ± SD, n = 3). (B) Replication assay in HeLa cells (Mean ± SD, n = 3). (C) GFP fluorescent intensities of intracellular bacteria at 1.5 hpi. Shown is data from one representative experiment; each dot represents one bacterial cell. The means are indicated. The threshold was set at three-fold the mean intensity of bacteria with no plasmid (dotted line). *Signifies P-value ≤ 0.05.
Figure 4
Figure 4
Tunable constitutive expression of the T3SS1 effector, SopB. (A) ΔsopB bacteria harboring the indicated plasmids were grown to late-log phase in LB-Miller broth with aeration. Samples were solubilized and processed for immunoblotting using antibodies to detect HA and DnaK. Representative immunoblots (top panel) are shown along with quantification of three experiments by densitometry analysis (bottom panel). Shown is the ratio of HA signal to DnaK signal (mean ± SD). (B) Infected HeLa cells were solubilized at 60 min pi and processed for immunoblotting using antibodies to detect phospho-Akt and total Akt. Representative immunoblots (top panel) are shown along with quantification of three experiments by densitometry analysis (bottom panel). Shown is the ratio of phospho-Akt signal to total Akt signal (mean ± SD). *Signifies P-value ≤ 0.05.
Figure 5
Figure 5
Tunable constitutive expression of the T3SS1 regulator, HilA. (A) Bacteria were grown in 125 mL flasks and OD600 measurements were taken every 30 min. Growth curves for bacteria harboring the indicated plasmids. Shown is mean OD600 of three independent experiments. (B) Late log phase samples were solubilized and processed for immunoblotting using antibodies to detect HA and DnaK. Representative immunoblots are shown (top panels) along with quantification of three experiments by densitometry analysis (bottom panels). Shown is the ratio of HA signal to DnaK signal (mean ± SD, n = 3). WT Salmonella (the chromosomal hilA is not HA-tagged) were used as a negative control for HA detection. (C) Invasion assay in HeLa cells. Values were normalized to WT (Mean ± SD, n = 3). np, no plasmid; low, low copy plasmid; med, medium copy plasmid. *Expression of hilA under ProC resulted in inconsistent growth and protein levels between experiments.
Figure 6
Figure 6
Design of the bidirectional environmental sensor plasmids. (A) Plasmid map of pCHAR-ProB.mCherry constructs. mCherry expression is driven by ProB; GFP expression is controlled by the glucose-6-phosphate (G6P) responsive promoter, PuhpT. (B,C) Induction of GFP fluorescence is G6P dependent. Late-log phase bacteria harboring pCHAR1-ProB.mCherry or Pnull-gfp (B) or pCHAR2-ProB.mCherry (C) were treated with 0–20 μM G6P and GFP (left) and mCherry (right) fluorescence was monitored in a plate-reader at 10 min intervals. Shown is data representative of three independent experiments with mean ± SD from triplicate samples.
Figure 7
Figure 7
The bidirectional sensor plasmid pCHAR1-ProB.mCherry is a reporter for cytosolic Salmonella. (A,B) Invasion and replication (1.5–8 hpi) assays in HeLa cells of bacteria harboring either pCHAR1-ProB.mCherry or Pnull.gfp (A), or pCHAR2-ProB.mCherry (B). Values were normalized to bacteria containing no plasmid (mean ± SD, n = 3). (C) Percentage of infected cells containing hyper-replicating Salmonella bearing either pCHAR1-ProB.mCherry or Pnull.gfp at 6 hpi. Infected cells containing >50 bacteria/cell were scored (Mean ± SD, n = 3). (D,E) Fluorescence intensities in HeLa cells of vacuolar or cytosolic hyper-replicating Salmonella. Cells infected with bacteria harboring pCHAR1-ProB.mCherry, pCHAR1 or Pnull.gfp were fixed at 6 hpi and cytosolic bacteria were identified either by GFP signal (D) or by digitonin permeabilization (DPA) followed by antibody labeling (E). GFP fluorescence intensities were measured within pixel areas identified using either mCherry signal (pCHAR1-ProB.mCherry) or from fluorescent immunolabeling (pCHAR1 and Pnull.gfp). Each data point represents an infected cell. Data are combined from 3 independent experiments. The mean is indicated. (F) Representative confocal images of HeLa cells with vacuolar and cytosolic Salmonella harboring pCHAR1-ProB.mCherry used for quantification in (D,E). Digitonin permeabilized cells were identified by anti-Calnexin (blue) staining. Bacteria immunolabeling was done with anti-common structural antigen (CSA). Arrow indicates vacuolar bacteria. Scale bars, 10 or 2 μm.
Figure 8
Figure 8
Use of pCHAR2-ProB.mCherry to compare replication rates in intracellular Salmonella by live cell imaging. Live cell imaging of HeLa cells infected with Salmonella harboring pCHAR2-ProB.mCherry between 3 and 22 hpi. (A) Fluorescent intensity of cells containing GFP+ cytosolic bacteria increases with time. Inset: The fluorescent intensity of individual GFP+ cytosolic bacteria does not increase with time. (B) The doubling time of cytosolic bacteria during log growth was calculated using GFP intensity over time. (C) The maximum fold change in mCherry intensity vs. 3 hpi was calculated to determine the vacuolar replication rate from the same image sets. The percentage of cells with a fold change >6 is reported. Each data point represents an infected cell. Data are combined from three independent experiments. The mean is indicated.

Similar articles

Cited by

References

    1. Bajaj V., Hwang C., Lee C. A. (1995). hilA is a novel ompR/toxR family member that activates the expression of Salmonella typhimurium invasion genes. Mol. Microbiol. 18, 715–727. 10.1111/j.1365-2958.1995.mmi_18040715.x - DOI - PubMed
    1. Bajaj V., Lucas R. L., Hwang C., Lee C. A. (1996). Co-ordinate regulation of Salmonella typhimurium invasion genes by environmental and regulatory factors is mediated by control of hilA expression. Mol. Microbiol. 22, 703–714. 10.1046/j.1365-2958.1996.d01-1718.x - DOI - PubMed
    1. Carpenter A. E., Jones T. R., Lamprecht M. R., Clarke C., Kang I. H., Friman O., et al. . (2006). CellProfiler: image analysis software for identifying and quantifying cell phenotypes. Genome Biol. 7:1. 10.1186/gb-2006-7-10-r100 - DOI - PMC - PubMed
    1. Clark L., Martinez-Argudo I., Humphrey T. J., Jepson M. A. (2009). GFP plasmid-induced defects in Salmonella invasion depend on plasmid architecture, not protein expression. Microbiology 155, 461–467. 10.1099/mic.0.025700-0 - DOI - PubMed
    1. Cooper K. G., Winfree S., Malik-Kale P., Jolly C., Ireland R., Knodler L. A., et al. . (2011). Activation of Akt by the bacterial inositol phosphatase, SopB, is wortmannin insensitive. PLoS ONE 6:e22260. 10.1371/journal.pone.0022260 - DOI - PMC - PubMed

Publication types

LinkOut - more resources