. 2017 Nov 16:5:303.
doi: 10.3389/fpubh.2017.00303. eCollection 2017.

Predictive Assessment of Cancer Center Catchment Area from Electronic Health Records

Affiliations

Predictive Assessment of Cancer Center Catchment Area from Electronic Health Records

Luca Salmasi et al. Front Public Health. .

Abstract

Healthcare facilities (HF) may identify catchment areas (CA) by selecting criteria that depend on various factors. These refer to hospital activities, geographical definition, patient covariates, and more. The analyses that were traditionally pursued have a limiting factor in the consideration of only static conditions. Instead, some of the CA determinants involve influences occurring at both temporal and spatial scales. The study of CA in the cancer context means choosing between HF, usually divided into general hospitals versus oncological centers (OCs). In the CA context, electronic health records (EHRs) promise to be a valuable source of information, one driving the next-generation patient-driven clinical decision support systems. Among the challenges, digital health requires the re-definition of a role of stochastic modeling to deal with emerging complexities from data heterogeneity. To model CA with cancer EHR, we have chosen a computational framework centered on a logistic model, as a reference, and on a multivariate statistical approach. We also provided a battery of tests for CA assessment. Our results indicate that a more refined CA model's structure yields superior discrimination power between health facilities. The increased significance was also visualized by comparative evaluations with ad hoc geo-localized maps. Notably, a cancer-specific spatial effect can be noticed, especially for breast cancer and through OCs. To mitigate the data distributional influences, bootstrap analysis was performed, and gains in some cancer-specific and spatially concentrated regions were obtained. Finally, when the temporal dynamics are assessed along a 3-year timeframe, negligible differential effects appear between predicted probabilities observed between standard critical values and bootstrapped values. In conclusion, for interpreting CA in terms of both spatial and temporal dynamics, sophisticated models are required. The one here proposed suggests that bootstrap can improve test accuracy. We recommend that evidences from stochastic modeling are merged with visual analytics, as this combination may be exploited by policy-makers in support to quantitative CA assessment.

Keywords: bootstrap; cancer patients; catchment area; multivariate adaptive regression splines; testing.


Figures

Figure 1
Figure 1
Catchment areas (lung, bronchus, and trachea cancers). Assignment by using predicted probabilities from the parametric logistic model (top row) and multivariable regression spline (MARS) (bottom row). Patients of the Region of Umbria (Italy): 2007–2009. All hospitals (left panels), oncological center (OC) (central panel), and general hospital (GH) (right panel). MARS appears overall as the best model in light of the more diffuse high significance spots in the map (left panels). Evidences indicate diverse assignments to OC and GH. Dark blue corresponds to a probability level between 75 and 100%, lighter spots represent decreasing levels of probabilities.
Figure 2
Figure 2
Catchment areas (breast cancer). Assignment by using predicted probabilities from the parametric logistic model (top row) and multivariable regression spline (MARS) (bottom row). Patients of the Region of Umbria (Italy): 2007–2009. All hospitals (left panels), oncological center (OC) (central panel), and general hospital (GH) (right panel). MARS appears overall as the best model in light of the more diffuse high significance spots in the map (left panels). Evidences indicate diverse assignments to OC and GH. Dark blue corresponds to a probability level between 75 and 100%, lighter spots represent decreasing levels of probabilities.
Figure 3
Figure 3
Catchment areas (prostate cancer). Assignment by using predicted probabilities from the parametric logistic model (top row) and multivariable regression spline (MARS) (bottom row). Patients of the Region of Umbria (Italy): 2007–2009. All hospitals (left panels), oncological center (OC) (central panel), and general hospital (GH) (right panel). MARS appears overall as the best model in light of the more diffuse high significance spots in the map (left panels). Evidences indicate diverse assignments to OC and GH. Dark blue corresponds to a probability level between 75 and 100%, lighter spots represent decreasing levels of probabilities.
Figure 4
Figure 4
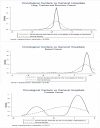
Bootstrap empirical distributions. Values on the x-axis represent z-scores. Municipalities were considered with greatest values of dissimilarity from Normal distribution, as indicated by the Doornik–Hansen test. Three types of cancers were considered, lung, bronchus, and trachea (upper panel); breast (middle panel); and prostate (lower panel).
Figure 5
Figure 5
Test for catchment area assignment to OC or general hospital (GH) using z-scores. These were obtained as the difference of predicted probabilities from the multivariable regression spline (MARS) model for (A) lung, trachea, and bronchus; (B) breast (C) and prostate cancer patients of the Region of Umbria (2007–2009). Standard critical values at the upper panel; bootstrapped critical values at the lower panel. Dark blue corresponds to a positive difference significant at the 1% level, lighter spots represent decreasing levels of significance, 5 and 10%, respectively. Light blue corresponds to the interval [−1.645, 1.645], which means no significance. Lighter blue below the interval represents negative and significant differences, at the 10, 5, and 1%, respectively.
Figure 6
Figure 6
Test for CA temporal variation in breast cancer during 2007–2009 using z-scores. These were obtained as the difference of predicted probabilities from the multivariable regression spline (MARS) model. The example refers to breast cancer with standard critical values (upper panel) and with bootstrapped ones (lower panel). Patients of the Region of Umbria according to oncological center (OC) (left panel) and general hospital (GH) (right panel). Dark blue corresponds to a positive variation significant at the 1% level, while lighter spots represent decreasing levels of significance, 5 and 10%, respectively. Darker blue corresponds to the interval [−1.645, 1.645], which means no significance, and lighter blue below the interval represents negative and significant variations, at the 10, 5, and 1%, respectively.

Similar articles

Cited by

References

    1. Norris D, Levy D. Precision medicine is a value-of-information and vice-versa. J Prec Med (2015) 1(1):57–63.
    1. Minelli C, Baio G. Value of information: a tool to improve research prioritization and reduce waste. PLoS Med (2015) 12(9):e1001882.10.1371/journal.pmed.1001882 - DOI - PMC - PubMed
    1. Garnick DW, Luft HS, Robinson JC, Tetreault J. Appropriate measures of hospital market areas. Health Serv Res (1987) 22(1):69–89. - PMC - PubMed
    1. Gilmour SJ. Identification of hospital catchment areas using clustering: an example from the NHS. Health Serv Res (2010) 45(2):497–513.10.1111/j.1475-6773.2009.01069.x - DOI - PMC - PubMed
    1. Onyile A, Vaidya SR, Kuperman G, Shapiro JS. Geographical distribution of patients visiting a health information exchange in New York City. J Am Med Inform Assoc (2013) 20(e1):e125–30.10.1136/amiajnl-2012-001217 - DOI - PMC - PubMed